DOI:
10.1039/D1MA00300C
(Paper)
Mater. Adv., 2021,
2, 3715-3725
Tailorable microwave absorption characteristics of bio waste-based composites through a macroscopic design
Received
1st April 2021
, Accepted 15th April 2021
First published on 16th April 2021
Abstract
Biologically sourced filler such as a dried cow dung (dielectric)-loaded polydimethyl siloxane (PDMS) composite for broadband microwave absorption is explored in this study. PDMS is a well-known elastomer for electromagnetic (EM) applications due to its numerous advantages of being lightweight, flexible, and corrosion protective, and having facile preparation and large area fabrication. The optimally prepared a 8-mm thick PDMS-cow dung (PC) composite showed a minimum reflection loss (RL) value of −6 dB in the Ku-band (12.4–18 GHz), and it did not meet the percolation limit (RL ≤ −10 dB). In order to enhance the microwave absorption and absorption bandwidth (RL ≤ −10 dB), numerous macroscopic designs, such as pyramidal and multi-layered pyramidal PC composite design were carried out for the same thickness. The optimized multi-layered pyramidal PC composite exhibited more effective absorption, and obtained a minimum RL value of −43 dB, having two specific absorption bandwidth in the frequency range of 8.2–18 GHz (both X-band and Ku-band). Mechanistically, the edge scattering and combined one-fourth resonances as well as high dielectric loss, which led to more storage of electromagnetic energy, were the major contribution factors. Further electromagnetic power loss was more prominent in the multi-layered pyramidal PC composite due to inhomogeneous energy losses. The simulated results were compared to the experimental data and showed the suitability of this composite for real time applications, particularly for defence. This study also indicates that low dielectric composites can be used for real time microwave absorption through different macroscopic designs.
Introduction
In recent times, military uses modern warship/unmanned air vehicles for defence, which have advanced electronic systems.1,2 In general, all advanced electronic systems are mounted on a large metal superstructure consisting of navigational and target-acquisition radar. However, this arrangement can create major problems, such as false images from self-reflections, indirect radar return, loss of radar energy, and system-to-system interference, due to electromagnetic interference (EMI).3,4 In order to avoid these problems, the need of tuned-frequency elastomeric absorbers is increasingly felt. The conventional radar absorption materials are mainly ferrite-based,5 carbon-based,6 graphene/CNT-based,7,8 conducting polymer- and hollow microsphere-based.9–12 However, recent advances in the fabrication technology of carbonaceous composites for microwave absorption, particularly in the X-band (8.2–12.4 GHz) and Ku-band (12.4–18 GHz), have demonstrated the use of biomass as a filler or coating. Studies regarding the fabrication of inexpensive and lightweight microwave absorbers using organic wastes, biomass and porous carbon materials from biomass waste have appealed the scientific community owing to their rich material sources, simple preparation process and environmental friendliness.13–15 Cow dung is such an environmentally friendly biomass and well-known manure. Recently, cow dung has been used for numerous electronic applications, such as electrodes for biochemical sensors and fuel cells.16 However, reports on cow dung for EM applications are limited. The key interest on cow dung for radar absorption is that it is a naturally abundant porous-carbonized lightweight dielectric material (density of dried cow dung lies in the range of 1–1.5 g cm−3). In addition, cow dung contains mainly cellulose, and therefore, it can be carbonized easily. Numerous porous-carbonized materials, such as spinach, cabbage, have been studied for microwave absorption.14 However, to the best of our knowledge, cow dung-loaded flexible elastomers for broad band microwave absorption were not explored.
The real challenge is to achieve a radar absorption bandwidth (reflection loss (RL) ≤ −10 dB, corresponds to 90% absorption) for a single layer. To overcome this, the multilayer structure is promising due to multiple resonances.17 To the best of our knowledge, studies on cow dung-containing flexible elastomers and their macroscopic design for electromagnetic wave absorption are very limited. In this study, dried powdered cow dung was used as a filler material in polydimethyl siloxane (PDMS) to fabricate a radar absorbing elastomer, and numerous structures for tuning the absorption bandwidth were designed. The objective of this study is the investigation of the microwave absorption characteristics of biologically sourced carbonaceous wastes, such as reduced cow dung (low dielectrics)-loaded polymer (PDMS) composites at a macroscopic scale (mm size).
Experimental
Composite preparation
Wet cow dung was collected from a local dairy farm, and dried completely under sunlight (8 h), and further dried at 200 ± 2 °C for 2 h. After that, it was crushed into a fine powder. This powder was added very slowly to PDMS (Sylgrad 250, Germany) under mechanical stirring and stirred for another 10 min. Finally, it was poured into an X-band and Ku-band sample holder and kept for drying at 60 ± 2 °C for 6 h. Numerous weight percentages, viz., 15%, 50% and 80% were added, and the composites were respectively named as PC1, PC2 and PC3.
The multi-layered pyramidal sample was also fabricated via the same procedure used for fabricating the PC3 composite. First, unit cells were fabricated, as shown in Scheme 1. The specific PET mould sizes (unit cell), as mentioned in the discussion part (based on simulation), were started with 10 mm × 10 mm × 1 mm and gradually decreased by length and width, viz., 9 mm × 9 mm × 1 mm and so on. Once the unit cells were fabricated, six-unit cells were pasted without any gap on an aluminium tape (conductor), and the measurement sample effective area was covered by four such rows.
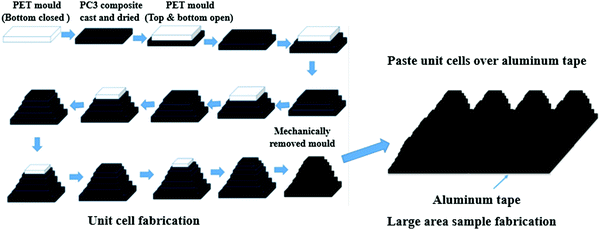 |
| | Scheme 1 Schematic representation of the multi-layered pyramidal PC3 composite sample preparation. | |
Characterization
The surface morphology of the PC composites was carried out using a field emission scanning electron microscope (FESEM, Carl Zeiss). The dielectric properties of both the PDMS and PC composites were measured in the X-band (8.2–12.4 GHz) and Ku-band (12.4–18 GHz) using an Agilent vector network analyser (Agilent N5201). The thru-reflect-line (TRL) calibration was the standard calibration method (also industrial standard) to obtain the complex S-parameters (S11, S12, S21, and S22).12 A complete two port TRL calibration was performed in both bands before commencement of the measurements. Using the obtained S-parameters, relative permittivity (εr = ε − iε′′) values were determined using the standard Nicholsion–Ross–Weir (NRW) method.12 The RL of a perfect electric conductor (PEC) backed material is given by1–12| |  | (1) |
Zin is the input impedance, and can be written as| |  | (2) |
Z0 is the characteristic impedance of free space (377 Ω), d is the thickness of the absorber and c is the velocity of light. εr and μr are the relative permittivity (εr = ε′ − iε′′) and permeability (μr = μ′ − iμ′′), respectively.
Macroscopic pattern designs and simulations
Artificial pattern designs of the composites and RL simulations were carried out using the CST microwave studio (2015). It is one of the most powerful electromagnetic computational tools, and it solves Maxwell equations by resorting to the finite integration technique (FIT) in time domain and to a finite element method (FEM) in the frequency domain. In the designed structure, the unit cell with the PEC substrate was constructed with the same area (10 mm × 10 mm) in a periodic array. The boundary conditions, viz., electric and magnetic, were applied at the X- and Y-direction, respectively, so that microwave propagated along the Z-axis.
Results and discussion
Recorded FESEM images of the sunlight-dried and thermally reduced (200 ± 2 °C) cow dung are shown in Fig. 1(a) and (b), respectively. The reduced cow dung was observed to be irregular porous in nature. Because of the irregular shape and porous nature, it could easily create a linkage in the polymer matrix, and a better heterogeneous composite system could be expected as compared to the non-reduced cow dung. In our experiment, thermally reduced cow dung was used for composite preparation (PC). The recorded EDX spectra of the reduced cow dung is shown in Fig. 1(c). The presence of C, O, Na, K and Ca in the reduced cow dung was confirmed via EDX. The EDX data also suggested that the presence of O (∼50 weight%) was maximum in the reduced cow dung (Fig. 1(c)). It is believed to be due to the porous nature of the reduced cow dung, where oxygens are trapped. C was found to be the second highest element (∼30 weight%) in the reduced cow dung.
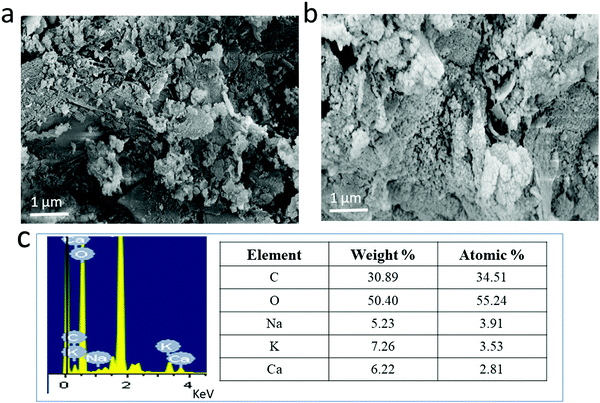 |
| | Fig. 1 SEM images of (a) sunlight-dried cow dung and (b) thermally reduced cow dung and (c) EDX spectra and results of the reduced cow dung. | |
As shown in Fig. 2(a), the reduced cow dung has a porous structure with a pore size ranging from 2 to 50 nm. The nanoporous reduced cow dung was further explored by N2 adsorption/desorption experiments performed at 77 K. Fig. 2(b) shows the isotherm curve (adsorption–desorption hysteresis loop), indicating a rapid N2 uptake at a very low-pressure region (P/P0 < 0.8), followed by a continuous increase in the rest of the P/P0 range. The large nanopore volume and high specific surface area of reduced cow dung were obtained to be 0.1941 cm3 g−1 and ∼103 m2 g−1, respectively.
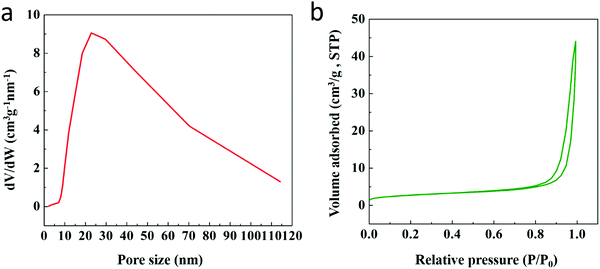 |
| | Fig. 2 (a) Pore size distributions and (b) nitrogen adsorption–desorption isotherm of the reduced cow dung. | |
The recorded FTIR spectra of PDMS and PC3 composites are shown in Fig. 3. The peaks observed at 2962 cm−1 and 1259 cm−1 correspond to C–H stretching in CH3 and CH3 symmetric bending in Si–CH3, respectively. The bands located at 1076 cm−1 and 1018 cm−1 correspond to Si–O–Si stretching, and at 798 cm−1 corresponds to the CH3 rocking in Si–CH3. In PC3 composites, no shifting of these peaks (bands) was found, indicating that there is no primary chemical interaction in between PDMS and the reduced cow dung.
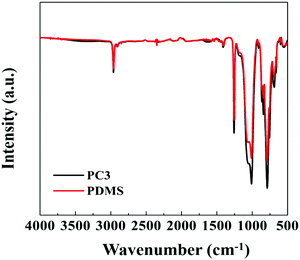 |
| | Fig. 3 Recorded FTIR spectra of PDMS and PC3 composites. | |
Fig. 4 shows the recorded relative permittivity of all the composites in the frequency range of 8.2–18 GHz. The obtained real permittivity (ε′) and imaginary permittivity (ε′′) values of PDMS are 2.33 and ∼0.07, respectively. It was observed that, for PC1, ε′ ranged from 2.5 to 2.67 across the frequency range of 8.2–18 GHz, and resonant peaks are observed from 15.5 GHz to 16.7 GHz. The ε′′ values ranged from 0.08 to 0.15 with numerous resonant peaks throughout the frequency range, indicating an increased dielectric loss (Fig. 4(a)). With the increase in the cow dung concentration, both ε′ and ε′′ enhanced and became more dependent on the frequency. For PC2, the values of ε′ ranged from 2.64 to 3.02 with several resonant peaks in the frequency range, particularly in the Ku-band. The ε′′ values for PC2 varied from 0.1 to 0.18, exhibiting the same trend as PC1 in terms of resonant peaks. With further increase in the filler concentration, for PC3, ε′ continued to increase, and reached a maximum of 3.16 at 12.6 GHz. A similar trend is also observed for ε′′, and the values varied from 0.18 to 0.24 (Fig. 4(b)). The ε′ value indicates the storage ability of the electric energy, and the ε′′ value indicates the dissipation of the electric energy through the composite material. When dried cow dung was added as a filler, heterogeneity was introduced in the composite, which in turn increased the interfacial polarization, thus increasing the values of ε′ and ε′′ with an increase in the amount of the fillers. The observed several resonant peaks in ε′ and ε′′ could be understood from the resonance-type dielectric response, due to the inertial effects, which dominate the charge movement. Alternatively, unlike the Debye-type behaviour or the relaxation-type dielectric behaviour in PC composites, resonance-type dielectric responses are observed.2,3 It could be due to the nanopores in the reduced cow dung as PC composites are inhomogeneous medium, similar to the Maxwel–Wagner type layer. In case of Maxwell–Wagner type microwave dielectrics (where effective permittivity plays the vital role), microwave absorption takes place due to better impedance matching.7–9 Thus, in PC composites, impedance matching could be an important factor for microwave absorption.
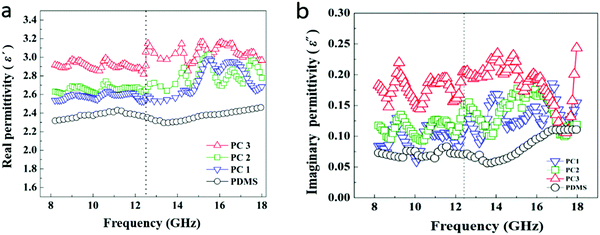 |
| | Fig. 4 Variation of recorded (a) real (ε′) and (b) imaginary (ε′′) parts of the permittivity of PC3, PC2, PC1 and PDMS in the frequency range (8.2–18 GHz). | |
RL of single layer PDMS-cow dung composites
The schematic of the single-layer radar absorber design is shown in Fig. 5(a). The cross-sectional surface morphology of the PC3 composite is shown in Fig. 5(b). It indicated that the reduced cow dungs particles were embedded in PDMS. The thickness-dependent simulated RL (dB) of PDMS and PDMS-cow dung composites (PC1, PC2 and PC3) are shown in Fig. 6. The simulated minimum RL values of single layer PC1, PC2 and PC3 were found to be −2, −2.5 and −4 dB, respectively. It was also observed that although the variation of the PC3 composite was promising, the potential minimum RL value (−10 dB, corresponds to 90% absorption) was not achieved until the thickness was increased to 8 mm. However, a noticeable change in the RL values of experimental and simulated results was observed. The comparison of experimental and simulated RL of the PC3 composite (3 mm) is shown in Fig. 6(d). The power absorbed (%) by PDMS, PC1, PC2 and PC3 composites for different thicknesses was investigated through the standard electromagnetic (EM) simulation and are shown in Fig. 7(a–d), respectively. The PC3 composite was found to have the highest power absorption capability (∼60%), whereas the PDMS matrix could absorb ∼10% until the thickness of 4 mm.
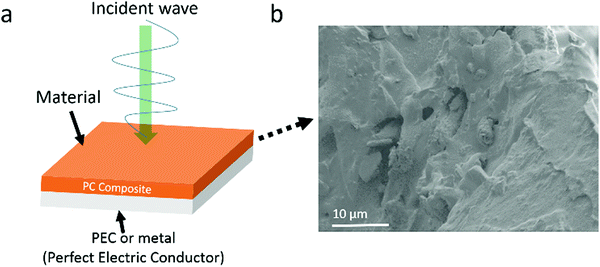 |
| | Fig. 5 (a) Schematic of the radar absorbing composite structure and (b) cross-sectional surface morphology of the PC3 composite. | |
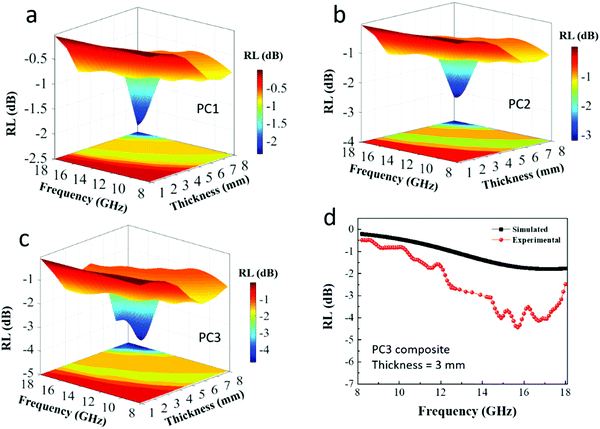 |
| | Fig. 6 Simulated reflection loss (RL) of (a) PC1, (b) PC2, (c) PC3. (d) Comparison of the simulated and experimental RL of the PC3 composite in the frequency range of 8.2–18 GHz. | |
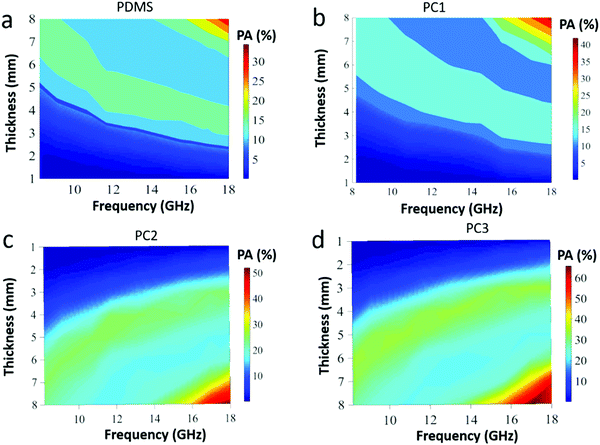 |
| | Fig. 7 Simulated power absorbed (%) by (a) PDMS, (b) PC1, (b) PC2 and (d) PC3 composites. | |
The minimum RL value of single-layer PC3 composites and better microwave power acceptance capability are due to the intrinsic loss of electromagnetic energy.18–20 It can be understood through the dielectric loss tangent (DLT, mathematically DLT = ε′′/ε′) and EM attenuation constant value.20,21 The DLT of a material denotes the dissipation of the electrical energy due to different physical processes, such as electrical conduction, dielectric relaxation, dielectric resonance and loss from non-linear processes.22–24 For the PDMS composite, it was observed the DLT values ranged from 0.03 to 0.04 with peaks in the low frequency region (Fig. 8(a)). With the addition of cow dung in PDMS, the DLT values increased. For PC1, DLT ranged from 0.033 to 0.051 with resonant peaks throughout the frequency range. The DLT value further increased for PC2, varying from 0.044 to 0.057. Finally, for PC3, which had the maximum filler concentration, DLT ranged from 0.063 to 0.075, and multiple peaks were observed in the frequency range of 8.2–18 GHz.
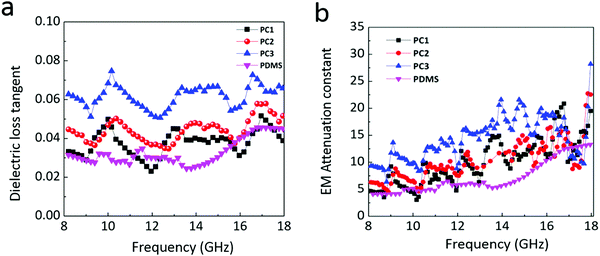 |
| | Fig. 8 (a) Dielectric loss tangent (DLT) and (b) EM attenuation constant (α) of PDMS, PC1, PC2 and PC3 composites in the frequency range of 8–18 GHz. | |
The EM attenuation constant (α) can be expressed as22
| |  | (3) |
Fig. 8(b) shows the variation of α values of PDMS, PC1, PC2 and PC3 composites. The α value was found to increase with frequency. Within the frequency range of 8.2–18 GHz, the α values of the PDMS composite, PC1, PC2 and PC3 were found to be ranging from 4–13.2, 4.7–19.4, 6–22.5 and 9.34–37.9, respectively. Thus, it signified the high EM energy loss in the PC3 composite during the propagation of the electromagnetic wave.
Conductivity (σ) of the PC composites could be calculated via the expression σ = ω(ε0ε′′), where ω is the angular frequency.6 The calculated σ values are shown in Fig. 9. Similar to the α value, the conductivity of the PC composite was positively correlated with the incident electromagnetic wave (EMW). PC3 composites possessed the highest σ value (0.19 S m−1). From the variation of α and σ values, the electromagnetic response in PC composites can also be understood as the dielectric nature of the composite, as induced by the conductivity induced electromagnetic interaction. Furthermore, its frequency domain also depended on the reduced cow dung loading in PDMS. The strong microwave absorption or RL value of the PC3 composite can also be understood from the electromagnetic energy conversion power due to the charge transport (Pc) and the dielectric relaxation (Pc). If  is the contributor of the charge transport to ε′′ and
  is the contributor of relaxation to ε′′, then Pc and Pp can be expressed as25,26
| |  | (4) |
| |  | (5) |
where,
E0 is the electric field intensity amplitude of EMW. The value of

intrinsically depends on
σ. Since the
σ value was predominant in the PC3 composite and contribution of

was minor, the expected
Pc therefore was higher than
Pp. Alternatively, the PC3 composite had a high electromagnetic power conversion density due to the charge transport, resulting in a better RL value.
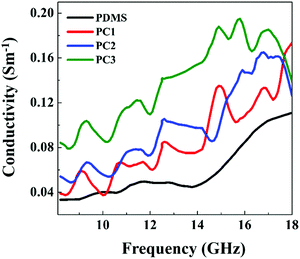 |
| | Fig. 9 Variation of conductivity (σ, Sm-1) of PC composites. | |
Tuning of RL of the PC3 composite through the macroscopic design
The bulk material microwave absorption properties could be tuned through the macroscopic pattern design. The classical pyramidal structure of dielectric materials is well known for microwave absorption due to the intrinsic power flow properties from top to bottom. Herein, a classical pyramidal structure was designed in mm (height 8 mm) for the PC3 composite, as shown in Fig. 10(a and b). The width of the bottom of the unit cell was set as a variable parameter “a”, and the height of the pyramid was fixed (8 mm). The electromagnetic parameters of the PC3 composite were employed in order to carry out the standard electrodynamic simulation in the CST-microwave studio. The value of “a” was varied from 13 to 25, and the resulted RL values are shown in Fig. 10(c and d). It was observed that the RL values of PC3 were very promising for all the designs, and the minimum RL value reached −43 dB for a = 23. From Fig. 10(c and d), the optimized “a” values could be taken as 13, 20, and 23. Fig. 11 shows the power accepted by the designed structure (Fig. 11(a)) of PC3 (Fig. 11(b)) and PDMS (Fig. 11(c)). From Fig. 11(b and c), it can be understood that power accepted by the PC3 meta structure was predominant for all “a” values. The power loss distribution occurred predominantly through the edges of the designed structure due to which a noticeable enhancement in RL was observed.17 Further modifications in the structural design can be carried out based on that, viz., if the more edges as well as multiple scattering sites are introduced, expecting the power loss distribution will be more, and more effective RL can be expected.
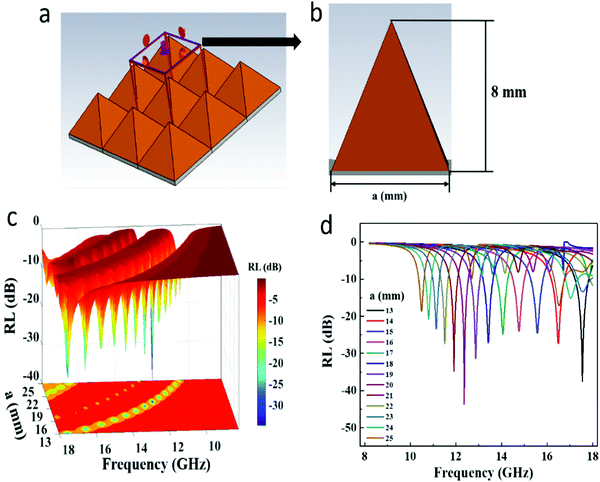 |
| | Fig. 10 (a and b) Schematic of the designed pyramidal structure, (c and d) simulated RL of the PC3 composite in the frequency range of 8.2–18 GHz. | |
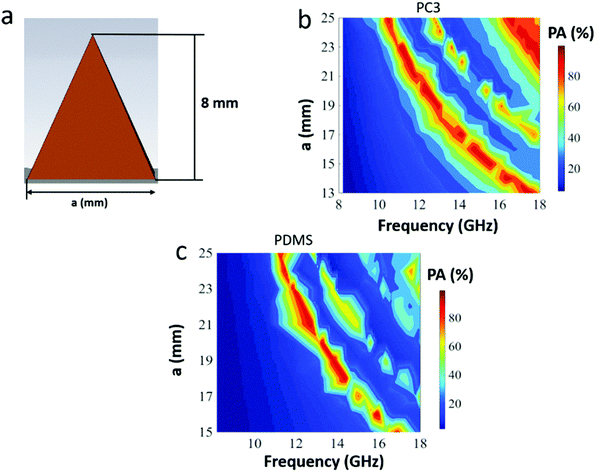 |
| | Fig. 11 (a) Schematic and (b) simulated power absorbed (%) by the PC3 composite and (c) PDMS. | |
Tuning of RL of the PC3 composite through the multi-layered meta-structure
In order to tune the minimum RL value and absorption bandwidth, another multi-layer meta-structure design of the PC3 composite was also carried out. As shown in Fig. 12(a and b), the thickness (8 mm) was divided into multilayers (8 layers), having a thickness of 1 mm each. The magnified parameter “m” was assigned to tune the unit cell size in the artificial array. The RL value of the PC3 composite is shown in Fig. 12(c and d), respectively for the different “m” values. Clearly, two distinct and very promising RL value peaks were observed for all “m” values (1.4, 1.6, 1.8. 2, 2.2, 2.4, 2.6 and 2.8) in both X-band and Ku-band. The minimum RL values of −37 dB and −30 dB were achieved for X-band and Ku-band, respectively, for m = 2 mm, indicating a more than 99.99% absorption. The simulated power accepted by the PC3 composite for different “m” values is shown in Fig. 13(a and b). The power acceptance capability of the designed multi-layered meta-structure of the PC3 composite was intrinsically dominant in both the X-band and Ku-band, respectively, and also indicated the validation of the obtained RL trend.
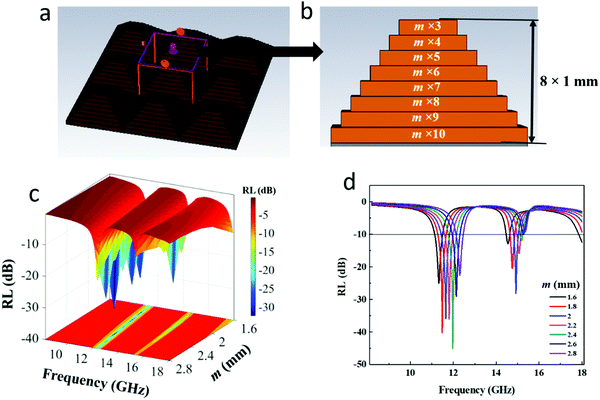 |
| | Fig. 12 (a and b) Schematic and (c and d) simulated RL of the designed artifacil multi-layerd PC3 composite array in the frequency range 8.2–18 GHz. | |
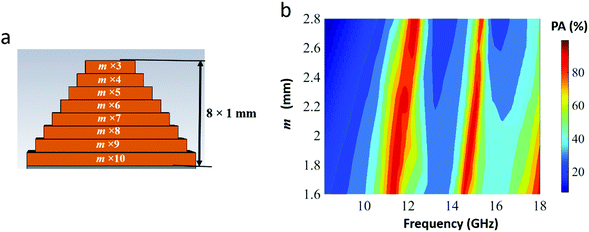 |
| | Fig. 13 (a) Schematic, (b) simulated power absorbed (%) by the PC3 composite for various “m” values. | |
Mechanism
In the three types of the designed PC3 composites, viz., the traditional uniform single bulk layer, pyramid unit cell array, and multi-layer pyramid unit cell array, each pattern was observed to possess specific radar absorption performances. This was because each pattern had a unique absorption mechanism. The schematic of the absorption mechanism is shown in Fig. 14(a). The single-layer bulk PC3 composite could generate quarter wavelength resonance depending on the absorber thickness, and due to that, for smaller thicknesses, effective absorption took place in the high-frequency region.1,17 In case of the pyramidal meta structure, the millimetre-range pyramid interfaces played the key role, and the impedance matching at the top was maximized, and gradually decreased, and a maximum power loss was at the edges.17 The power loss distribution of the multi-layered pyramidal PC3 composite is shown in Fig. 14(b). As shown in Fig. 14(a), in the case of the multilayer pyramidal structure, the synergistic effect of thicknesses, internal multiple reflections, corner scattering and different mode of resonances favoured the effective absorption of the PC3 composite at X-band and Ku-band.
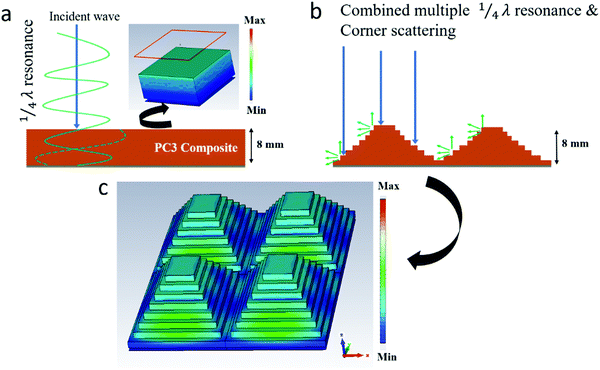 |
| | Fig. 14 (a and b) Schematic of the radar absorption mechanism of the bulk single layer and multi-layered artificial pattern, and (c) power loss distribution of the multi-layered PC3 composite (at 12 GHz). | |
In order to validate the simulated results, we have fabricated the optimized multi-layered pyramidal meta structure of the PC3 composite through solution processing. Fig. 15 shows the comparison of the experimental RL and simulated RL results (optimized multi-layered pyramidal meta structure, m = 2). The trend of both the experimental and simulated RL matches well, indicating that the multi-layered pyramidal structural design of PC3 is effective in enhancing the RL (≤−10 dB) bandwidth. The experimental RL shows two distinct bandwidths (RL ≤ −10 dB), viz., 10–13 GHz (minimum RL −42 dB) and 14–16 GHz, whereas the single layer PC3 composite had a minimum RL of −6 dB. The observed deviation of RL peaks in the simulated and experimentally recorded curves of the optimized PC3 composite is believed to be due to numerous factors, viz., (i) raw data fitting error, (ii) structural error and (iii) random power absorption density. In the electrodynamic simulation (CST-microwave studio), the input electromagnetic parameters, by default, it took linearly. However, we have seen a noticeable variation of (ε′) and imaginary (ε′′) in Fig. 4. Therefore, a significant difference in the RL values of simulated and experimental data could be expected. The error due to structural fabrication is also considered here as it was fabricated using a facile molded solution casting. In actual practice, a very high microwave power absorption density can be expected in the multi-layered PC3 pyramidal structure. This was because Q (W m−3) depends on the phase constant (β), and it can be expressed as,27
| |  | (6) |
Here,
ω is the angular frequency,
E0 is the amplitude of the electric field strength,
T and
R are the transmission and reflection coefficients, respectively. In case of the multi-layered PC3 pyramidal structure, due to many corner scatterings, the random power absorption density was prominent, particularly at the edges, resulting in better microwave absorption characteristics. Thus, because of these factors, a noticeable difference in simulated and experimental RL results was found. The above discussion also indicated that the variation of simulated and experimental RL was obvious in the composite-based multi-layered pyramidal macroscopic design; however, experimental RL values were more promising.
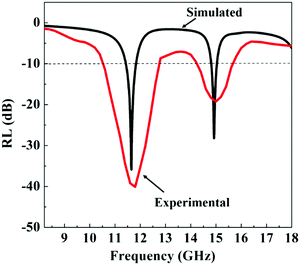 |
| | Fig. 15 The comparison of simulated and experimental RL values of the PC3 composite (multi-layered pyramidal pattern, m = 2). | |
Conclusion
A PDMS-cow dung (PC) composite as a superior radar absorber was investigated for X-band and Ku-band. Leveraging the macroscopic pattern comprising of a pyramidal meta-structure design on the PC3 composite, dual band absorption performance was observed in case of the multi-layered pyramidal structure. The tunability of absorption of the PC3 composite up to 99.99% could be achieved with the multi-layered pyramidal meta-structure. The obtained RL of different designs of PC composites were guided with mechanisms and explanations. Simulated results were compared with the experimental results, indicating suitability for real time applications.
Conflicts of interest
There are no conflicts to declare.
Acknowledgements
The authors would like to acknowledge the Government of India, Ministry of Defense Aeronautics Research & Development Board (ARDB/01/2031900/M/I) for the financial support of this work, and Prof. K. J. Vinoy, Department of ECE, Indian Institute of Science (IISc) for providing the VNA facility. PJB would like to dedicate this article to his father Mr. Jogeswar Bora.
References
- W. Liu, L. Liu, G. Ji, D. Li, Y. Zhang, J. Ma and Y. Du, Composition Design and Structural Characterization of MOF-Derived Composites with Controllable Electromagnetic Properties, ACS Sustainable Chem. Eng., 2017, 5(9), 7961–7971, DOI:10.1021/acssuschemeng.7b01514.
- P. J. Bora, K. J. Vinoy, P. C. Ramamurthy, Kishore and G. Madras, Lightweight Polyaniline-Cobalt Coated Fly Ash Cenosphere Composite Film For Electromagnetic Interference Shielding, Electron. Mater. Lett., 2016, 12(5), 603–609 CrossRef CAS.
- Y. Cheng, J. Cao, Y. Li, Z. Li, H. Zhao, G. Ji and Y. Du, The Outside-In Approach To Construct Fe3O4 Nanocrystals/Mesoporous Carbon Hollow Spheres Core–Shell Hybrids toward Microwave Absorption, ACS Sustainable Chem. Eng., 2018, 6(1), 1427–1435, DOI:10.1021/acssuschemeng.7b03846.
- H. Zhao, Z. Zhu, C. Xiong, X. Zheng and Q. Lin, The Influence of Different Ni Contents On The Radar Absorbing Properties Of Feni Nano Powders, RSC Adv., 2016, 6, 16413–16418 RSC.
- B. W. Li, Y. Shen, Z. X. Yue and C. W. Nan, Enhanced Microwave Absorption In Nickel/Hexagonal-Ferrite/Polymer Composites, Appl. Phys. Lett., 2016, 89, 132504 CrossRef.
- F. Qin and C. Brosseau, A review and analysis of microwave absorption in polymer composites filled with carbonaceous particles, J. Appl. Phys., 2012, 111, 061301, DOI:10.1063/1.3688435.
- F. Meng, H. Wang, H. Huang, Y. Guo, Z. Wang, D. Hui and Z. Zhou, Graphene-based microwave absorbing composites: A review and prospective, Composites, Part B, 2018, 137, 260–277, DOI:10.1016/j.compositesb.2017.11.023.
- H. Sun, R. Che, X. You, Y. Jiang, Z. Yang, J. Deng, L. Qiu and H. Peng, Cross-Stacking Aligned Carbon-Nanotube Films to Tune Microwave Absorption Frequencies and Increase Absorption Intensities, Adv. Mater., 2014, 23, 8120–8125, DOI:10.1002/adma.201403735.
- P. J. Bora, I. Azeem, K. J. Vinoy, P. C. Ramamurthy and G. Madras, Polyvinylbutyral–Polyaniline Nanocomposite for High Microwave Absorption Efficiency, ACS Omega, 2018, 3(12), 16542–16548 CrossRef CAS PubMed.
- P. J. Bora, M. Porwal, K. J. Vinoy, Kishore, P. C. Ramamurthy and G. Madras, Industrial waste fly ash cenosphere composites based broad band microwave absorber, Composites, Part B, 2018, 134, 151–163 CrossRef CAS.
- P. J. Bora, N. Mallik, P. C. Ramamurthy, Kishore and G. Madras, Poly(vinyl butyral) -polyaniline-magnetically functionalized fly ash cenosphere composite film for electromagnetic interference shielding, Composites, Part B, 2016, 106, 224–233 CrossRef CAS.
- P. J. Bora, N. Mallik, P. C. Ramamurthy, Kishore and G. Madras, Poly(vinyl butyral) -polyaniline-magnetically functionalized fly ash cenosphere composite film for electromagnetic interference shielding, Composites, Part B, 2016, 106, 224–233 CrossRef CAS.
- Y. Wang, X. Gao, H. Zhou, X. Wu, W. Zhang, Q. Wang and C. Luo, Fabrication of biomass-derived carbon decorated with NiFe2O4 particles for broadband and strong microwave absorption, Powder Technol., 2019, 345, 370–378 CrossRef CAS.
- Z. Wu, K. Tian, T. Huang, W. Hu, F. Xie, J. Wang, M. Su and L. Li, Hierarchically Porous Carbons Derived from Biomasses with Excellent Microwave Absorption Performance, ACS Appl. Mater. Interfaces, 2018, 10, 11108–11115 CrossRef CAS PubMed.
- X. Qiu, L. Wang, H. Zhu, Y. Guan and Q. Zhang, Lightweight and efficient microwave absorbing materials based on walnut shell-derived nano-porous carbon, Nanoscale, 2017, 9, 7408–7418 RSC.
-
V. Jayaprakash; R. D. Sochol; R. Warren; A. Kozinda; K. Iwai and L. Lin, Stackable cow dung based microfabricated microbial fuel cells Proceedings of the IEEE International Conference on Micro Electro Mechanical Systems (MEMS), 2013.
- P. Liu, L. Li, L. Wang, T. Huang, Q. L. Zhao, K. L. Zhang, X. M. Bian and Z. L. Hou, Broadening Electromagnetic Absorption Bandwidth: Design from Microscopic Dielectric-Magnetic Coupled Absorbers to Macroscopic Patterns, Phys. Status Solidi A, 2017, 214, 1700589, DOI:10.1002/pssa.201700589.
- P. J. Bora, S. M. Harstad, S. Gupta, V. K. Pecharsky, K. J. Vinoy, P. C. Ramamurthy and R. L. Hadimani, Gadolinium Silicide (Gd5Si4) Nanoparticles for Tuneable Broad Band Microwave Absorption, Mater. Res. Express, 2019, 6, 055053, DOI:10.1088/2053-1591/aafd55.
- B. Zhao, G. Shao, B. Fan, W. Zhao, Y. Xie and R. Zhang, Synthesis of Flower-like CuS Hollow Microspheres Based on Nanoflakes Self-Assembly and Their Microwave Absorption Properties, J. Mater. Chem. A, 2015, 3, 10345–10352, 10.1039/c5ta00086f.
- B. Zhao, X. Guo, Y. Zhou, T. Su, C. Ma and R. Zhang, Constructing Hierarchical Hollow CuS Microspheres: Via a Galvanic Replacement Reaction and Their Use as Wide-Band Microwave Absorbers, CrystEngComm, 2017, 19, 2178–2186, 10.1039/c7ce00235a.
-
P. J. Bora, I. Azeem, K. J. Vinoy, P. C. Ramamurthy and G. Madras, Microwave Absorption Property of PVB-Polyaniline Nanocomposite. In Asia-Pacific Microwave Conference Proceedings, APMC, 2017, DOI: 10.1109/APMC.2017.8251536.
- B. Zhao, X. Guo, W. Zhao, J. Deng, G. Shao, B. Fan, Z. Bai and R. Zhang, Yolk-Shell Ni@SnO2 Composites with a Designable Interspace to Improve the Electromagnetic Wave Absorption Properties, ACS Appl. Mater. Interfaces, 2016, 8(42), 28917–28925, DOI:10.1021/acsami.6b10886.
- B. Zhao, J. Deng, L. Liang, C. Zuo, Z. Bai, X. Guo and R. Zhang, Lightweight Porous Co3O4 and Co/CoO Nanofibers with Tunable Impedance Match and Configuration-Dependent Microwave Absorption Properties, CrystEngComm, 2017, 19, 6095–6106, 10.1039/c7ce01464c.
- B. Zhao, J. Liu, X. Guo, W. Zhao, L. Liang, C. Ma and R. Zhang, Hierarchical Porous Ni@boehmite/Nickel Aluminum Oxide Flakes with Enhanced Microwave Absorption Ability, Phys. Chem. Chem. Phys., 2017, 19, 9128–9136 RSC.
- M. Cao, X. Wang, W. Cao, X. Fang, B. Wen and J. Yuan, Small, 2018, 14, 1800987 CrossRef PubMed.
- J. Dalal, S. Lather, A. Gupta, R. Tripathi, A. S. Maan, K. Singh and A. Ohlan, Adv. Mater. Technol., 2019, 4, 1900023 CrossRef CAS.
- Z. Peng, J. Y. Hwang and M. Andriese, IEEE Trans. Magn., 2013, 49, 1163–1166 CAS.
|
| This journal is © The Royal Society of Chemistry 2021 |
Click here to see how this site uses Cookies. View our privacy policy here.  Open Access Article
 *ab,
Meghana Jois
H. S.
b,
T. R. Suresh
Kumar
c,
Sutripto
Khasnabis
b and
Praveen C.
Ramamurthy
*ab


 is the contributor of the charge transport to ε′′ and
  is the contributor of relaxation to ε′′, then Pc and Pp can be expressed as25,26

 intrinsically depends on σ. Since the σ value was predominant in the PC3 composite and contribution of
  was minor, the expected Pc therefore was higher than Pp. Alternatively, the PC3 composite had a high electromagnetic power conversion density due to the charge transport, resulting in a better RL value.


