 Open Access Article
Elucidating zinc-ion battery mechanisms in freestanding carbon electrode architectures decorated with nanocrystalline ZnMn2O4†
Megan B.
Sassin
 *a,
Maya E.
Helms
a,
Joseph F.
Parker
 a,
Christopher N.
Chervin
 a,
Ryan H.
DeBlock
 a,
Jesse S.
Ko‡
 b,
Debra R.
Rolison
 a and
Jeffrey W.
Long
 *a
*a
aCode 6170, Surface Chemistry Branch, U.S. Naval Research Laboratory, Washington, DC 20375, USA. E-mail: megan.sassin@nrl.navy.mil
bFormer NRC Postdoctoral Associate at the U.S. Naval Research Laboratory, USA
First published on 26th March 2021
Abstract
Rechargeable zinc-ion batteries represent an emerging energy-storage technology that offers the advantages of low cost, use of abundant and nontoxic materials, and competitive energy content in lightly packaged forms. Nanoscale manganese oxides are among the most promising positive-electrode materials for zinc-ion cells, and their performance is further enhanced when these oxides are expressed as conformal deposits on porous carbon architectures, such as carbon nanfoam paper (CNF). We describe an “in-place” conversion of nanometric birnessite Na+-MnOx@CNF to crystalline spinel ZnMn2O4@CNF, a manganese oxide polymorph that nominally contains sites for Zn2+ insertion. The ZnMn2O4@CNF cathodes are electrochemically conditioned in two-terminal cells and ex situ characterized using X-ray diffraction, scanning electron microscopy, energy-dispersive spectroscopy, and X-ray photoelectron spectroscopy. Despite specific Zn2+ insertion sites in ZnMn2O4, we demonstrate that the predominant discharge mechanism involves coupled insertion of protons and precipitation of Zn4(OH)6SO4·xH2O; upon recharge, protons deinsert and Zn4(OH)6SO4 dissolves.
Introduction
Manganese oxides (MnOx) have a long history as charge-storing materials in devices ranging from primary alkaline Zn/MnO2 cells1 to rechargeable Li-ion batteries2 to aqueous-electrolyte electrochemical capacitors.3–6 Interest in these oxides is on the rise because of their prospective use as positive electrodes in rechargeable Zn-ion cells versus a Zn metal negative electrode in Zn2+-based aqueous electrolytes.7–15 This cell chemistry inherits the advantages of the ubiquitous alkaline Zn/MnO2 battery—low-cost, abundant components and the ability to deliver moderately high specific energy—but uses an even safer mild-pH electrolyte and is extensively rechargeable (hundreds of cycles). Other metal oxides,16–18 sulfides,19–21 and phosphates22–24 are also under investigation, but MnOx is the most likely to transition to commercial Zn-ion batteries because of its lower cost and favorable redox potential (discharge voltage on the order of 1.3 V vs. Zn/Zn2+).A key advancement toward rechargeable Zn-ion batteries was the recognition that nanostructured forms of MnOx undergo reversible redox reactions when electrochemically cycled in mild-pH aqueous electrolytes that contain Zn2+ salts (e.g., ZnSO4). Early reports suggested that insertion/intercalation of Zn2+ into MnOx, coupled with Mn3+/4+ redox,16–18 provides reversible cycling to relatively high MnOx-specific capacity (>200 mA h g−1). Other studies, however, show evidence for a multistep reaction with comparable specific capacity that involves proton insertion at MnOx; the coupled increase in local pH drives the precipitation of a hydrated Zn4(OH)6SO4 at the electrode surface.25–33 This complex discharge reaction can often be reversed by re-oxidizing MnOx, resulting in the release of protons and at least partial dissolution of the Zn4(OH)6SO4·xH2O precipitate. In reality, both mechanisms may be operative for a given MnOx material,34 particularly those that are disordered, nanoscale, and/or porous. Optimizing the performance of MnOx-based positive electrodes for Zn-ion batteries requires understanding the influences of MnOx polymorph and electrode structure on the charge-storage mechanism, which ultimately impacts rate capability, capacity, and cycle life.10
Recently, we explored the electrochemical Zn-ion behavior of birnessite-like Na+-compensated manganese oxide (Na+–MnOx) distributed as ultrathin (<20 nm-thick) coatings throughout porous carbon nanofoam papers (MnOx@CNF).35,36 These binder-free electrodes exhibit theoretical one-electron capacity (308 mA h gMnO2−1) at moderate rates (1C) in 1 M ZnSO4.35 When Na2SO4 is added to the electrolyte, high rate (20C) operation is enabled by pseudocapacitance mechanisms. Ex situ characterization after conditioning at pertinent cell voltages confirms that H+ insertion/de-insertion and subsequent Zn4(OH)6SO4·xH2O precipitation/dissolution is the dominant charge-storage mechanism for birnessite-like Na+-MnOx@CNF. The reversibility of these complex multiphase reactions depend on electrolyte composition and the pore structure of the CNF-based architecture.36
Herein, we investigate Zn-ion charge-storage mechanisms for another MnOx polymorph, spinel-type ZnMn2O4, which contains tetrahedral sites that nominally accommodate Zn2+ insertion for divalent charge storage.37–42 The disordered birnessite-like Na+-MnOx coatings on CNFs used in our previous study are readily converted to spinel ZnMn2O4via topotactic ion-exchange (Zn2+ for Na+), followed by mild thermal treatment. This transformation is achieved while maintaining the nanoscale, conformal nature of the as-deposited MnOx at the carbon surfaces and the through-connected pore structure of the CNF (Fig. S1, ESI†). We now have the opportunity to directly compare two distinct MnOx polymorphs (birnessite vs. spinel ZnMn2O4), but expressed in identical multifunctional electrode architectures.
We first examine key electrochemical properties of ZnMn2O4@CNFs in two-terminal cells with an aqueous Zn-ion electrolyte using cyclic voltammetry, AC electrochemical impedance, and galvanostatic charge–discharge for long-term cycling. Ex situ characterization via diffraction, microscopy, and spectroscopy of electrochemically conditioned ZnMn2O4@CNFs reveals that the dominant charge-storage mechanism is similar to that of Na+-MnOx@CNF, despite the presence of specific Zn2+ insertion sites in nanocrystalline ZnMn2O4 spinel. The charge-storage mechanism involves H+-insertion/de-insertion and subsequent precipitation/dissolution of Zn4(OH)6SO4·xH2O at the electrified interfaces.
Results and discussion
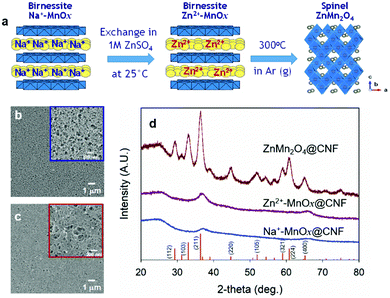
We previously demonstrated crystal engineering of disordered birnessite Na+-MnOx@CNF to crystalline spinel LiMn2O4@CNF;43–45 here we show that this approach can be generalized to produce the Zn2+-containing spinel analogue, ZnMn2O4@CNF (Fig. 1a). The first step of the process involves electroless redox deposition from aqueous permanganate to generate nanoscale Na+-MnOx coatings on the carbon surfaces throughout the CNF paper.46,47 The resulting Na+-MnOx@CNFs are soaked in 1 M ZnSO4 (aq) to exchange Na+ in the lamellar MnOx domains with Zn2+, then copiously rinsed and dried to obtain birnessite-like Zn2+-MnOx@CNFs. The nanoscale nature of the oxide coating facilitates crystallization at a relatively mild temperature (300 °C), which minimizes particle ripening of the MnOx coating (Fig. 1b and c), as previously observed with LiMn2O4@CNFs.43,44 The thermal processing step under flowing argon (low pO2) reduces Mn from its initial mixed-valent Mn oxidation state of +3.7 in birnessite Na+-MnOx@CNF43 to the expected +3 Mn oxidation state as verified by XPS (Fig. S1, ESI†).Tracking the progress of phase conversion from birnessite Na+-MnOx to spinel ZnMn2O4 with powder X-ray diffraction reveals that exchanging Na+ for Zn2+ does not significantly alter the XRD pattern; both Na+- and Zn2+-MnOx@CNF display two broad peaks at 37 and 66° 2θ, associated with the disordered birnessite MnOx phase (Fig. 1d). Following thermal treatment, the disordered lamellar MnOx phase transforms to crystalline spinel that indexes to tetragonal ZnMn2O4 (Fig. 1d). The average crystallite size is 8 nm, as calculated from whole-pattern fitting, confirming that the coating remains nanoscale during transformation from 2D lamellar to 3D spinel.
While no other crystalline phases are observed in the ZnMn2O4@CNF XRD pattern, the retention of some minor fraction of disordered MnOx cannot be precluded. Elemental analysis via inductively coupled plasma–atomic emission spectroscopy of ZnMn2O4@CNF yields a Mn:Zn ratio of 2.4, higher than the expected 2.0 for complete conversion. If we assume that all Zn in the sample exists as ZnMn2O4, 7.7% of the Mn remains unassociated with the ZnMn2O4 phase (Table S1 and eqn (S1), ESI†). Quantitative analysis of the XPS peaks for Mn 2p3/2, Zn 2p3/2, and oxide O 1s indicates a composition of ZnMn2.1O3.8, in relative agreement with the expected ZnMn2O4 stoichiometry (Table 1 and Fig. S1, ESI†). However, we note that pair-distribution function analysis of the in situ crystal engineering of our disordered Na+-MnOx@CNF to nanocrystalline LiMn2O4@CNF found that the first plane of MnOx, which forms when MnO4− oxidizes the carbon surface, retains a lamellar morphology that serves as the base of the 3D spinel phase. This foundational plane of MnOx accounts for the presence of a minor fraction of Mn remaining in a non-spinel form.44
| Echem cond. | Mn:Zna | S:Zna | Lattice parameterba|b|c | Unit cell vol.b | Zn4(OH)6SO4 precipitate observed? (Method) |
|---|---|---|---|---|---|
| a Determined via XPS. b Extracted from XRD. c Cell held at specified voltage for 30 min. | |||||
| Uncycled | 2.1 | — | 5.74|5.74|9.24 | 305 | No |
| OCV → 1.75 Vc | 1.8 | 0.04 | 5.74|5.74|9.23 | 304 | No |
| 1.75 Vc | 2.0 | 0.08 | 5.74|5.74|9.19 | 303 | No |
| 1.3 Vc | 0.9 | 0.1 | 5.75|5.75|9.21 | 305 | Nanoscale (?) (XPS, EDS) |
| 0.9 Vc | 0.07 | 0.3 | 5.77|.77|9.23 | 308 | Macroscale (XRD, SEM) |
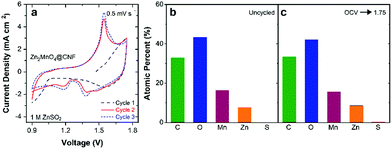
With confirmation of successful phase transformation to spinel, we evaluated the electrochemical performance of ZnMn2O4@CNF in two-electrode cells versus a Zn foil anode and using 1 M ZnSO4 (aq) electrolyte. Because as-synthesized ZnMn2O4@CNF is fully discharged with Mn in the +3 state, the electrochemical cells were first scanned to voltages positive of open circuit (∼1.5 V). Somewhat surprisingly, the first positive-going voltammetric scan shows no well-defined anodic peak (Fig. 2a), as would be nominally expected for oxidation of Mn3+ sites to Mn4+, accompanied by de-insertion of Zn2+ for charge balance.
To gain insight into this unexpected first-scan behaviour, we performed electrochemical impedance spectroscopy (EIS) of ZnMn2O4@CNF at 1.75 V (scanned directly from open circuit) followed by ex situ XPS, SEM/EDS, and XRD characterization of the conditioned electrode. The Nyquist plot reveals a high charge-transfer resistance (RCT) of 26 Ω cm2, indicative of significant impediment to multivalent ion extraction from the ZnMn2O4 domains (Fig. S2, ESI†).42 X-ray photoelectron spectroscopy and EDS corroborate this finding, as the Zn content after 1.75 V conditioning is qualitatively similar to the uncycled ZnMn2O4@CNF (Fig. 2b, c and Fig. S3, ESI†), revealing that minimal Zn2+ is removed from the spinel lattice during the initial charge. This finding is in agreement with that of Manthiram and co-workers, in which they revealed Zn2+ is not removed from ZnMn2O4 by NO2BF4, a chemical mimic for electrochemical Mn oxidation.48 Furthermore, no significant changes in lattice parameters or structure are detected by XRD between the initially charged 1.75 V sample and an uncycled ZnMn2O4@CNF (Table 1 and Fig. S4, ESI†).
The ill-defined first-scan voltammetry is consistent with other reports on the initial cycling behaviour of ZnMn2O4.28,38 The absence of Mn3+/4+ redox in the first positive scan is in contrast to our previous report with analogous LiMn2O4@CNF, where lattice-sited Li+ was easily removed upon initial electrochemical oxidation of the mixed-valent Mn3+/Mn4+ oxide.43 Unlike LiMn2O4@CNF, the voltammetric peaks of ZnMn2O4@CNF are not well-defined in the first cycle, with only a single reduction peak at ∼0.9 V observed. We attribute this reduction peak to H+ insertion, with the supply of protons arising from the mild acidity of Zn(H2O)62+ in the aqueous Zn-based electrolyte.60 The expected redox peaks become well-defined on the second and subsequent cycles, with a single anodic peak paired with two cathodic peaks (Fig. 2a). Such redox peaks are commonly attributed to extraction/insertion of Zn2+,38,49 but more recently co-insertion/extraction of H+ and Zn2+ into ZnMn2O4 has been proposed.28
To elucidate the specific ZnMn2O4@CNF charge-storage mechanism in aqueous Zn2+-containing electrolytes, we use a multi-pronged approach that includes EIS and ex situ characterization of cells conditioned at pertinent voltages. For data reported in the following sections, all ZnMn2O4@CNF-based cells are subjected to: (i) a 10-cycle voltammetric break-in; (ii) a linear scan to the voltage of interest (depicted in Fig. 3a); and (iii) potentiostating at that voltage either for 10 min prior to EIS data acquisition or for 30 min for ex situ characterization. Cells are quickly disassembled after voltage conditioning and the ZnMn2O4@CNF electrode is rinsed copiously with ultrapure water and dried at 50 °C under flowing N2(g).
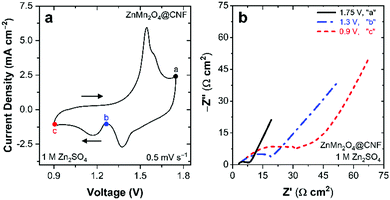 | ||
| Fig. 3 (a) Cyclic voltammogram showing voltages applied for EIS and subsequent ex situ characterization and (b) Nyquist plot at voltages specified in (a) in 1 M ZnSO4. | ||
Electrochemical impedance spectroscopy provides insights into the charge-storage mechanism when performed as a function of applied DC voltage. Nyquist plots from this series of cells reveal significant changes in RCT during charge (e.g., 1.75 V, “a” in Fig. 3a) and discharge (e.g., 1.3 V, “b”, and 0.9 V, “c”, in Fig. 3a). Upon charging at 1.75 V, the RCT is relatively low at 5 Ω cm2, compared to the 26 Ω cm2 measured after initial charging from open circuit (Fig. S2, ESI†), revealing that voltammetric break-in enhances performance. Discharging from 1.75 V to 1.3 V, increases the RCT 4× to 20 Ω cm2 with a further increase to 38 Ω cm2 after discharging at 0.9 V (Fig. 3b). We previously observed qualitatively similar results for Na+-MnOx@CNF conditioned in 1 M ZnSO4,36 where RCT increases significantly when fully discharged, arising from the precipitation of electronically insulating Zn4(OH)6SO4·xH2O at the electrode surface. For ZnMn2O4@CNF, the origin of the increase in RCT upon discharge is attributed to either Zn2+ transport hindrances and/or precipitation of passivating Zn4(OH)6SO4·xH2O.
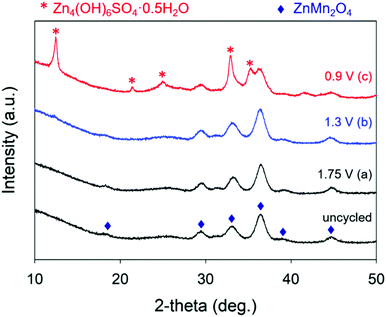
We use ex situ X-ray diffraction to monitor the expansion/contraction of the ZnMn2O4 lattice that would arise from Zn2+-insertion/extraction and the appearance of Zn4(OH)6(SO4)·xH2O.27,36,39,50 All ZnMn2O4@CNFs harvested from conditioned cells show the main XRD peaks for spinel ZnMn2O4, indicating that the core crystal structure remains intact through the charge–discharge process (Fig. 4). After charging at 1.75 V, the main ZnMn2O4 peaks at 29.3, 33.1, and 36.4° 2θ shift to slightly higher 2θ compared to the uncycled ZnMn2O4@CNF, concomitant with an increase in the a and b lattice parameters and a decrease in the c lattice parameter and unit cell volume (Table 1). Discharging at 1.3 V does not alter either the main peak positions or corresponding cell parameters (Table 1), revealing that it is unlikely that Zn2+ inserts into the lattice; higher resolution synchrotron experiments are planned in the future to verify this finding.
Upon complete discharge at 0.9 V, additional diffraction peaks appear that index to Zn4(OH)6(SO4)·xH2O. Because of the overlap of the XRD reflections for ZnMn2O4 and Zn4(OH)6SO4·xH2O, we are unable to confidently fit XRD data with respect to determining changes in lattice parameters of the ZnMn2O4 phase, precluding the determination of Zn2+ insertion into the lattice at 0.9 V (Table 1). The presence of Zn4(OH)6SO4·xH2O for cells discharged at 0.9 V is the likely origin of the significant increase in RCT (Fig. 3b).
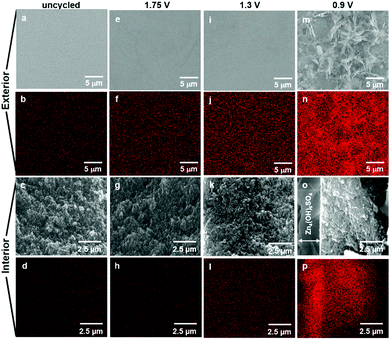
Ex situ SEM visualizes morphological changes in ZnMn2O4@CNF electrodes as a function of cell voltage. Energy-dispersive X-ray spectroscopy provides a means to elucidate the reaction mechanism by monitoring for the appearance of sulfur, as mapped onto the micrographs, in which sulfur serves as an elemental marker for Zn4(OH)6SO4·xH2O. Uncycled ZnMn2O4@CNF provides the baseline for both morphology and sulfur content.
The exterior surface of the uncycled ZnMn2O4@CNF is featureless at low magnification and as expected, only adventitious sulfur is detected (Fig. 5a and b). Higher magnification of the exterior surface reveals the through-connected pore structure (Fig. S5, ESI†), which is also visible in the cross-section (Fig. 5c); minimal sulfur is detected in the interior of the uncycled sample (Fig. 5d).
Charging at 1.75 V does not yield any significant changes in the morphology of the exterior or interior surfaces (Fig. 5e, g and Fig. S5, ESI†), but a slight increase in sulfur content is detected (Fig. 5f and h). Upon discharging at 1.3 V, minimal-to-no-change in morphology is observed on either the exterior or the interior surfaces (Fig. 5i, k and Fig. S5, ESI†); however, an increase in sulfur content is visible in the EDS maps (Fig. 5j and l).
A significant change in morphology is observed after discharging at 0.9 V, with large plate-like precipitates visible that extensively cover the exterior surface (Fig. 5m and Fig. S5, ESI†); some of these precipitates protrude into the underlying pore structure (Fig. S5, ESI†). The cross-sectional micrograph reveals that this layer lies on top of the electrode surface and is ∼3 μm thick (Fig. 5o). A significant increase in sulfur is detected on both exterior and interior surfaces (Fig. 5n and p), but with significantly more sulfur concentrated in the 3 μm-thick exterior layer (Fig. 5p).
The SEM, EDS, and XRD results for 0.9 V-conditioned ZnMn2O4@CNF substantiate that the micrographically observed exterior layer comprises Zn4(OH)6SO4·xH2O. In addition to confirming the presence of sulfur, the EDS spectra show an increase in Zn and decrease in Mn (Fig. S6, ESI†) and the XRD data (Fig. 4) corroborates the presence of crystalline Zn4(OH)6SO4·xH2O. A similar plate-like morphology was also visible on the exterior surface for fully discharged birnessite-type Na+-MnOx@CNF electrodes cycled in 1 M ZnSO4.36
The presence of sulfur throughout the interior of the 0.9 V-conditioned electrode (Fig. 5p) coupled with the observation that Zn4(OH)6SO4 crystallites are oriented orthogonally to the electrode surface, and do not completely occlude the underlying pore structure (Fig. S5, ESI†), reveals that a large fraction of the electrode volume remains accessible to the electrolyte and available to participate in the charge-storage reaction. The absence of visible Zn4(OH)6SO4·xH2O precipitates in the interior voids of the ZnMn2O4@CNF stems from the fact that there is only 10% of the required Zn2+ for the reaction inside these pores (eqn (S2), ESI†).36
Tracking the atomic ratios (Mn:Zn and S:Zn) by ex situ XPS provides further insight into the charge-storage mechanism. The Mn:Zn ratio of uncycled ZnMn2O4@CNF is 2.1 and after conditioning at 1.75 V decreases slightly to 2, revealing a general return to the starting state after voltammetric break-in and charging (Table 1 and Fig. 6a, b). A small amount of sulfur persists after charging at 1.75 V, detectable by both XPS (S:Zn ratio of 0.08) and EDS (Fig. 5f, h and Fig. S6, ESI†), which we attribute to a patchy <7 nm-thick Zn4(OH)6SO4·xH2O layer present at a level below the detection limit of XRD; this insulating coating could also be the source of the contrast differences observed in the corresponding micrograph (Fig. 5e). Discharging at 1.3 V decreases the Mn:Zn ratio to 0.9, concomitant with an increase in the S:Zn ratio to 0.10 (Table 1 and Fig. 6c). The binding energy of the S 2p3/2 peak is 168.8 eV, consistent with sulfate, indicating either that SO42− associates at edge sites or that nanoscale Zn4(OH)6SO4·xH2O is present below the detection limits of XRD. The Mn:Zn ratio decreases by over an order of magnitude to 0.07 upon discharge at 0.9 V (Table 1 and Fig. 6d), attributed to screening of the underlying ZnMn2O4 by the 3 μm-thick Zn4(OH)6(SO4)·xH2O overlayer (Fig. 5o). By measuring a Zn- and S-rich surface (S:Zn ratio = 0.3; Fig. 6d), the XPS data are consistent with the presence of Zn4(OH)6SO4·xH2O.
 | ||
| Fig. 6 Atomic percent of each element derived from ex situ XPS of ZnMn2O4@CNF electrodes as a function of voltage conditioning: (a) uncycled, (b) 1.75 V, (c) 1.3 V, and (d) 0.9 V in 1 M ZnSO4. | ||
Although ZnMn2O4 contains specific insertion sites for Zn2+, our data confirm that the dominant charge-storage mechanism for ZnMn2O4@CNF is H+ insertion/de-insertion with subsequent precipitation/dissolution of Zn4(OH)6(SO4)·xH2O, similar to that observed on our birnessite-like Na+-MnOx@CNF.36 This same reaction mechanism has been proposed for VO2,51,52 V3O7·H2O,53,54 V2O5,55 NaV3O8,56 V10O24·12H2O,57 and Co3O458 cathode materials, revealing that pH changes upon H+ insertion/de-insertion is a general charge-storage mechanism for oxide-based materials in aqueous ZnSO4 electrolytes, as recently suggested by Kundu and co-workers.53
Circumventing this general precipitation/dissolution process would be advantageous from a performance standpoint (e.g., long-term cycling and rate), but swapping NO3− for SO42− is not feasible, as the former is too oxidizing for the Zn anode. Buffering the SO42− electrolyte, however, may be an effective strategy to suppress the precipitation of the Zn4(OH)6SO4·xH2O salt and is the focus of future experiments.
A charge-storage mechanism that involves precipitation/dissolution of Zn4(OH)6(SO4)·xH2O on the surface of the ZnMn2O4@CNF electrode influences both the capacity and rate of Zn-ion cells; and as such, 3D electrode–architecture designs play a role in energy-storage performance. Cyclic voltammometric examination of ZnMn2O4@CNF as a function of scan rate reveals that ZnMn2O4-based redox peaks are discernible at scan rates as high as 10 mV s−1 (Fig. 7a). This impressive rate performance, for a nominal battery material, is due to sufficient counter-ion compensation from both an adequate volume of electrolyte within the pores and to rapid transport of ions to the ZnMn2O4 domains via the through-connected pore structure of the underlying CNF. A 3D design-enabled performance we have demonstrated with CNFs modified with other MnOx polymorphs.59
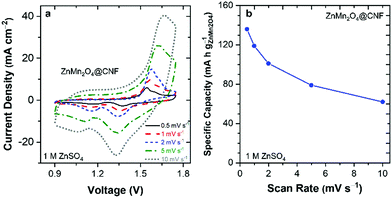 | ||
| Fig. 7 (a) Cyclic voltammograms and (b) specific capacity of ZnMn2O4@CNF in 1 M ZnSO4 as a function of scan rate. | ||
A specific capacity of 119 mA h gZnMn2O4−1 is delivered at 1 mV s−1 (Fig. 7b), on par with the 1-electron theoretical capacity of ZnMn2O4 (116 mA h g−1), further confirming that the charge-storage mechanism is H+ insertion/Zn4(OH)6SO4 precipitation. As the scan rate increases to 10 mV s−1, the capacity decreases to 62 mA h g−1 (Fig. 7b). The realization of theoretical specific capacity is a consequence of the 3D multifunctional electrode architecture (Fig. S7, ESI†). The 20 nm-thick ZnMn2O4 domains are well-wired to the underlying carbon current collector, as it is generated from the precursor MnOx phase that is deposited via MnO4−1 redox deposition. In this deposition, the carbon in the nanofoam serves as a sacrificial reductant, and thus the first few layers of the MnOx are embedded into the carbon current collector.43,46,47 The through-connected pore volume/structure of the 3D multifunctional electrode ensures an adequate supply and rapid transport of ions to the ZnMn2O4 domains,59 supporting rapid charge–discharge at nominally high rates (1 mV s−1 = 28 min charge/discharge) for a battery material. This 1-electron high-capacity at high rate is in agreement with our previous results for both crystalline spinel LiMn2O4@CNF and Na+-birnessite-type MnOx@CNF, where these electrodes deliver full theoretical capacity (148 mA h g−1 at 2 mV s−1 and 308 mA h g−1 at 1C, respectively) when cycled in Li+- and Zn2+-containing aqueous electrolytes, respectively.35,43
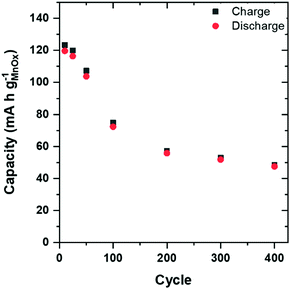
Long-term electrochemical stability is a key requirement for MnOx-based active materials used in aqueous Zn-ion cells. We cycle ZnMn2O4@CNF in two-terminal cells with a Zn-foil anode and 1 M ZnSO4 electrolyte at 1C (136 mA h gZnMn2O4−1) for 400 cycles (7 weeks). Capacity decays significantly over the first 200 cycles and plateaus from cycle 200 to 400, leading to a 50% decrease in total capacity (Fig. 8).
The mildly acidic nature of 1 M ZnSO4 (aq) is known to promote reductive dissolution of MnOx as Mn3+ disproportionates to generate soluble Mn2+, which could be the source of the capacity fade. To assess this hypothesis, we soaked ZnMn2O4@CNF in 1 M ZnSO4 for 13 days and upon addition of potassium periodate to a portion of the solution, the electrolyte changed from colorless to magenta, indicating the presence of soluble Mn2+ species (Fig. S8, ESI†), confirming the disproportionation reaction resulting from the mild acidity of 1 M ZnSO4. Gravimetric analysis of the ZnMn2O4@CNF after soaking in 1 M ZnSO4, revealed a 6 wt% loss, leaving 35 wt% ZnMn2O4 for charge-storage.
This long-term stability problem has been previously addressed by adding Mn2+ (e.g., 0.010–0.05 M MnSO4) to the electrolyte to drive the equilibrium back toward Mn3+/4+ oxide, resulting in extended cycle life.38 We do not obtain such improvements when using 0.05 M MnSO4 + 1 M ZnSO4 in our cycling studies. For our particular electrode structure, we calculate that if 10% of the nanofoam-supported ZnMn2O4 were to dissolve, the Mn2+ concentration would reach 0.7 M inside the pores (eqn (S3), ESI†). This degree of dissolution likely represents an extreme condition, but reveals that 0.05 M Mn2+ is insufficient at suppressing the disproportionation reaction in this porous CNF architecture. In on-going experiments, we are exploring other strategies, including buffering the electrolyte,30,60 as well as methods to form nanoscale protective coatings at the oxide surface, as previously achieved using bicarbonate electrolyte additives at LiMn2O4@CNF.43
Conclusions
Our ability to crystal engineer 2D lamellar birnessite-like Na+-MnOx inside high surface-area CNF is extended to generate nanocrystalline ZnMn2O4@CNF. We show that despite specific lattice sites for Zn2+ insertion into the spinel, the dominant charge-storage mechanism of ZnMn2O4@CNF in 1 M ZnSO4 remains H+ insertion/de-insertion coupled with precipitation/dissolution of Zn4(OH)6SO4·xH2O. A 50% decrease in capacity is observed over 400 cycles when cycled at 1C, which is attributed to dissolution of ZnMn2O4, the bulk of which resides in the CNF interior, via disproportionation of electrogenerated Mn3+ to Mn4+ and soluble Mn2+.Experimental
Chemicals and materials
Resorcinol (Sigma Aldrich, 99%), formaldehyde (Sigma Aldrich, 37 wt% in H2O, 10–15% methanol stabilizer), sodium carbonate (Aldrich Chemical Company, Inc., 99.5 + %), Na2SO4 (Sigma Aldrich, ≥99.0%), NaMnO4·H2O (Sigma Aldrich, ≥97%) and ZnSO4 (Sigma Aldrich, ≥99.0%) were used as received. Carbon fiber papers (Lydall Technimat), cellulose acetate filters (1.2 μm pores, SterliTech Corporation), and 0.25 mm Zn foil (Alfa Aesar, 99.98% metal basis) were used as described.ZnMn2O4@CNF synthesis
One-ply 40/500 carbon nanofoam papers (CNF) were fabricated using a previously reported protocol.61 Briefly, the 40/500 resorcinol–formaldehyde (RF) sol was prepared by mixing 10 g resorcinol + 14.74 g formaldehyde + 0.0177 g sodium carbonate + 13.9 g water and stirring on a magnetic stir plate set at 250 rpm for 30 min, followed by a 2.5 h resting period. Carbon fiber papers (2.5 × 4.5 cm2) were exposed to an air–ice RF plasma (Harrick PlasmaFlo PDC-FMG) for 45 min to introduce oxygen functionalities on the carbon fiber surfaces. The CFPs were then vacuum-infiltrated with the RF sol to generate RF-CFPs and placed between two glass slides with each glass slide edge secured with a mini binder clip. The glass slide assembly was then sealed in duct tape. The RF-CFPs were placed in an aluminum foil pouch with ∼2 mL of water and allowed to cure under ambient conditions for 20 h, then placed in a pressure cooker (Nesco 3-in-1, Target) for 9.5 h at “slow cook” (∼88–94 °C) and then at “warm” until removed. The RF-CFPs were removed from the glass slides, soaked in nanopure water and acetone, each for 1 h, and dried under ambient conditions. Pyrolysis of the RF-CFPs was performed in a tube furnace (Thermo Scientific Lindberg Blue M) under flowing argon by ramping to 1000 °C at a 1 °C min−1 and held at 1000 °C for 2 h to generate carbon nanofoam papers (CNFs).Manganese oxide (birnessite-like Na+-MnOx) was electrolessly deposited onto the “one-ply 40/500” CNF by soaking under vacuum in 0.1 M Na2SO4 for 20 h and then in 0.1 M NaMnO4·H2O + 0.1 M Na2SO4 for 20 h, generating Na+-MnOx@CNF.46 The Na+-MnOx@CNF were removed from the NaMnO4 solution, thoroughly rinsed with nanopure water, vacuum infiltrated with nanopure water and soaked under vacuum for 1 h; the rinse/soak process was repeated a total of three times. The Na+-MnOx@CNF were dried at 50 °C under flowing N2(g) for 20 h.
To generate ZnMn2O4@CNF, the Na+-MnOx@CNFs were vacuum infiltrated with 1.0 M ZnSO4 solution and soaked under vacuum for 24 h, removed from the 1 M ZnSO4 solution, rinsed copiously with nanopure water, and soaked in nanopure water under vacuum for 1 h, with the nanopure water rinse/soak step repeated two more times. The Zn2+-MnOx@CNFs were dried at 50 °C under flowing N2(g) for 12 h. Next, the Zn2+-MnOx@CNF papers were placed in a tube furnace under flowing argon, ramped to 300 °C at a rate of 2 °C min−1, held at 300 °C for 4 h, and then cooled to ambient temperature before removing from the furnace.
Elemental analysis
A ZnMn2O4@CNF sample was analyzed to quantitatively determine Mn, Na, and Zn content (sent to Galbraith Laboratories, Inc.). Prior to analysis by inductively coupled plasma–atomic emission spectroscopy, the samples were dried under vacuum.Electrochemical characterization
Prior to electrochemical tests, the ZnMn2O4@CNF electrode was vacuum-infiltrated with 1 M ZnSO4 for 4 h. Two-electrode Zn-ion Swagelok cells were fabricated with a ZnMn2O4@CNF cathode (1/2′′ diameter circle), a cellulose acetate filter wetted with 1 M ZnSO4 as the separator, and a 0.25 mm-thick Zn foil as the anode. A Gamry REF 600 potentiostat was used to collect cyclic voltammetry, linear sweep voltammetry, chronoamperometry, and AC electrochemical impedance spectroscopy data. Cyclic voltammetry was carried out from 0.9 V to 1.75 V at scan rates of 0.5, 1, 2, 5, and 10 mV s−1. Ex situ and EIS data on ZnMn2O4@CNF samples were generated by first doing a 10-cycle voltammetric break-in from 1.75 to 0.9 V to 1.75 V at 2 mV s−1, followed by linear-scan voltammetry at 0.5 mV s−1 to a specified voltage (1.75 V, 1.3 V, or 0.9 V) and holding at that voltage for either 30 min for ex situ characterization samples or 10 min for EIS. After electrochemical conditioning, the cell voltage was terminated, the ZnMn2O4@CNF was immediately removed, rinsed well with nanopure water, and dried under flowing N2(g) for 12 h prior to analysis by XPS, XRD, and SEM/EDS.Long-term cycling
Two-terminal Zn-ion cells with ZnMn2O4@CNF cathodes assembled as described above were galvanostatially cycled at 1C (136 mAh gZnMn2O4−1) on an Arbin battery cycler.Scanning electron microscopy
Exterior surface samples were cut with clean scissors and secured to aluminum stubs with conductive carbon tape (Ted Pella). Cross-sectional samples were prepared by immersing uncycled and conditioned ZnMn2O4@CNF samples in liquid nitrogen for 1 min, fractured with a new razor blade, and secured to a 45/90° aluminum stub with conductive carbon tape. Carbon paint was used to make an electrical connection between the exposed surface and the SEM stub, especially critical for imaging samples with electrically insulating Zn4(OH)6(SO4)·xH2O precipitates. All samples were imaged with a Leo Supra 55 SEM at 20 keV equipped with an Oxford Instruments Aztec energy-dispersive X-ray detector.X-ray photoelectron spectroscopy
Elemental analyses of the surface of the electrodes were performed using XPS (Thermo Scientific K-Alpha X-ray) equipped with a monochromatic Al Kα source (1486.68 eV) and a 400 μm elliptical spot size. High-resolution spectra over the C 1s, O 1s, Mn 2p, S 2p, and Zn 2p regions were obtained. The instrument was operated using a low-energy electron flood gun; the resulting spectra were not peak-shifted prior to quantitative analysis. Ratios of Mn:Zn and S:Zn were tracked to monitor the degree of precipitated film formation of Zn4(OH)6(SO4)·xH2O. The spectra were analyzed with Avantage (version 5.35).X-ray diffraction
X-ray diffraction patterns were collected for MnOx@CNF and ZnMn2O4@CNF series using a 3 kW Rigaku Smartlab X-ray diffractometer operating with a Cu Kα (λ = 1.5406 Å) radiation source in continuous mode. The samples were aligned with the incident X-rays by sandwiching each sample between a glass slide and the Rigaku reference sample holder. The average crystallite sizes of selected samples were calculated using peak broadening determined from whole pattern fitting in the Rigaku PDXL analysis software. The reference structure for the pattern fitting was ZnMn2O4 (ICDD# 01-071-2499).Conflicts of interest
The authors have no conflicts to declare.Acknowledgements
This work was supported by the U.S. Office of Naval Research.Notes and references
- Y. Chabre and J. Pannetier, Prog. Solid State Chem., 1995, 23, 1–130 CrossRef CAS.
- M. M. Thackeray, Prog. Solid State Chem., 1997, 25, 1–71 CrossRef CAS.
- D. Bélanger, T. Brousse and J. W. Long, ECS Interface Spring, 2008, 17, 49–52 Search PubMed.
- C. J. Xu, F. Y. Kang, B. H. Li and H. D. Du, J. Mater. Res., 2010, 25, 1421–1432 CrossRef CAS.
- M. Huang, F. Li, F. Dong, Y. X. Zhang and L. L. Zhang, J. Mater. Chem. A, 2015, 3, 21380–21423 RSC.
- Q. Z. Zhang, D. Zhang, Z. C. Miao, X. L. Zhang and S. L. Chou, Small, 2018, 14, 1702883–1702897 CrossRef PubMed.
- B. Tang, L. Shan, S. Liang and J. Zhou, Energy Environ. Sci., 2019, 12, 3288–3304 RSC.
- X. Zeng, J. Hao, Z. Wang, J. Mao and Z. Guo, Energy Storage Mater., 2019, 20, 410–437 CrossRef.
- J. Ming, J. Guo, C. Xia, W. Wang and H. N. Alshareef, Mater. Sci. Eng., R, 2019, 135, 58–84 CrossRef.
- M. Song, H. Tan, D. Chao and H. J. Fan, Adv. Funct. Mater., 2018, 41, 1802564 CrossRef.
- L. E. Blanc, D. Kundu and L. F. Nazar, Joule, 2020, 4, 771–799 CrossRef CAS.
- Y.-P. Deng, R. Liang, G. Jiang, Y. Jiang, A. Yu and Z. Chen, ACS Energy Lett., 2020, 5, 1665–1675 CrossRef CAS.
- Y. Wu, J. Fee, Z. Tobin, A. Shirazi-Amin, P. Kerns, S. Dissanayake, A. Mirich and S. L. Suib, ACS Appl. Energy Mater., 2020, 3, 1627–1633 CrossRef CAS.
- A. Dhiman and D. G. Ivey, Batteries Supercaps, 2020, 3, 293–305 CrossRef CAS.
- B. Yong, D. Ma, Y. Wang, H. Mi, C. He and P. Zhang, Adv. Energy Mater., 2020, 2002354 CrossRef CAS.
- J. Lee, J. B. Ju, W. I. Cho, B. W. Cho and S. H. Oh, Electrochim. Acta, 2013, 112, 138–143 CrossRef CAS.
- M. H. Alfaruqi, V. Mathew, J. Gim, S. Kim, J. Song, J. P. Baboo, S. H. Choi and J. Kim, Chem. Mater., 2015, 27, 3609–3620 CrossRef CAS.
- M. H. Alfaruqi, J. Gim, S. Kim, J. Song, J. Jo, S. Kim, V. Mathew and J. Kim, J. Power Sources, 2015, 288, 320–327 CrossRef CAS.
- H. Qin, Z. Yang, L. Chen, X. Chen and L. Wang, J. Mater. Chem. A, 2018, 6, 23757–23765 RSC.
- Y. Cheng, L. Luo, L. Zhong, J. Chen, B. Li, W. Wang, S. X. Mao, C. Wang, V. L. Sprenkle, G. Li and J. Liu, ACS Appl. Mater. Interfaces, 2016, 8, 13673–13677 CrossRef CAS PubMed.
- H. Liang, Z. Cao, F. Ming, W. Zhang, D. H. Anjum, Y. Cui, L. Cavallo and H. N. Alshareef, Nano Lett., 2019, 19, 3199–3206 CrossRef CAS PubMed.
- G. Li, Z. Yang, Y. Jiang, C. Jin, W. Huang, X. Ding and Y. Huang, Nano Energy, 2016, 25, 211–217 CrossRef CAS.
- P. Hu, T. Zhua, X. Wang, X. Zhou, X. Wei, X. Yao, W. Luo, C. Shi, K. A. Owusu, L. Zhou and L. Mai, Nano Energy, 2019, 58, 492–498 CrossRef CAS.
- J. S. Ko, P. P. Paul, G. Wan, N. Seitzman, R. H. DeBlock, B. S. Dunn, M. F. Toney and J. N. Weker, Chem. Mater., 2020, 32, 3028–3035 CrossRef CAS.
- H. Pan, Y. Shao, P. Yan, Y. Cheng, K. S. Han, Z. Nie, C. Wang, J. Yang, X. Li, P. Bhattacharya, K. T. Mueller and J. Liu, Nat. Energy, 2016, 1, 16039 CrossRef CAS.
- B. Lee, H. R. Seo, H. R. Lee, C. S. Yoon, J. H. Kim, K. Y. Chung, B. W. Cho and S. H. Oh, ChemSusChem, 2016, 9, 2948–2956 CrossRef CAS PubMed.
- Y. Wu, K. Zhang, S. Chen, Y. Liu, Y. Tao, X. Zhang, Y. Ding, T. Hayat, A. M. Abusorrah and S. Dai, ACS Appl. Energy Mater., 2020, 3, 319–327 CrossRef CAS.
- Z. Yao, D. Cai, Z. Cui, Q. Wang and H. Zhan, Ceram. Int., 2020, 46, 11237–11245 CrossRef CAS.
- D. L. Chao, W. H. Zhou, C. Ye, Q. H. Zhang, Y. G. Chen, L. Gu, K. Davey and S. Z. Qiao, Angew. Chem., Int. Ed., 2019, 58, 7823–7828 CrossRef CAS PubMed.
- C. F. Bischoff, O. S. Fitz, J. Burns, M. Bauer, H. Gentischer, K. P. Birke, H.-M. Henning and D. Biro, J. Electrochem. Soc., 2020, 167, 020545–020553 CrossRef CAS.
- D. Wu, L. M. Housel, S. J. Kim, N. Sadique, C. D. Quilty, L. Wu, R. Tappero, S. L. Nicholas, S. Ehrlich, Y. Zhu, A. C. Marschilok, E. S. Takeuchi, D. C. Bock and K. J. Takeuchi, Energy Environ. Sci., 2020, 13, 4322–4333 RSC.
- T. Zhang, Y. Tang, G. Fang, C. Zhang, H. Zhang, X. Guo, X. Cao, J. Zhou, A. Pan and S. Liang, Adv. Funct. Mater., 2020, 3, 2002711 CrossRef.
- L. Li, T. K. A. Hoang, J. Zhi, M. Han, S. Li and P. Chen, ACS Appl. Mater. Interfaces, 2020, 12, 12834–12846 CrossRef PubMed.
- W. Sun, F. Wang, S. Hou, C. Yang, X. Fan, Z. Ma, T. Gao, F. Han, R. Hu, M. Zhu and C. Wang, J. Am. Chem. Soc., 2017, 139, 9775–9778 CrossRef CAS PubMed.
- J. S. Ko, M. B. Sassin, J. F. Parker, D. R. Rolison and J. W. Long, Sustainable Energy Fuels, 2018, 2, 626–636 RSC.
- J. S. Ko, M. D. Donakowski, M. B. Sassin, J. F. Parker, D. R. Rolison and J. W. Long, MRS Commun., 2019, 9, 99–106 CrossRef CAS.
- N. Zhang, F. Cheng, Y. Liu, Q. Zhao, K. Lei, C. Chen, X. Liu and J. Chen, J. Am. Chem. Soc., 2016, 138, 12894–12901 CrossRef CAS.
- X. Wu, Y. Xiang, Q. Peng, X. Wu, Y. Li, F. Tang, R. Song, Z. Liu, Z. He and X. Wu, J. Mater. Chem. A, 2017, 5, 17990–17997 RSC.
- L. Chen, Z. Yang, H. Qin, X. Zeng and J. Meng, J. Power Sources, 2019, 425, 162–169 CrossRef CAS.
- J.-W. Lee, S.-D. Seo and D.-W. Kim, J. Alloys Compd., 2019, 800, 478–482 CrossRef CAS.
- L. Chen, Z. Yang, H. Qin, X. Zeng, J. Meng and H. Chen, Electrochim. Acta, 2019, 317, 155–163 CrossRef CAS.
- H. Zhang, J. Wan, Q. Liu, W. He, Z. Lai, X. Zhang, M. Yu, Y. Tong and X. Lu, Energy Storage Mater., 2019, 21, 154–161 CrossRef.
- M. B. Sassin, S. G. Greenbaum, P. E. Stallworth, A. N. Mansour, B. P. Hahn, K. A. Pettigrew, D. R. Rolison and J. W. Long, J. Mater. Chem. A, 2013, 1, 2431–2440 RSC.
- M. D. Donakowski, J. M. Wallace, M. B. Sassin, K. W. Chapman, J. F. Parker, J. W. Long and D. R. Rolison, CrystEngComm, 2016, 18, 6035–6048 RSC.
- J. S. Ko, M. B. Sassin, D. R. Rolison and J. W. Long, Electrochim. Acta, 2018, 275, 225–235 CrossRef CAS.
- A. E. Fischer, K. A. Pettigrew, D. R. Rolison, R. M. Stroud and J. W. Long, Nano Lett., 2007, 7, 281–286 CrossRef CAS PubMed.
- M. B. Sassin, C. N. Chervin, D. R. Rolison and J. W. Long, Acc. Chem. Res., 2013, 46, 1062–1074 CrossRef CAS PubMed.
- J. C. Knight, S. Therese and A. Manthiram, J. Mater. Chem. A, 2015, 3, 21077–21082 RSC.
- S. Yang, M. Zhang, X. Wu, X. Wu, F. Zeng, Y. Li, S. Duan, D. Fan, Y. Yang and X. Wu, J. Electroanal. Chem., 2019, 832, 69–74 CrossRef CAS.
- V. Soundharrajan, B. Sambandam, S. Kim, S. Islam, J. Jo, S. Kim, V. Mathew, Y.-K. Sun and J. Kim, Energy Storage Mater., 2020, 28, 407–417 CrossRef.
- Z. Li, S. Ganapathy, Y. Xu, Z. Zhou, M. Sarilar and M. Wagemaker, Adv. Energy Mater., 2019, 9, 1900237–1900246 CrossRef.
- Q. Pang, H. Zhao, R. Lian, Q. Fu, Y. Wei, A. Sarapulova, J. Sun, C. Wang, G. Chen and H. Ehrenberg, J. Mater. Chem. A, 2020, 8, 9567–9578 RSC.
- D. Kundu, S. H. Vajargah, L. Wan, B. Adams, D. Prendergast and L. F. Nazar, Energy Environ. Sci., 2018, 11, 881–892 RSC.
- P. Oberholzer, E. Tervoort, A. Bouzid, A. Pasquarello and D. Kundu, ACS Appl. Mater. Interfaces, 2019, 11, 674–682 CrossRef CAS PubMed.
- Y. Dong, M. Jia, Y. Wang, J. Xu, Y. Liu, L. Jiao and N. Zhang, ACS Appl. Energy Mater., 2020, 3, 11183–11192 CrossRef CAS.
- X. Shan, S. W. Kim, A. M. M. Abeykoon, G. Kwon, D. Olds and X. Teng, ACS Appl. Mater. Interfaces, 2020, 12, 54627–54636 CrossRef CAS PubMed.
- W. Liu, L. Dong, B. Jiang, Y. Huang, X. Wang, C. Xu, Z. Kang, J. Mou and F. Kang, Electrochim. Acta, 2019, 320, 134565 CrossRef CAS.
- L. Ma, S. Chen, H. Li, Z. Ruan, Z. Tang, Z. Liu, Z. Wang, Y. Huang, Z. Pei, J. A. Zapiena and C. Zhi, Energy Environ. Sci., 2018, 11, 2521–2530 RSC.
- M. B. Sassin, C. P. Hoag, B. T. Willis, N. W. Kucko, D. R. Rolison and J. W. Long, Nanoscale, 2013, 5, 1649–1657 RSC.
- M. Mateos, N. Makivic, Y.-S. Kim, B. Limoges and V. Balland, Adv. Energy Mater., 2020, 10, 2000332 CrossRef CAS.
- J. C. Lytle, J. M. Wallace, M. B. Sassin, A. J. Barrow, J. W. Long, J. L. Dysart, C. H. Renninger, M. P. Saunders, N. L. Brandell and D. R. Rolison, Energy Environ. Sci., 2011, 4, 1913–1925 RSC.
Footnotes |
| † Electronic supplementary information (ESI) available: Tables of composition and structural properties; data from additional XRD, EDS; XPS, impedance, microscopy, and voltammetric analyses. See DOI: 10.1039/d1ma00159k |
| ‡ Present address: Applied Physics Laboratory, Baltimore, MD USA. |
| This journal is © The Royal Society of Chemistry 2021 |

