 Open Access Article
Plastic strain relaxation and alloy instability in epitaxial corundum-phase (Al,Ga)2O3 thin films on r-plane Al2O3
Marius
Grundmann
 *a,
Tillmann
Stralka
 a,
Michael
Lorenz
 a,
Susanne
Selle
b,
Christian
Patzig
b and
Thomas
Höche
 b
b
aUniversität Leipzig, Felix Bloch Institute for Solid State Physics, Linnéstr. 5, D-04103 Leipzig, Germany. E-mail: grundmann@physik-uni-leipzig.de
bFraunhofer Institute for Microstructure of Materials and Systems IMWS, Walter-Huelse-Strasse 1, D-06120 Halle, Germany
First published on 11th May 2021
Abstract
The growth of (AlxGa1−x)2O3 alloy thin films in the corundum phase on r-plane (01.2) Al2O3 substrates is investigated. The growth mode changes from step flow for pseudomorphic layers to three-dimensional growth for strongly relaxed layers. Atomic force microscopy and transmission electron microscopy reveal defects due to prismatic and basal slip. An instability in the growth of the alloy x ≈ 0.6, manifested in doubly-periodic incorporation of Al-rich slabs, is observed.
1 Introduction
Gallium oxide and related materials, which are ultrawide-bandgap semiconductor materials, have emerged as promising candidates for a new generation of high-power devices.1,2 These sequioxides can be fabricated as thin films in various crystal phases.3,4 The focus of this paper is on the rhombohedral (or trigonal) phase, also termed the corundum- or α-phase. The growth of α-Ga2O35,6 and α-(Al,Ga)2O3 alloys for buffer layers7–10 on sapphire has gained large interest. Also, the (Al,Ga)2O3-system is interesting as a barrier layer for Ga2O3- and (In,Ga)2O3-based heterostructures;11,12 the corundum phase offers larger band offsets compared to the monoclinic phase.13 Compared to the more familiar hexagonal wurtzite semiconductors (such as GaN and ZnO), the trigonal crystal structure introduces particular effects regarding the stress–strain situation.14In this work the growth of α-(Al,Ga)2O3 layers on r-plane Al2O3 is investigated using techniques with high lateral resolution in order to detect and characterize individual defects arising from plastic strain relaxation. A peculiar alloy instability is found, leading to an inhomogeneous cation distribution along the growth direction.
2 Experimental methods
Selected samples15 fabricated by pulsed laser deposition (PLD)16 were investigated. For more details concerning PLD growth, see ref. 17–19. The substrate temperature was set to about 750 °C or 1000 °C. The oxygen partial pressure was 10−3 mbar. The targets for our pulsed laser deposition (PLD) process were fabricated from high purity Al2O3 and Ga2O3 powders in different relative quantities. All samples were grown with 30![[thin space (1/6-em)]](https://www.rsc.org/images/entities/char_2009.gif) 000 pulses on r-plane (01.2) Al2O3 substrates. Atomic force microscopy (AFM) was performed with a Park Scientific XE-150 in non-contact mode.20 (Scanning) Transmission electron microscopy ([S]TEM) was performed using a Thermo Fisher Scientific TITAN3 G2 80-300 aberration-corrected (objective lens) instrument operated at 300 kV in high-resolution multi-beam interference contrast and high angle annular dark field (HAADF) modes for either TEM or STEM imaging, respectively. Energy dispersive X-ray (EDX) mappings were additionally recorded in STEM mode, using a FEI SuperX detector system in the same microscope. Prior to inspection, cross-sectioned samples were prepared and thinned to electron transparency using the wedge polishing approach explained in more detail in ref. 21. Static charging of samples upon TEM inspection was avoided by selective carbon coating.22
000 pulses on r-plane (01.2) Al2O3 substrates. Atomic force microscopy (AFM) was performed with a Park Scientific XE-150 in non-contact mode.20 (Scanning) Transmission electron microscopy ([S]TEM) was performed using a Thermo Fisher Scientific TITAN3 G2 80-300 aberration-corrected (objective lens) instrument operated at 300 kV in high-resolution multi-beam interference contrast and high angle annular dark field (HAADF) modes for either TEM or STEM imaging, respectively. Energy dispersive X-ray (EDX) mappings were additionally recorded in STEM mode, using a FEI SuperX detector system in the same microscope. Prior to inspection, cross-sectioned samples were prepared and thinned to electron transparency using the wedge polishing approach explained in more detail in ref. 21. Static charging of samples upon TEM inspection was avoided by selective carbon coating.22
3 Experimental results
3.1 Strain relaxation
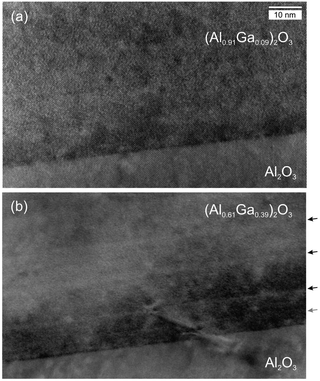
In Fig. 1a, a TEM cross-sectional micrograph of the interface region of a pseudomorphic (AlxGa1−x)2O3 layer (x = 0.91) is shown; a flat and abrupt interface is visible without defects. For a smaller Al cation fraction, in a plastically relaxed sample, the interface looks more disordered (Fig. 1b for x = 0.61) and defects appear that apparently also extend back into the substrate. The slight stripes parallel to the interface will be discussed below in more detail.It should be emphasized that the quality of our pseudomorphic epitaxial layers (with sufficiently large Al-concentration) is very high as no structural defects can be identified with transmission electron microscopy or atomic force microscopy. X-ray diffraction shows clearly defined layers and substrate peaks similar to results previously published and discussed for similar samples.18,19
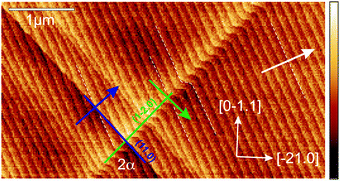
Plastic strain relaxation in the corundum phase occurs preferentially via twinning and prismatic and basal slip.23–26 The nature of plastic relaxation in the thin films on an r-plane corundum has been investigated previously using X-ray diffraction and detailed analysis.17–19 The plastic relaxation is anisotropic at first and starts through prismatic slip via the a-plane glide system and subsequently via basal slip (c-plane glide system).18,19 The prismatic slip lines were identified first in ref. 19 and an example is shown in Fig. 2, where the surface morphology of a slightly relaxed thin film (x = 0.88) is imaged via AFM. The average surface step height is determined as h = 0.36(3) nm, close to the r-plane lattice spacing d(01.2) = 0.348 nm (for Al2O3) and in agreement with previous reports, e.g.ref. 27, where h = 0.33(5) nm was found. In the following, the step height is also termed a ‘monolayer’; the atomic arrangement of the r-plane is discussed in ref. 28. Two types of slip-lines are visible. They form a mutual angle of 2α = 86.0(3)°, matching our expectation of an angle α = ±42.9° (for Al2O3 lattice parameters), which the two types form with the [0![[1 with combining macron]](https://www.rsc.org/images/entities/char_0031_0304.gif) 11]-direction.18,29
11]-direction.18,29
The two types are related to the (11.0) and (1![[2 with combining macron]](https://www.rsc.org/images/entities/char_0032_0304.gif) .0) a-planes. As detailed in ref. 18, the b1 = 1/3[
.0) a-planes. As detailed in ref. 18, the b1 = 1/3[![[1 with combining macron]](https://www.rsc.org/images/entities/char_0031_0304.gif) 101] Burgers vector for the (11.0)-plane and b2 = 1/3[
101] Burgers vector for the (11.0)-plane and b2 = 1/3[![[1 with combining macron]](https://www.rsc.org/images/entities/char_0031_0304.gif) 01
01![[1 with combining macron]](https://www.rsc.org/images/entities/char_0031_0304.gif) ] Burgers vector for the (1
] Burgers vector for the (1![[2 with combining macron]](https://www.rsc.org/images/entities/char_0032_0304.gif) .0)-plane have the same length of their edge component but opposite tilt components. The sum of the two vectors is bS = 1/3[
.0)-plane have the same length of their edge component but opposite tilt components. The sum of the two vectors is bS = 1/3[![[2 with combining macron]](https://www.rsc.org/images/entities/char_0032_0304.gif) 110], |bS| = a, leading to strain relaxation in this direction. The tilt components for b1,2 are bp = ±d(01.2). This means that when crossing the slip-line in the direction of the (in-plane projection of the) Burgers vector b1 (i.e. the (11.0) slip-line) the next higher terrace is reached, and accordingly for b2 (i.e. the (1
110], |bS| = a, leading to strain relaxation in this direction. The tilt components for b1,2 are bp = ±d(01.2). This means that when crossing the slip-line in the direction of the (in-plane projection of the) Burgers vector b1 (i.e. the (11.0) slip-line) the next higher terrace is reached, and accordingly for b2 (i.e. the (1![[2 with combining macron]](https://www.rsc.org/images/entities/char_0032_0304.gif) .0) slip-line) the next lower terrace is reached.
.0) slip-line) the next lower terrace is reached.
The directions of the edge components of the two Burgers vectors are shown as blue (green) arrows for b1 (b2). Indeed, when following b1 (b2), the next higher (lower) terrace is reached, confirming the sign and magnitude of the expected tilt components of the Burgers vector. It should be noted that for ensuring the correct orientation of the AFM image, the direction of the (projection of the) c-axis was confirmed using a X-ray diffraction (using a PANalytical X’Pert PRO materials research diffractometer) ϕ-scan around the (01.2) normal of the (00.6) reflex.
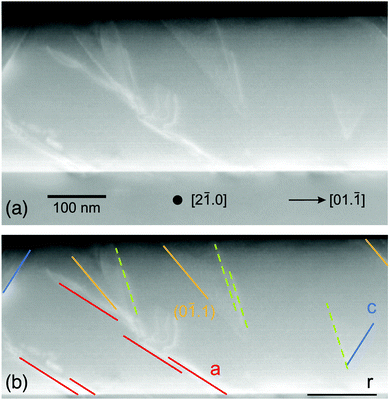
Structural defects were investigated by cross-sectional TEM investigations. In Fig. 3, various defects are found, with the most prominent being features parallel to the a-plane glide planes. These are indicated by red lines in the lower panel of Fig. 3. Also basal defects are visible as expected for this already strongly relaxed sample (blue lines). Some other defects seem to stem from (0![[1 with combining macron]](https://www.rsc.org/images/entities/char_0031_0304.gif) .1)-planes (orange lines); another set of lines with an angle of about 103° against the [01.
.1)-planes (orange lines); another set of lines with an angle of about 103° against the [01.![[1 with combining macron]](https://www.rsc.org/images/entities/char_0031_0304.gif) ]-direction, for which no simple plane was found, is shown as dashed lines.
]-direction, for which no simple plane was found, is shown as dashed lines.
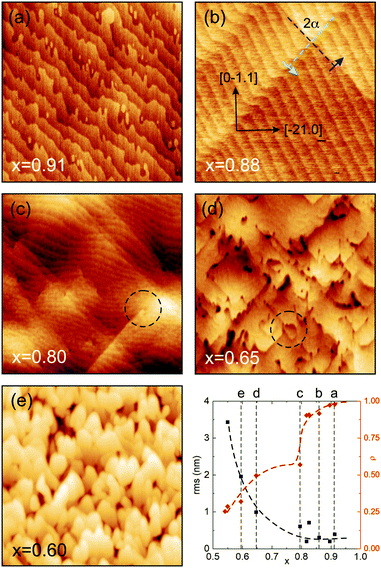
The comparison of the AFM-derived surface morphologies of layers with different Al cation fractions, fabricated under identical growth conditions (1000 °C, 30![[thin space (1/6-em)]](https://www.rsc.org/images/entities/char_2009.gif) 000 PLD pulses), shows significant changes in correlation with the strain relaxation. In the plot of Fig. 4, the average relaxation in the two perpendicular in-plane directions, ρ = (ρx + ρy)/2, is shown, where ρx = ρy = 1 (0) means a pseudomorphic (fully relaxed) film. For x > 0.8, for the given layer thicknesses, anisotropic relaxation via prismatic slip is present, while for x < 0.8 strong relaxation via basal slip sets in and also the rms surface roughness increases strongly. More details can be seen from the AFM scans.
000 PLD pulses), shows significant changes in correlation with the strain relaxation. In the plot of Fig. 4, the average relaxation in the two perpendicular in-plane directions, ρ = (ρx + ρy)/2, is shown, where ρx = ρy = 1 (0) means a pseudomorphic (fully relaxed) film. For x > 0.8, for the given layer thicknesses, anisotropic relaxation via prismatic slip is present, while for x < 0.8 strong relaxation via basal slip sets in and also the rms surface roughness increases strongly. More details can be seen from the AFM scans.
Fig. 4a depicts a pseudomorphic (Al,Ga)2O3 thin film with a surface that looks very much like the typical morphology of the Al2O3r-plane annealed at 1000 °C for 1 h, exhibiting ‘comb-shaped chemical domains’ as reported for example in ref. 27. The growth occurs via the step-flow mode. Fig. 4b shows the surface of a film just above the critical thickness for plastic strain relaxation (same sample as in Fig. 2). The terrace structure is regular and the slip-lines have already been discussed above. With decreasing Al cation fraction and thus increasing lattice mismatch, more defects develop. In Fig. 4c it becomes visible that the slip-lines exhibit endings, hinting at defect interaction and annihilation. Also, the terrace structure becomes more irregular and the surface appears a bit wobbly. For even stronger relaxation (Fig. 4d) defects cluster and lead to stronger modulation of the surface height. Eventually (Fig. 4e), terraces cannot be distinguished anymore and the growth has changed from the step-flow to 3D growth mode.
The use of a high growth temperature of 1000 °C leads to a promotion of strain relaxation but reduced gallium incorporation. The crystal quality is high and comparable with growth at lower temperatures in the range of 700–800 °C.19 However, only a high-temperature annealing step prior to growth can ensure a terraced surface like in Fig. 4a.
3.2 Alloy instability
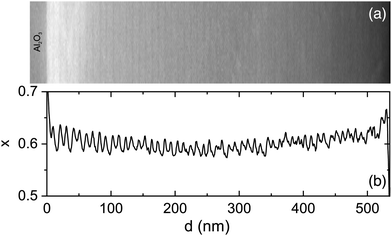
In Fig. 1b, a stripe-like modulation along the growth direction is visible which shall be discussed in more detail in the following. It is related to a modulation of the cation ratio. For a more specific analysis, EDX maps were recorded in STEM mode and linescans of the Al- and Ga-fractions in the growth direction were extracted. It should be noted that for the sample with x = 0.91, such a modulation is absent in EDX measurements. Also, sample and target rotations as possible sources of the modulation30 (or PLD target inhomogeneities) can be technically excluded. The target rotation was 0.5 Hz (i.e. one full rotation in 2 s), the substrate rotation was 2/29 ≈ 0.069 rounds per second, and the laser pulse frequency was 15 Hz. The growth rate was about 1.75(5) nm/100 pulses.18 Thus for the vertical period of about 10.1 nm (see analysis below), 575(15) pulses were made, i.e. 38(1) s of growth. In that time the target rotated about 19 times and the substrate rotated 2.64(7) times.In Fig. 5 the HAADF contrast shows a periodic modulation across the entire layer thickness. A linescan, averaged perpendicular to the direction of the linescan, shows the modulation of the Al-concentration. The separation of the maxima is doubly-periodic as shown in Fig. 6. Up to about 300 nm layer thickness, the periods are quite regular with alternating separations of 11.2(4) nm (about 32 monolayers) and 9.1(3) nm (about 26 monolayers), as indicated by dashed lines. On average, the periodicity is p = 10.2 nm. For larger distances from the interface, the modulation becomes weaker and less regular (possibly due to the slight bending of the cross-sectional and wedge-shaped sample).
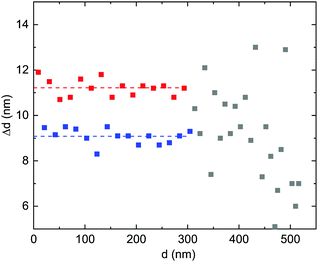 | ||
| Fig. 6 Distances of maxima of the Al cation fraction along the linescan shown in Fig. 5. Up to d = 300 nm, the two different separations are shown in blue and red symbols, with their averages indicated as dashed lines. The less regular separations for d > 300 nm are shown as grey symbols. | ||
In the higher resolution EDX maps depicted in Fig. 7, the stripe-like modulation of the Al- and Ga-contents is also obvious. The oxygen signal intensity changes slightly between the substrate and the film, possibly due to the slightly decreasing TEM sample thickness from the substrate to the top of the film. In the substrate, the (non-calibrated) Al-signal xEDX,Al correlates with 100% of the cations. For the film, the (non-calibrated) Ga-signal xEDX,Ga is multiplied by a factor f such that xEDX,Al + fxEDX,Ga divided by the oxygen signal is constant throughout the film. The Al cation fraction x is then calculated as xEDX,Al/(xEDX,Al + fxEDX,Ga). This procedure yields an Al cation fraction x close to the average concentration of x = 0.608 determined for this film from the X-ray diffraction analysis.18 It should be noted that in Fig. 8 also the gallium fraction is shown for comparison, but this is given by 1 − x in our procedure and does not provide further information.
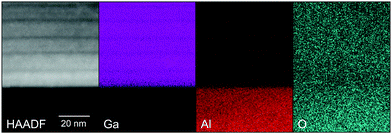 | ||
| Fig. 7 STEM images of an α-(Al0.61Ga0.39)2O3 thin film on (01.2) Al2O3 (bottom part) with HAADF contrast and maps of gallium, aluminum and oxygen signals as labeled. | ||
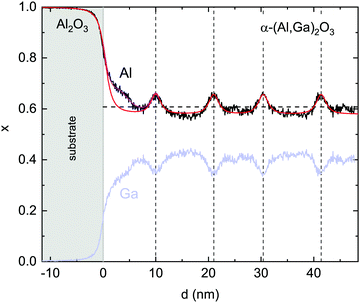 | ||
Fig. 8 STEM–EDX linescans (averaged laterally over 53 nm) of the Al-fraction x (black) extracted from Fig. 7. The gallium content 1 − x is shown in light blue. The light grey area indicates the substrate. The vertical dashed lines mark the maxima. The horizontal dashed line denotes the average Al cation fraction ![[x with combining macron]](https://www.rsc.org/images/entities/i_char_0078_0304.gif) = 0.608 as determined by X-ray diffraction. The red and purple lines represent fits as discussed in the text. = 0.608 as determined by X-ray diffraction. The red and purple lines represent fits as discussed in the text. | ||
The Al-fraction is modulated between about x = 0.58 and x = 0.66 (for the given spatial resolution) with maxima about 10 nm (about 29 lattice constants) apart on average. This leads to the conclusion that, at least for the given growth parameters, the growth exhibits an instability, with aluminum segregating on the surface up to a certain amount which is then incorporated within a thin, Al-rich slab.
The EDX linescan has a finite spatial resolution as can be seen from the smooth transition of the Al/Ga ratio at the interface that is assumed to be atomically sharp. A Gaussian broadening31 cannot model this lineshape. It can be modeled, however, rather well using a sigmoidal broadening function g(d) of the type (we restrict to γ > 0 in the following),
 | (1) |
All lengths are measured here in nm. The maximum is g(d = 0) = 1/(2γ) and the full width at half maximum (FWHM) is 2γχ ( ). The integral of g over all d is unity. Using this function, the EDX linescan can be fitted rather closely (red line in Fig. 8). The gradual interface is well reproduced by a step function (positioned at linescan coordinate d = 0) from 1 to x′ = 0.58 convoluted with g using γ = 1.4 nm. The periodic Al enrichments were fitted with delta-like additional aluminum convoluted by βg with the same γ-value as for the interface and β = 0.22. The lineshape of the Al-rich slabs is mimicked rather well; it has the same broadening γ as found for the substrate/film interface, meaning that the actual width d′ of the Al-distribution is much smaller than the FWHM of the broadening, about 2.2 nm.32
β represents the integrated extra aluminum; it could correspond to a pure Al2O3 layer of thickness s = (1 − x′)/β = 0.5. Therefore, it can be concluded that the EDX data are compatible with the presence of thin, periodic layers with pure Al2O3, with a thickness of about 0.5 nm ≈ 1.5 monolayers, or for example 2 monolayers with an Al cation fraction of about 0.9. The average Al cation fraction for this model is (p = 10.2 nm)  , which is in good agreement with the EDX area average of x = 0.607 and the X-ray result of x = 0.608.18 Another feature, a locally higher Al-concentration up to about 5 nm from the interface in the EDX linescan, can be additionally fitted with another Al-rich slab but with a larger broadening of γ = 3.3 nm and β = 0.44 (purple line); this feature is also directly visible in Fig. 1b, where it is indicated by the grey arrow.
First the situation is discussed from a total energy perspective. From a thermodynamic standpoint, the corundum-phase (AlxGa1−x)2O3 alloy is metastable for x < 0.7113 or for x < 0.84 for a cation-disordered phase33 (the stable phase is the monoclinic β-phase). Thus, our α-phase layer with x ≈ 0.6 is expected to be in the metastable range for the bulk material. In Fig. 9 the enthalpy of formation is reproduced from ref. 13. It is zero for x = 1 and it is sublinear34 with 1 − x.
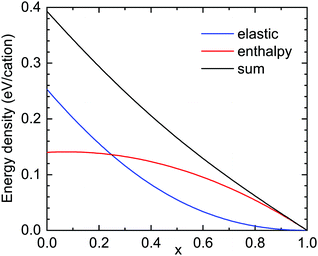 | ||
| Fig. 9 Formation enthalpy (red, from ref. 13, zero for Al2O3) and elastic strain energy for pseudomorphic growth (blue) and their sum (black) for (AlxGa1−x)2O3 layers on r-plane Al2O3. | ||
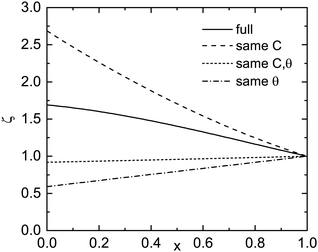
The total strain energy density uel is calculated for pseudomorphic conditions within the continuum elasticity model.35,36 It is expected that the energy increases roughly like (1 − x)2, û = uel/(1 − x)2. In Fig. 10, ζ(x) = û(x)/û(x → 1), the elastic strain energy divided by (1 − x)2 and normalized to 1 for x → 1 is depicted (for the r-plane). If the elastic constants and the c/a-ratio did not change between Al2O3 and Ga2O3, ζ would be close to 1. For the given material parameters (same as in ref. 18), ζ increases37 from 1 to about 1.70 for x = 0, meaning that the elastic energy grows slightly super-quadratically. For Ga2O3, the calculation yields uel = 1.428 × 10⁹ J m−3. The cation density ρc is calculated from the density of Al2O3 (ρ = 3950 kg m−3) and the molar masses (MAl2O3 = 0.10196 kg mol−1, MGa2O3 = 0.18744 kg mol−1) as well as the lattice constants; for Al2O3, ρc = 3.109 × 1028 m−3 is found. In Fig. 9, the elastic strain energy is shown in units of eV per cation.
The question is whether the separation of a material with average Al cation fraction ![[x with combining macron]](https://www.rsc.org/images/entities/i_char_0078_0304.gif) and thickness p into a thin Al-rich slab of concentration x′′ >
and thickness p into a thin Al-rich slab of concentration x′′ > ![[x with combining macron]](https://www.rsc.org/images/entities/i_char_0078_0304.gif) and thickness s and the remaining part with slightly lower Al-concentration x′ <
and thickness s and the remaining part with slightly lower Al-concentration x′ < ![[x with combining macron]](https://www.rsc.org/images/entities/i_char_0078_0304.gif) is energetically unfavorable. First, the average concentration
is energetically unfavorable. First, the average concentration ![[x with combining macron]](https://www.rsc.org/images/entities/i_char_0078_0304.gif) fulfills
fulfills  and second
  ; therefore
  . Since x′′ cannot be larger than 1, s must be at least,
 | (2) |
The difference of energies (per area) ε of the homogeneous (εh = pu(x)) and inhomogeneous (εih) cases is,
 | (3) |
In the case of Δε > 0, the phase separation is energetically favorable, and also for the ratio ![[small epsilon, Greek, circumflex]](https://www.rsc.org/images/entities/i_char_e107.gif) = εh/εih > 1. If the total energy follows a (1 − x)α-law,
= εh/εih > 1. If the total energy follows a (1 − x)α-law, ![[small epsilon, Greek, circumflex]](https://www.rsc.org/images/entities/i_char_e107.gif) > 1 for α < 1 and
> 1 for α < 1 and ![[small epsilon, Greek, circumflex]](https://www.rsc.org/images/entities/i_char_e107.gif) < 1 for α > 1. Thus the enthalpy part with a sublinear slope favors phase separation and the strain energy with a (more or less) quadratic behavior stabilizes a homogeneous alloy distribution. For the actual total energy (black line in Fig. 9), which is almost linear,
< 1 for α > 1. Thus the enthalpy part with a sublinear slope favors phase separation and the strain energy with a (more or less) quadratic behavior stabilizes a homogeneous alloy distribution. For the actual total energy (black line in Fig. 9), which is almost linear, ![[small epsilon, Greek, circumflex]](https://www.rsc.org/images/entities/i_char_e107.gif) is close to 1 but slightly smaller,
is close to 1 but slightly smaller, ![[small epsilon, Greek, circumflex]](https://www.rsc.org/images/entities/i_char_e107.gif) = 0.994 for s = smin (and approaches 1 for s → p). For relaxation of 40% of the strain energy,
= 0.994 for s = smin (and approaches 1 for s → p). For relaxation of 40% of the strain energy, ![[small epsilon, Greek, circumflex]](https://www.rsc.org/images/entities/i_char_e107.gif) (smin) = 1.01 and becomes larger than 1. What can be taken from this is that the total energy situation is close to the instability point where the alloy can phase separate. If cation disorder is considered, the enthalpy term becomes smaller by approximately a factor of two,33 favoring alloy homogeneity. However, other energies such as surface or interface energies have not been considered here.
(smin) = 1.01 and becomes larger than 1. What can be taken from this is that the total energy situation is close to the instability point where the alloy can phase separate. If cation disorder is considered, the enthalpy term becomes smaller by approximately a factor of two,33 favoring alloy homogeneity. However, other energies such as surface or interface energies have not been considered here.
The epitaxial growth stabilizes the corundum phase in the first place but an alloy composition instability evolves. Besides total energy arguments, certainly the kinetics of formation can also play a role. A possible growth model includes the enrichment of physi-sorbed Al on the growth surface up to one and a half extra monolayers which subsequently blocks gallium incorporation and is chemisorbed into the thin film. Possibly an extreme case of alloy ordering is observed here. Whether this happens at growth temperature or during cooling cannot be determined from the given experiments.
A well-known case of alloy ordering is the Ga/In monolayer ordering along 〈![[1 with combining macron]](https://www.rsc.org/images/entities/char_0031_0304.gif) 11〉 in Ga0.5In0.5P.38 For the growth of (Ga0.75Al0.25)As on (110) GaAs, Al/Ga-cation ratio modulation along the growth direction was reported in ref. 39 and a 7 nm periodic (unquantified) change in the Al/Ga-ratio for growth on the (111)-plane was observed in ref. 40. AlAs (or Al-rich) monolayers within an (Al0.3Ga0.7)As alloy along [110] were reported in ref. 41. Since the lattice-mismatch between (Al,Ga)As and GaAs is very small, strain effects are not made responsible.
11〉 in Ga0.5In0.5P.38 For the growth of (Ga0.75Al0.25)As on (110) GaAs, Al/Ga-cation ratio modulation along the growth direction was reported in ref. 39 and a 7 nm periodic (unquantified) change in the Al/Ga-ratio for growth on the (111)-plane was observed in ref. 40. AlAs (or Al-rich) monolayers within an (Al0.3Ga0.7)As alloy along [110] were reported in ref. 41. Since the lattice-mismatch between (Al,Ga)As and GaAs is very small, strain effects are not made responsible.
A bulk of literature has been devoted towards the theoretical treatment of lateral (in-plane) composition fluctuations42–44 that have been observed for several cubic and hexagonal semiconductor alloy systems, e.g.ref. 45 and 46. A microscopic model for the observed vertical segregation mechanism(s) here, however, seems missing. We therefore suggest that the observed effect, possibly due to an interplay of growth kinetics and alloy mixing effects, makes an atomistic modeling of the growth kinetics and alloy ordering necessary.
4 Summary and conclusion
In summary, direct evidence for structural defects associated with the plastic relaxation mechanisms of corundum-phase (AlxGa1−x)2O3 thin films on (01.2) r-plane Al2O3 has been presented. The initial relaxation via prismatic slip is subsequently joined by basal slip. For an epitaxial layer with a fairly low Al cation fraction (x ≈ 0.6) which is expected to be metastable in the bulk, a peculiar alloy instability has been found, leading to the doubly-periodic inclusion of Al-rich slabs, pure Al2O3 or close to it. These findings may pose limits on the controllability of the growth of α-phase (Al,Ga)2O3-based heterostructures, at least for the substrate plane and growth conditions investigated here.Conflicts of interest
There are no conflicts to declare.Acknowledgements
The authors thank M. Hahn for the PLD target preparation, H. Hochmuth for the PLD growth, C. Sturm for the thickness determination with ellipsometry, A. Böbenroth for the TEM sample preparation, and J. Lenzner for the EDX measurements. This work was supported by the Europäischer Fond für Regionale Entwicklung (EFRE) within the project COSIMA (“Combinatorisches Oxid-Screening für Materialien und Anwendungen”, SAB 100282338, SAB 100315366) and by Universität Leipzig in the framework of the research profile area “Complex Matter”. Cooperation within the Leibniz ScienceCampus GraFOx (“Growth and Fundamentals of Oxides”) is gratefully acknowledged.References
- Gallium Oxide: Crystal Growth, Materials Properties, and Devices, ed. M. Higashiwaki and S. Fujita, Springer, Cham, 2020 Search PubMed.
- E. Ahmadi and Y. Oshima, J. Appl. Phys., 2019, 126, 160901 Search PubMed.
- Y. Yao, S. Okur, L. A. M. Lyle, G. S. Tompa, T. Salagaj, N. Sbrockey, R. F. Davis and L. M. Porter, Mater. Res. Lett., 2018, 6, 268–275 Search PubMed.
- A. Hassa, C. Wouters, M. Kneiß, D. Splith, C. Sturm, H. von Wenckstern, M. Albrecht, M. Lorenz and M. Grundmann, J. Phys. D: Appl. Phys., 2020, 53, 485105 Search PubMed.
- Z. Cheng, M. Hanke, P. Vogt, O. Bierwagen and A. Trampert, Appl. Phys. Lett., 2017, 111, 162104 Search PubMed.
- R. Schewski, G. Wagner, M. Baldini, D. Gogova, Z. Galazka, T. Schulz, T. Remmele, T. Markurt, H. von Wenckstern, M. Grundmann, O. Bierwagen, P. Vogt and M. Albrecht, Appl. Phys. Express, 2015, 8, 011101 Search PubMed.
- R. Jinno, T. Uchida, K. Kaneko and S. Fujita, Appl. Phys. Express, 2016, 9, 071101 Search PubMed.
- M. Oda, K. Kaneko, S. Fujita and T. Hirota, Jpn. J. Appl. Phys., 2016, 55, 1202B4 Search PubMed.
- R. Jinno, T. Uchida, K. Kaneko and S. Fujita, Phys. Status Solidi B, 2018, 255, 1700326 Search PubMed.
- G. T. Dang, S. Sato, Y. Tagshira, T. Yasuoka, L. Liu and T. Kawaharamura, APL Mater., 2020, 8, 101101 Search PubMed.
- H. von Wenckstern, Adv. Electrode Mater., 2017, 3, 1600350 Search PubMed.
- H. von Wenckstern, D. Splith and M. Grundmann, Pulsed Laser Deposition of Ga2O3 and Related Alloys, in Gallium Oxide: Crystal Growth, Materials Properties, and Devices, ed. M. Higashiwaki, S. Fujita, Springer, Cham, 2020, pp. 273–291 Search PubMed.
- H. Peelaers, J. B. Varley, J. S. Speck and C. G. Van de Walle, Appl. Phys. Lett., 2018, 112, 242101 Search PubMed.
- M. Grundmann and M. Lorenz, Phys. Status Solidi B, 2021, 202100104 Search PubMed.
- The internal sample names are W4820 (Fig. 1a), W4671 (Fig. 1b, 3 and EDX maps) (grown at 750 °C) and A0076 (Fig. 2), A0082, A0080, A0086, A0085, and A0079 (Fig. 4) (1000 °C).
- M. Lorenz, Pulsed Laser Deposition, digital Encyclopedia of Applied Physics, Wiley-VCH, Weinheim, 2019, eap810 DOI:10.1002/3527600434.eap810.
- M. Lorenz, S. Hohenberger, E. Rose and M. Grundmann, Appl. Phys. Lett., 2018, 113, 231902 Search PubMed.
- M. Grundmann and M. Lorenz, APL Mater., 2020, 8, 021108 Search PubMed.
- M. Grundmann, T. Stralka and M. Lorenz, Appl. Phys. Lett., 2020, 117, 242102 Search PubMed.
- NCHR tip (non-contact/tapping mode, high resonance frequency, reflex Al coating) with a force constant of 42 N m−1, excitation frequency slightly above its resonance at 300 kHz.
- L. C. Briese, S. Selle, C. Patzig, J. Deubener and T. Höche, Ultramicroscopy, 2019, 205, 39–48 Search PubMed.
- Th. Höche, J. W. Gerlach and T. Petsch, Ultramicroscopy, 2006, 106, 981–985 Search PubMed.
- D. J. Gooch and G. W. Groves, J. Am. Ceram. Soc., 1972, 55, 105 Search PubMed.
- J. Castaing, J. Cadoz and S. Kirby, J. Phys., 1981 Search PubMed , 42 (Colloques C3), C3-43–C3-47.
- K. Peter, D. Lagerlöf, A. H. Heuer, J. Castaing and J. P. Rivière, J. Am. Ceram. Soc., 1994, 77, 385–397 Search PubMed.
- J. Castaing, A. Muñoz and A. Dominguez Rodriguez, Philos. Mag. A, 2002, 82, 1419–1431 Search PubMed.
- H. Komurasaki, T. Isono, T. Tsukamoto and T. Ogino, Appl. Surf. Sci., 2012, 258, 5666–5671 Search PubMed.
- S. E. Mason, C. R. Iceman, T. P. Trainor and A. M. Chaka, Phys. Rev. B, 2020, 81, 125423 Search PubMed.
- M. Grundmann, Appl. Phys. Lett., 2020, 116, 082104 Search PubMed.
- S. N. G. Chu, N. Chand, D. L. Sivco and A. T. Macrander, J. Appl. Phys., 1989, 65, 3838–3844 Search PubMed.
- Gaussian broadening of a step function would lead to an error function dependence which has shorter wings than the experimental data.
- The FWHM of the convolution of two broadening functions of type g from (1) with (positive) parameters γ1 and γ2 is given by FWHM(γ1,γ2) = 2χγ1[(1 +
![[small gamma, Greek, circumflex]](https://www.rsc.org/images/entities/i_char_e0b2.gif) 0.7/3)−1 +
0.7/3)−1 + ![[small gamma, Greek, circumflex]](https://www.rsc.org/images/entities/i_char_e0b2.gif) ] for
] for ![[small gamma, Greek, circumflex]](https://www.rsc.org/images/entities/i_char_e0b2.gif) = γ2/γ1 (and χ = (22/3 − 1)1/2 as defined in the text), with a maximum relative error of 0.4%. Within a maximum relative error of 0.5%, also FWHM(γ1,γ2) = FWHM(γ2,γ1).
= γ2/γ1 (and χ = (22/3 − 1)1/2 as defined in the text), with a maximum relative error of 0.4%. Within a maximum relative error of 0.5%, also FWHM(γ1,γ2) = FWHM(γ2,γ1). - H. W. Kim, H. Ko, X.-C. Chang and S. B. Cho, J. Eur. Ceram. Soc., 2021, 41, 611–6516 Search PubMed.
- From ref. 13 a fit with ΔH = 0.140 + 0.024x − 0.164x2 = 0.304(1 − x) − 0.164(1 − x)2 (in eV per cation) is obtained.
- M. Grundmann, Phys. Status Solidi B, 2020, 257, 2000323 Search PubMed.
- M. Grundmann, J. Appl. Phys., 2018, 124, 185302 Search PubMed.
- We obtain a fit to the strain energy density with ζ(x) = 1 + 0.90(1 − x) − 0.20(1 − x)2.
- A. Gomyo, T. Suzuki and S. Iijima, Phys. Rev. Lett., 1988, 60, 2645–2648 Search PubMed.
- P. M. Petroff, A. Y. Cho, F. K. Reinhart, A. C. Gossard and W. Wiegmann, Phys. Rev. Lett., 1982, 48(1082), 170–173 Search PubMed.
- M. E. Hoenk, C. W. Nieh, H. Z. Chen and K. J. Vahala, Appl. Phys. Lett., 1989, 55, 53–55 Search PubMed.
- T. S. Kuan, T. F. Kuech, W. I. Wang and E. L. Wilkie, Phys. Rev. Lett., 1985, 54, 201–204 Search PubMed.
- F. Léonard and R. C. Desai, Phys. Rev. B: Condens. Matter Mater. Phys., 1997, 56, 4955–4965 Search PubMed.
- I. P. Ipatova, V. G. Malyshkin, A. A. Maradudin, V. A. Shchukin and R. F. Wallis, Phys. Rev. B: Condens. Matter Mater. Phys., 1998, 57, 12968–12993 Search PubMed.
- R. C. Desai, H. Kim, A. Chatterji, D. Ngai, S. Chen and N. Yang, Phys. Rev. B: Condens. Matter Mater. Phys., 2010, 81, 235301 Search PubMed.
- P. Henoc, A. Izrael, M. Quillec and H. Launois, Appl. Phys. Lett., 1982, 40, 963–965 Search PubMed.
- A. N. Westmeyer and S. Mahajan, Appl. Phys. Lett., 2001, 79, 2710–2712 Search PubMed.
| This journal is © The Royal Society of Chemistry 2021 |

