 Open Access Article
Creative Commons Attribution 3.0 Unported Licence
Anti-GPC1-modified mesoporous silica nanoparticles as nanocarriers for combination therapy and targeting of PANC-1 cells†
Bianca Martins
Estevão
 *,
Edson José
Comparetti
,
Nathalia Cristina
Rissi
and
Valtencir
Zucolotto

Nanomedicine and Nanotoxicology Group, São Carlos Institute of Physics–University of São Paulo, São Carlos, Brazil. E-mail: estevaobm@usp.br
First published on 14th June 2021
Abstract
We present a novel therapeutic nanoplatform based on mesoporous silica nanoparticles encapsulating ferulic acid/gemcitabine and functionalized with anti-GPC1 antibodies to target human pancreatic cancer (PANC-1) cells. This dynamic nanoplatform has been designed for enhanced cellular selectivity and improved antitumor therapy. The well-ordered mesoporous silica nanoparticles were confirmed through structural and morphological analyses, which revealed nanoparticles with sizes in the range from 100 to 120 nm. X-ray diffraction analyses revealed an ordered hexagonal lattice with typical mesopores of the MCM41 material. The functionalization of silica nanoparticles with anti-GPC1 antibodies allowed the improved targeting and simultaneous delivery of gemcitabine and ferulic acid to PANC-1 cells. Our results showed that the combination therapy was more efficient than the use of isolated conventional drugs, increasing the effectiveness of MSNs on carcinogenic cells and opening the door for future in vivo studies.
Introduction
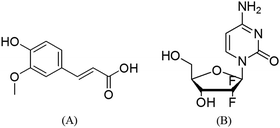
Pancreatic cancer corresponds to 3% of all neoplasms, being one of the most aggressive cancers causing 7% of total deaths in the world.1 Although therapeutic strategies regarding pancreatic cancer are well developed, including surgery, the increase in the death rate is related to the lack of symptoms, in that only 10–20% of tumors are able to be resected. Patients undergoing surgical intervention, however, have a 20–25% 5-year survival rate.2 Pancreatic ductal adenocarcinoma (PDAC) is the most common malignancy of the pancreas, originating from cells that cover the pancreatic ducts where the pancreatic juice is delivered to the duodenum. This is the most common and the most aggressive type of pancreatic cancer, accounting for about 80% of all pancreatic cancers.3 Other types, such as neuroendocrine tumors, are less aggressive and rarer. The aggressiveness of pancreatic cancer comes from its usual lymphatic dissemination (involving lymph nodes around the lesion) and also from being hematogenous (the dissemination of tumor cells to organs at a distance through the bloodstream).4Gemcitabine (Gem–Fig. 1B), commonly known as Gemzar®, is a very common chemotherapeutic drug for the treatment of breast, ovarian, non-small cell lung, pancreatic and bladder cancers.5 It was patented in 1983 and approved for medical use in 1995, and gemcitabine is among the most effective and safe anti-cancer drugs according to the World Health Organization's essential medicines list.6 Gem is a hydrophilic drug analogous to nucleosides and due to its structural conformation, this drug is transported by human equilibrative nucleoside transporter-1 (hENT1). Upon entering the cell, three phosphate groups are added to gemcitabine, making it pharmacologically active. Gemcitabine triphosphate is found in the “disguised” cytidine medium being incorporated into the new DNA strands during cell replication.7 Since gemcitabine is a “defective” base, its incorporation into DNA leads to the inhibition of further replication, leading to cell apoptosis.8 Gemcitabine exhibits severe and common side effects among anti-cancer drugs such as bone marrow suppression, kidney and liver problems, fever, nausea, allergies, shortness of breath and hair loss. Gemcitabine is usually used alone in the treatment of pancreatic cancer and is associated with other drugs for treating other types of cancers.9,10
Combination therapy, a treatment modality that combines two or more therapeutic agents, is the mainstay of cancer therapy as it is more effective than monotherapy11,12 because of the high resistance rates exhibited by anti-cancer drugs. A combination of anticancer drugs increases efficacy compared to monotherapies, being a key pathway for new synergistic drugs or additives.13 For example, pancreatic ductal adenocarcinoma cells present resistance to some drugs when administered alone. Fryer et al. reported that aggressive pancreatic cancer cells PANC-1 exhibited resistance when Gem is administered alone, reporting high signals of the enzymes responsible for nucleoside phosphorylation (pERK) outside the cell.14 Therefore, research on combined mechanisms and new drugs is important for better treatment efficacy.
Ferulic acid (FA–4-hydroxy-3-methoxycinnamic acid–Fig. 1A) belongs to the class of phenolic acids (hydroxycinnamic) found in vegetables and fruits, which exhibit antioxidant and antitumor activities, antimicrobial, anti-inflammatory, anti-thrombotic and anti-hypercholesterolemic effects.15–17 Recent studies show that the cytotoxic effects of FA on cancer cells are attributed to antioxidant properties, which are associated with its phenolic nucleus and unsaturated side chain.18 Bandugula et al. studied the effects of FA on non-small cell liver cancer and observed alterations in the expression of p53, p2, NF-κB, Bax and caspase-3, indicating an oxidative mechanism.19 Balakrishnan et al. reported the change in the modulation of the p53 effect on oral cancer cells using combined FA and curcumin.20 Wang et al. observed that FA inhibits proliferation and induces apoptosis through the inhibition of PI3K/Akt in osteosarcoma cells.21 Some studies also demonstrated the prognostic relevance of the p53 tumor suppressor protein for various types of tumors.22–25 When p53 is mutated with reduced/abolished functions, it is often linked to resistance to some standard drugs, including gemcitabine. In addition to gene therapy, which is very costly, treatments with small molecules, such as FA, can restore the conformation of the p53 protein and consequently re-construct its function in the cell.26
Nanoparticles have been successfully applied in cancer therapy, especially as nanocarriers encapsulating hydrophobic drugs for a controlled release, through which cancer cell targeting is efficient and side effects are minimized.27–30 Several types of nanoparticles have been used, both in cancer therapy and in diagnosis.31 Mesoporous silica nanoparticles (MSNs), in particular, show interesting structural characteristics, such as high surface areas and pore volumes, capable of accommodating large amounts of drugs, stability and compatibility in biological media, as well as adjustable pore sizes.32,33 The high density of silanol groups present on the silica nanoparticle surface, capable of being functionalized with different chemical groups, is one of the most important characteristics of mesoporous materials, making them promising nanomaterials for use in cancer therapy.
Recently, glypican-1 (GPC1) has been reported as a biomarker for pancreatic cancer.34,35 Melo et al. reported the presence of GPC1 in exosomes from cancer patients using mass spectroscopy. The authors found GPC1+ in 75% of breast cancer patients, whereas in the patients with PDAC, 100% exhibited significantly higher levels of GPC1+ controls.34
In this paper, we report the use of amino-functionalized mesoporous silica nanoparticles as effective vectors for ferulic acid and gemcitabine delivery as combined chemotherapy in human pancreatic cancer cells (PANC-1). PANC-1 targeting was achieved upon the functionalization of nanoparticles with anti-GPC1 antibodies.
Experimental
Materials
All reagents were used without further purification and the solutions were prepared using ultrapure water (Milli-Q, 18.2 MΩ cm). Cetyltrimethylammonium bromide (CTAB), sodium hydroxide (NaOH), tetraethoxysilane (TEOS), 3-aminopropyltriethoxysilane (APTES), ferulic acid (FA), N-3-dimethylaminopropyl-N′-ethylcarbodiimide-1 (EDC), N-hydroxysuccinimide-1 (NHS), gemcitabine hydrochloride (Gem) and 3-[4,5-dimethyl-thiazol-2-yl]-2,5-diphenyltetrazolium bromide (MTT) were purchased from Sigma-Aldrich. Isopropyl alcohol, hydrochloric acid (HCl) and dimethylformamide (DMF) were obtained from Synth. Anti-GPC1 antibodies were acquired from Interprise. DMEM culture medium was obtained from Vitrocell Embriolife. Annexin V labeled with phycoerythrin (PE) and actinomycin D (7AAD) labeled with peridinin–chlorophyll–protein (PerCP) were purchased from BD Biosciences.Synthesis of amino-functionalized mesoporous silica nanoparticles (MSN-NH2)
Amino-functionalized mesoporous silica (MSNs-NH2) nanoparticles were prepared according to literature36 procedures using cetyltrimethylammonium bromide (CTAB) as a model agent directing the pore structure geometry. CTAB (1.9 mmol) was first dissolved in 340 mL of distilled water. An aqueous solution of NaOH (2.0 M, v = 2.45 mL) was added to the CTAB solution at 80 °C. Finally, tetraethoxysilane (TEOS, v = 3.5 mL in 18.1 mmol) and 3-aminopropyltriethoxysilane (APTES, v = 0.43 mL in 2.04 mmol) were added dropwise simultaneously to the solution for 4 minutes. The mixture was stirred at 80 °C for 2 hours, resulting in a white precipitate (MSN-NH2 + CTAB). The solid product was filtered, washed with deionized water and ethanol, and allowed to dry in an oven at 60 °C. CTAB was removed by extraction using a Soxhlet extractor with isopropyl alcohol/HCl for 96 hours at 200 °C, only for MSN-NH2 and MSN-Gem. The nanoparticle pattern MCM-41 was synthesized using a methodology described in the literature.36Covalent conjugation of ferulic acid in MSN-NH2 and encapsulation of Gem in MSNs-NH2 and MSNs-FA
MSN-NH2/CTAB was first dispersed in 15 mL of DMF (N,N-dimethylformamide) and sonicated for 15 minutes. For the FA covalent bond, a solution of DMF (15 mL) containing ferulic acid (1 molar equiv.), EDC (N-(3-dimethylaminopropyl)-N′-ethylcarbodiimide-1 molar equiv.) and NHS (N-hydroxysuccinimide-1 molar equiv.) was added to the MSN-NH2 dispersion and stirred vigorously for 24 hours at room temperature, protected from light. The hybrid solid was filtered and dried under vacuum. MSN-FA was washed with DMF to remove the unreacted FA molecules. Finally, MSNs-FA was subjected to extraction of the surfactant, to empty the pores, using Soxhlet isopropyl alcohol/HCl for 4 days. Three MSN-NH2 containing FA materials (labeled as MSNs-FA) were prepared following an increase in the FA load in the range of 0.9–26 mg g−1, related to the molar amount of NH2 bound to the outer and inner surfaces of the nanoparticles. The actual FA loading (Table 1) was calculated from the UV–vis spectrum of the FA eluate after the washing procedure using the Lambert–Beer law (ε325 = 4.5 × 10⁴ L mol−1 cm−1 in DMF estimated from the slope of the absorption curve).| Samples | Nominal FA mass (mg/100 mg) | Real FA mass (mg/100 mg) | Functionalization efficiency (%) | Molecules/NP (104) |
|---|---|---|---|---|
| MSNs-FA0.9 | 0.9 | 0.72 | 80 | 4.4 |
| MSNs-FA2.6 | 2.6 | 1.54 | 59 | 9.4 |
| MSNs-FA26 | 26 | 20.1 | 77 | 122.8 |
| MSNs-Gem | 1.0 | 0.34 | 34 | 2.8 |
| MSNs-FA0.9–Gem | 1.0 | 0.30 | 30 | 2.5 |
| MSNs-FA2.6–Gem | 1.0 | 0.34 | 34 | 2.8 |
| MSNs-FA26–Gem | 1.0 | 0.22 | 22 | 1.8 |
Gem encapsulation in MSN-NH2 and MSN-FA was performed by adsorption. MSN-NH2 and MSNs-FA (100 mg) were added to synthesis flasks and suspended in water at pH 7. The suspensions were kept in an ultrasonic bath for 20 minutes and then 1 mg of Gem was added to each flask. The blends were left in contact for 24 hours at room temperature under stirring and protected from light. The encapsulation was calculated from the UV–vis spectrum of the Gem eluate after the washing procedure using the Lambert–Beer law (ε268 = 1.104 × 10⁴ L mol−1 cm−1 in water estimated from the slope of the curve–Table 1).
Incorporation of anti-GPC1 antibodies on the surface of the nanoparticles
Selected samples (MSNs, MSNs-Gem and MSNs-FA2.6–Gem, 0.05 mg) were suspended in PBS buffer at 4 °C and sonicated for 15 minutes. 0.1 mg of EDC and NHS were added to the dispersion of silica nanoparticles along with 20 μg of anti-GPC1 antibodies. The reaction was kept in an ice bath for 6 hours. Finally, the silica nanoparticles were centrifuged at 10![[thin space (1/6-em)]](https://www.rsc.org/images/entities/char_2009.gif) 000 rpm for 30 minutes at 4 °C to remove the protein and excess reactants. The nanoparticles were resuspended in PBS at 4 °C for further assays.
000 rpm for 30 minutes at 4 °C to remove the protein and excess reactants. The nanoparticles were resuspended in PBS at 4 °C for further assays.
MSN characterization methodologies
X-ray diffraction patterns (XRD) were obtained using a Bruker D8 Advanced diffractometer with Cu Kα radiation (λ = 1.54062 Å). High-resolution transmission electron microscopy (HR-TEM) images were collected using a JEM 2100 JEOL electron microscope operating at 200 kV. The samples were prepared by sonication in isopropanol and adding a few drops of the suspension into the carbon coated nets. Scanning electron microscopy was performed with a SEM-ZEISS brand and the SIGMA model equipped with a field emission electron gun (MEV-FEG).Dynamic light scattering (DLS) and zeta potential measurements were performed at 25 °C with nanoparticles dispersed in aqueous solution using a Malvern Zetasizer Nano-ZS, which uses a 4 mW He–Ne laser operating at 633 nm at an angle of detection of 173°. The suspensions of 10 μg ml−1 of each material were prepared in deionized water and measured after 15 minutes of sonication.
Thermogravimetric analysis (TGA) were performed under a nitrogen flow (100 mL min−1) using a Shimadzu TGA-50 thermocouple instrument. The readings were made by heating from 40 to 800 °C with a 5 °C min−1 ramp. Infrared spectra of KBr pellets (1 mg sample to 80 mg KBr) were collected using a Nicolet 6700/GRAMS Suite spectrometer with a resolution of 3 cm−1 and 128 scans.
The physisorption measurements (N2) were performed at 77 K in the relative pressure range of 1 × 10⁻⁶ to 1 P/P0 using a Quantachrome Autosorb1MP/TCD instrument. Prior to analysis, the samples were degassed at 373 K for 3 hours (a residual pressure of less than 10−6 Torr). The specific surface areas were determined using the Brunauer–Emmett–Teller (BET) equation in the relative pressure range of 0.01–0.1 P/P0. The desorption step of the physisorption isotherm was analyzed using the non-local density functional theory (NLDFT) to obtain the distribution of the pore size of the material.
Diffuse reflectance–UV–vis (DR–UV–vis) spectra were recorded using a PerkinElmer Lambda 900 spectrometer equipped with a diffuse reflectance sphere.
Stability of mesoporous silica nanoparticles in DMEM containing 10% FBS
In this experiment, 1 mg of the following nanoparticles MSNs-Gem, MSNs-FA0.9–Gem, MSNs-FA2.6–Gem and MSNs-FA26–Gem was added in 1 mL of DMEM containing 10% FBS and incubated at 37 °C under orbital agitation for 2, 6 and 24 hours. The nanocomposites were centrifuged twice and washed with deionized water. The materials were resuspended in 1 mL of deionized water and analyzed using UV–vis absorption, DLS and zeta potential measurements.Gemcitabine release
The release assays were performed in PBS at pH 7.4, with 1 mg of each nanoparticle added into 1 mL of PBS. All samples were placed under magnetic stirring at 37 °C for 2, 6 and 24 hours. The nanoparticles were then centrifuged at 10![[thin space (1/6-em)]](https://www.rsc.org/images/entities/char_2009.gif) 000 rpm for 15 minutes, and the supernatant was analyzed using UV–vis absorption.
000 rpm for 15 minutes, and the supernatant was analyzed using UV–vis absorption.
Cell culture
Human pancreatic cancer cell lines (PANC-1) and hepatic stem cell lines (HEPA-RG) were purchased from Rio de Janeiro Cell Bank and were cultured in DMEM (Dulbecco's modified Eagle's medium) complete medium (supplemented with 10% fetal bovine serum and 200 μM L-glutamine) at 37 °C under a tension of 5% CO2, until the formation of a cell monolayer. The cells were detached from the surface of the bottles using 0.05% trypsin, washed in complete medium and re-suspended in DMEM. The experiments were carried out with a minimum of 90% cell viability.Cytotoxicity assays (MTT)
The interaction of nanoparticles with cells was first assessed using the MTT (3-[4,5-dimethyl-thiazol-2-yl]-2,5-diphenyltetrazolium bromide) colorimetric assay and the mitochondrial metabolism that reflects the activity of living cells was measured.37 The treatment was performed by adding the nanoparticles and chemotherapeutic drugs in flat-bottom plates of 96 wells (1 × 10⁴ cells per well) for 6 and 24 hours. The tested groups were: (a) pure silica; (b) silica conjugated to ferulic acid; (c) silica combined with gemcitabine; (d) gemcitabine-modified silica and ferulic acid; (e) silica conjugated to gemcitabine, ferulic acid, and anti-glypican-1 antibody (GPC1); and (f) only gemcitabine and ferulic acid drugs. As a positive control (maximal lysis), the cells were incubated with DMSO. At the end of the exposure period, the medium was discarded, and the living cells adhered on the plate were incubated with MTT solution (0.1 mg ml−1 dissolved in DMEM free of phenol) for 3 h at 37 °C. Thereafter, the supernatant was removed, and formazan crystals were solubilized with DMSO for further spectrophotometer readings at 570 nm. Cell viability was calculated as the mean of the optical density of three replicates.Flow cytometry
The cytotoxicity of nanoparticles was confirmed by flow cytometry using the concentration of 5 μg ml−1 of silica for every 1 × 10⁵ cells. The tumor cells were cultured in 12-well plates and subjected to different treatments. After 24 hours of incubation, the suspended particles and cell debris were removed by gentle washing with the culture medium. The cells were collected and centrifuged at 10![[thin space (1/6-em)]](https://www.rsc.org/images/entities/char_2009.gif) 000 rpm for 30 sec, resuspended in isoton (PBS containing 0.5% BSA) and incubated for 20 minutes at room temperature with annexin V. Subsequently, the cells were collected in polystyrene tubes and labeled with 7-amino actinomycin D (7AAD) for acquisition on a flow cytometer. Labeled with phycoerythrin (PE), annexin-V has an affinity for phospholipids from the inner face of the cell membrane.38 The cells in apoptosis expose these phospholipids in the external face, allowing the connection with annexin for quantifying the apoptotic cells. In the assay, we combine 7AAD, whose fluorescence intensity is identified at another wavelength. This product penetrates the cells that undergo osmotic lysis through the pores formed on the surface, representing the cells that have undergone necrosis. The combination of annexin-V and 7AAD followed by the flow cytometer analysis allows the quantification of apoptosis (annexin-V+) and dead cells (7AAD+/annexin V+ and 7AAD+/annexin V−).
000 rpm for 30 sec, resuspended in isoton (PBS containing 0.5% BSA) and incubated for 20 minutes at room temperature with annexin V. Subsequently, the cells were collected in polystyrene tubes and labeled with 7-amino actinomycin D (7AAD) for acquisition on a flow cytometer. Labeled with phycoerythrin (PE), annexin-V has an affinity for phospholipids from the inner face of the cell membrane.38 The cells in apoptosis expose these phospholipids in the external face, allowing the connection with annexin for quantifying the apoptotic cells. In the assay, we combine 7AAD, whose fluorescence intensity is identified at another wavelength. This product penetrates the cells that undergo osmotic lysis through the pores formed on the surface, representing the cells that have undergone necrosis. The combination of annexin-V and 7AAD followed by the flow cytometer analysis allows the quantification of apoptosis (annexin-V+) and dead cells (7AAD+/annexin V+ and 7AAD+/annexin V−).
Statistical analysis
The tests involving cells were subjected to ANOVA and followed by Tukey–Kramer averages comparison test, considering differences with an error probability less than or equal to 5% (α ≤ 0.05). All functional assays were repeated at least 3 times.Results and discussion
Mesoporous silica nanoparticles (MSNs) were functionalized with APTES (MSNs-NH2) via a “one-pot” methodology. Ferulic acid was covalently bound to the amino groups of nanoparticles as shown in Fig. 2 and three MSNs-FA samples with different concentrations of FA were synthesized. Gemcitabine was adsorbed on MSNs-FA, resulting in a theranostic nanoparticle.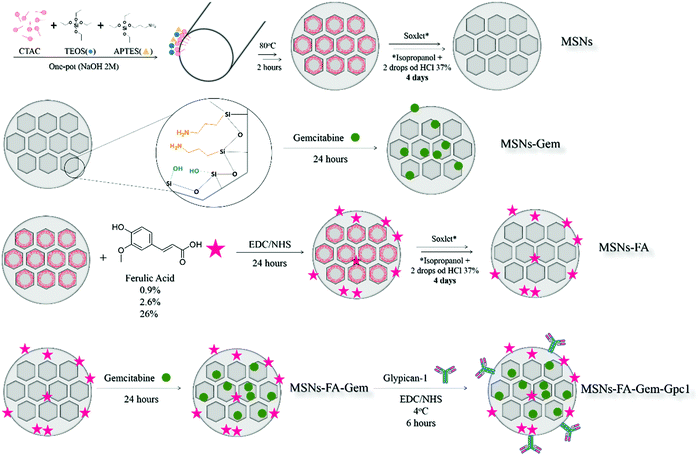 | ||
| Fig. 2 Schematic representation of the synthesis and nanoparticle architectures used to obtain MSNs. | ||
To evaluate the actual FA loads (Table 1), all samples were washed several times to remove the unreacted molecules and their eluates were analyzed using UV–vis absorption.
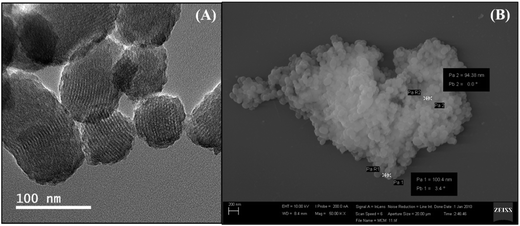
The average number of FA and Gem molecules per nanoparticle was calculated by considering the density of mesoporous silica nanoparticles and the mean particle size (Table 1). HR-TEM and SEM analyses (Fig. 3) showed that mesoporous particles are nanostructured and well-ordered and the particle sizes are in the range of 80–120 nm.39 The DLS results from the mesoporous nanoparticles after the post-synthetic procedures used to introduce the surface and Gem molecules into the mesopores are shown in Table 2 along with the zeta potential.
| Nanoparticles | Size (nm) | Zeta potential ζ (mV) |
|---|---|---|
| MCM41 | 182 ± 20 | −17 ± 5 |
| MSNs-NH2 | 179 ± 24 | 36 ± 5 |
| MSNs-FA0.9 | 171 ± 25 | 39 ± 8 |
| MSNs-FA2.6 | 190 ± 3 | 29 ± 6 |
| MSNs-FA26 | 211 ± 33 | 26 ± 6 |
| MSNs-Gem | 207 ± 30 | 33 ± 4 |
| MSNs-FA0.9–Gem | 204 ± 29 | 35 ± 6 |
| MSNs-FA2.6–Gem | 161 ± 19 | 35 ± 8 |
| MSNs-FA26–Gem | 206 ± 29 | 16 ± 8 |
The nanoparticle sizes revealed by DLS were slightly higher than those observed by HR-TEM. This is due to the formation of the double electric layer in the nanoparticle, revealing larger nanoparticles. The zeta potential was negative for the MCM41 since they only have silane groups, and positive for the others due to the presence of amino groups.40
All MSNs containing FA and Gem were characterized by XRD to elucidate the structural modification of mesoporous nanoparticles. Fig. 4 presents the MSNs (MCM-41) and MSNs-NH2 diffractograms after CTAB removal and those of MSNs-FA with different concentrations and MSNs-FA–Gem. All diffractograms showed a typical X-ray diffraction pattern around 0–3° of an ordered hexagonal lattice with typical mesopores of the MCM41 material with reflections (100), (110), (200) and (210) (the latter being only partially resolved), the characteristics of plane directions of p6mm spatial groups (space, geometry and periodicity, respectively). It is worth mentioning that, after the second drug insertion, there was a decrease of the pore order with the less expressive values of standards of 110 and 200.41 Although presenting cluttered walls, the pores are well defined by Bragg's Law with a typical hexagonal pattern from 3 to 6 nm.42,43
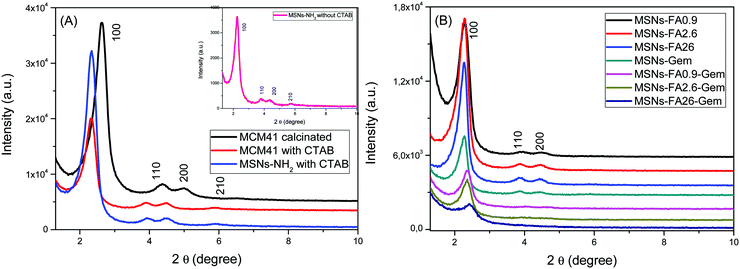 | ||
| Fig. 4 (A) XRD of the standard nanoparticles MCM41 and MSNs-NH2 before and after CTAB removal and (B) XRD of MSNs-FA with different loads of FA and Gem. | ||
The covalent chemical interaction between FA and MSNs-NH2 was also confirmed using FTIR spectroscopy (Fig. S1A and B, ESI†) by the presence of the band at 1385 cm−1, assigned to the stretching mode of CN II44 amide, and by the bands at 1629 and 1600 cm−1 from C![[double bond, length as m-dash]](https://www.rsc.org/images/entities/char_e001.gif) O and NH bonds, respectively. Bands in the range of 1500–1400 cm−1 are assigned to the deformations of the –CH2 group as well as to the stretching at 2925 cm−1.
O and NH bonds, respectively. Bands in the range of 1500–1400 cm−1 are assigned to the deformations of the –CH2 group as well as to the stretching at 2925 cm−1.
The thermogravimetric analysis provided information on thermal stability as well as on the organic components of the system. Fig. 5A and B exhibit the TGA curves of all samples. The DTA curves of the calcined nanoparticles are displayed in Fig. S2A and B.
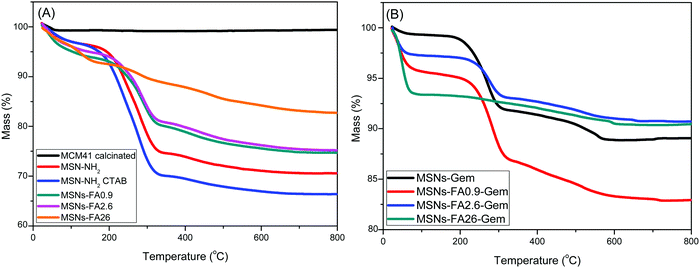 | ||
| Fig. 5 TGA (A and B) curves of MCM41, MSNs-NH2 with and without CTAB, MSNs-FA (0.9–26%) with and without CTAB and MSNs-FA (0.9–26%) with Gem. | ||
Since extraction with the Soxhlet method does not completely eliminate the surfactant, it was possible to estimate the fraction of CTAB that remained in the samples by comparing the TGA/DTA curves (Fig. 5A and Fig. S2A, ESI†). The first mass loss occurred between 30 °C and 180 °C and was associated with the removal of physisorbed water.45 The amount of water desorbed in all samples is similar, suggesting that the functionalization did not affect drastically the hydrophilicity of the samples. It was observed that for the MSNs-FA26 and MSNs-FA26-Gem samples, the TGA profiles were distinct. It is known that silica can be used as a catalyst leading to structure degradation. The latter can be observed in the TGA results and also confirmed by porosimetry, in which changes of state and physical–chemical characteristics are observed in relation to the high concentration of FA.
The literature reports the degradation products that can be generated from FA, such as vanillin, vanillic acid, 4-vinylguaiacal, etc.46 At higher temperatures, the nanoparticles exhibit different mass loss profiles. A flat tendency is initially observed with a rapid decline, evidencing a rapid decomposition of the organic part. DTA curves (Fig. S2A and B, ESI†) show two regions, in which decomposition occurs: a first region between 180 °C and 400 °C in which CTAB decomposes, as it can be seen by the loss of mass from MSNs-NH2 containing CTAB, even the one subjected to the solvent extraction. In this region, there is no significant mass loss for the calcined MCM41. In addition, it can be observed that the higher the FA mass inserted (Fig. S2A and B, ESI†), the smaller the amount of the remaining CTAB in the nanoparticle. This shows that there is a competition for the pores and FA, covalently attached, and removes the remaining surfactant.47 The second mass loss region is related to organic moieties (organic groups –(CH2)3–NH2,) and occurs between 400 and 800 °C. A small mass loss in the standard nanoparticles (MSNs without organic groups) also occurs due to the dehydroxylation of the Si–OH surface groups.47 Above 400 °C, the TGA curves from functionalized nanoparticles differ: MSNs-FA–Gem present a major mass loss around 450 °C (relative to -(CH2)3–NH2) followed by gradual losses related to gemcitabine, which varies according to the concentration of FA inserted in the nanoparticles. The differences between the latter profiles may indicate different stabilities of organic moieties due to different locations and/or surface bonds. During the synthesis, some organic groups have been incorporated into the silica wall, forming a less ordered, stable structure.
The low-temperature BET isotherms of the FA functionalized nanoparticles are shown in Fig. S3 (ESI†) and Table 3 along with the standard nanoparticles MCM41, MSNs-NH2 with and without CTAB for comparison.
| Samples | Pore volume Vt (cc g−1) | Surface area SSBET (m2 g−1) | Pore size WKJS (nm) |
|---|---|---|---|
| V t = quantity of N2 adsorbed at P/P0 = 0.98. SBET = obtained from the adsorption data at 0.05 <P/P0 < 0.2. wKJS = calculated by the KJS method. | |||
| MCM41 calcined | 0.924 | 1238 | 3.41 |
| MSNs-NH2 CTAB | 0.156 | 192.3 | 2.61 |
| MSNs-NH2 | 0.194 | 259.6 | 2.61 |
| MSNs-FA0.9 | 0.311 | 402.9 | 3.13 |
| MSNs-FA2.6 | 0.371 | 527.1 | 3.27 |
| MSNs-FA26 | 1.003 | 1151 | 3.66 |
| MSNs-Gem | 0.144 | 83.88 | 3.28 |
| MSNs-FA0.9–Gem | 0.169 | 78.38 | 2.33 |
| MSNs-FA2.6–Gem | 0.077 | 38.38 | 2.19 |
| MSNs-FA26–Gem | 0.460 | 408.1 | 5.66 |
The MCM41 standard nanoparticle presented a type IV isotherm and a mesoporous material pattern: the P/P0 intermediate slope (below 0.4) indicates the capillary condensation of nitrogen within the mesopores. As for those modified with NH2 and FA, the hysteresis cycle shifts upwards (type H1, P/P0:0.50) and becomes wider, indicating a smaller homogeneous distribution of the pores, besides a lower volume.48 The comparison of all curves (Fig. S3A, ESI†) clearly shows that the specific surface area decreases, being the largest for MCM41 and the smallest for MSNs-NH2 with CTAB (see Table 3). The low hysteresis cycle around P/P0 = 0.50 is compatible with the cartridge pores, suggesting that some pores have restricted access, probably due to the presence of functional groups at the entrance as well as the presence of CTAB.49 The samples show decreasing capillarity, a barrier related to the presence of surfactant inside the pores, as can be seen in the surface area and pore volume values in Table 3. These results corroborate with those obtained by TGA and FT-IR analyses. Upon template extraction, an increase in surface area can be observed in the MSNs-NH2 samples as well as after the modification with FA. Upon ferulic acid insertion, CTAB is forced out of the pores as reported by Gianotti et al.50 FA is present in the structure as observed using DR–UV–vis, thus proving the output of CTAB. With the aim of covering the whole area of the nanoparticle with FA, MSNs-FA26–Gem was shown to have a high surface area, and the pores were slightly smaller than the standard probably because of deformations of the pore wall due to possible catalytic effects. When gemcitabine was encapsulated, the texture profiles showed an isothermal profile close to type II, characterized by a nonporous or macroporous material, with a monolayer–multilayer profile, with the exception of MSNs-FA26–Gem. In this case, after Gem adsorption, the pores are obstructed by the drug, decreasing all textured profiles.48 In general, we observe the incorporation of both molecules, highlighting the structural modification of MSMs-FA26–Gem, due to the already fragile structure also observed by XRD.
The optical absorption of the nanoparticles encapsulating Gem and FA was investigated via UV–vis and DR–UV–vis spectra and compared to pure FA and Gem solutions (Fig. 6).
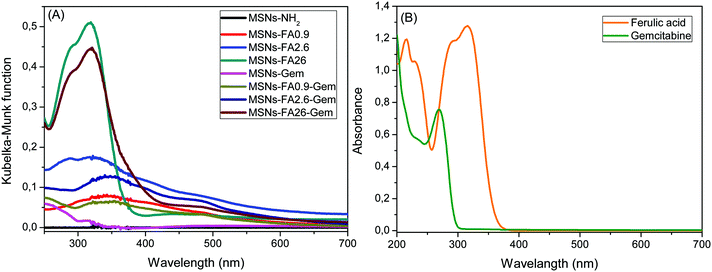 | ||
| Fig. 6 (A) DR–UV–vis spectra of all MSNs and (B) UV–vis absorption of FA and Gem in DMF and aqueous solution, respectively. | ||
The FA solution concentration was 3.4 × 10⁻⁶ mol L−1 and its maximum absorption occurred at 320 nm with one shoulder at 284 nm. When the surface was modified with 0.9% FA, the maximum absorption band is shifted to 344 nm. This bathochromic shift occurs when the molecules are in a different chemical environment.51 For the other modifications, 2.6 and 26%, with high concentrations of FA on the surface of the nanoparticle, the molecules exhibited bulk characteristics, due to their proximity to the external environment. Incorporation of Gem was revealed by its absorption band at 250 nm, as observed for MSNs-Gem and MSNs-FA0.9–Gem absorption curves.
The nanoparticle stability in the DMEM culture medium was also investigated. The MSNs-Gem, MSNs-FA2.6, MSNs-FA2.6–Gem nanoparticles and the pure MSN-NH2 nanoparticles were incubated for 2, 6 and 24 hours at 37 °C in an orbital shaker at 3000 rpm. Following this, the nanoparticles were centrifuged at 10![[thin space (1/6-em)]](https://www.rsc.org/images/entities/char_2009.gif) 000 rpm for 15 minutes, the supernatant was removed, and the pellet was resuspended with deionized water. The size and zeta potential analyses are shown in Fig. 7.
000 rpm for 15 minutes, the supernatant was removed, and the pellet was resuspended with deionized water. The size and zeta potential analyses are shown in Fig. 7.
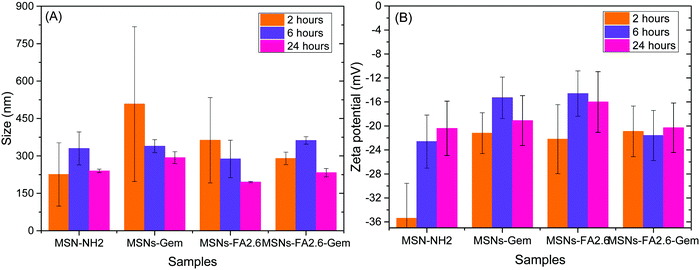 | ||
| Fig. 7 Size and zeta potential of MSN-NH2, MSNs-Gem, MSNs-FA2.6, and MSNs-FA2.6–Gem concealed after 2, 6 and 24 hours in DMEM 10% FBS. | ||
The size of the nanoparticles increases in cell culture media due to the adsorption of serum proteins (protein corona formation) and agglomeration due to ionic strength.52 It is observed that both phenomena start simultaneously as the nanoparticles are exposed to medium as it may be observed upon 2 hours of incubation. Higher polydispersity values were observed, due to the presence of both factors explained previously, presenting some nanoparticle aggregates. After 6 hours, it is possible to confirm a greater stability of the nanoparticles with decreased polydispersity, with the predominance of protein corona formation. After 24 hours in contact with DMEM 10% FBS, the hydrodynamic radius of the nanoparticles decreases and became homogeneous.53,54 The mesoporous silica nanoparticles showed a desorption of excess protein.55 Compared with the size and zeta potential results of the same nanoparticles in water (Table 2), it is clear that the protein adsorption increased the size of the nanoparticles due to formation of the protein corona and also due to the inversion of zeta potential values.56 This stability is important for biological applications, especially to avoid aggregation.
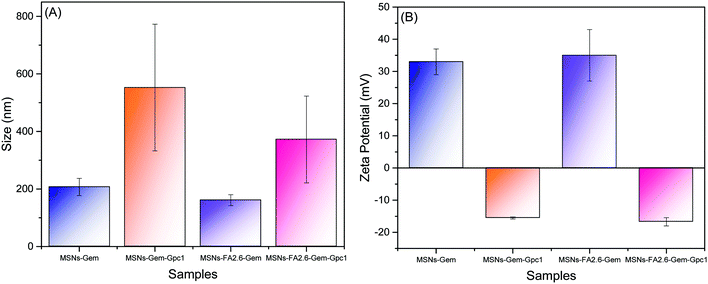
Functionalization with anti-GPC1 antibodies was revealed by the increase in the average size of the nanoparticles, in comparison to the nanoparticles without functionalization, as shown in Fig. 7. This modification was also confirmed by DLS and zeta potential measurements as shown in Fig. 8.
In comparison to the hydrodynamic diameters obtained from nanoparticles without the antibody (MSNs-Gem with 207.4 nm and MSNs-FA2.6–Gem with 160.8), the nanoparticle diameters became larger after the insertion of anti-GPC-1 as shown in Fig. 8 (552.5 nm for MSNs-Gem–GPC1 and 372.3 nm for MSNs-FA2.6–Gem–GPC1). In addition, there was a reversal of the zeta potential with the presence of anti-GPC1 to negative values, as shown in Fig. 7B. Together, these data confirm that the surface modification of the nanoparticles/FA/Gem with anti-GPC1 occurred. Similar results could be observed by Chen et al. for the functionalized Cu–NOTA–mSiO2–PEG nanoparticle with TRC105 antibodies.57
As far as targeting and delivery are concerned, estimation of the release profile of chemotherapies from the nanoencapsulated systems at different pH values is very important, since cancer and healthy cells are found in different environments. The Gem release curves from MSNs are shown in Fig. 9.
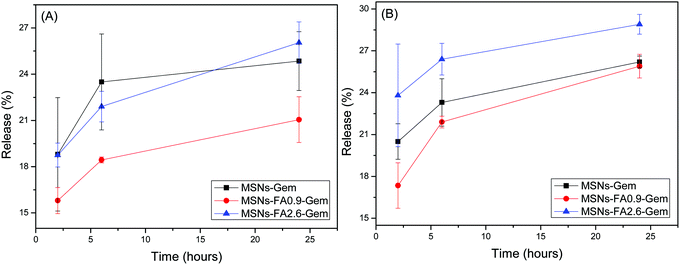 | ||
| Fig. 9 Formulation release profiles: MSNs-Gem, MSNs-FA0.9–Gem and MSNs-FA2.6–Gem at 37 °C in 2, 6 and 24 hours (A) is at pH 5.5 and (B) at pH 7.4. | ||
As shown in Fig. 9A, mesoporous silica nanoparticles without superficial modification (containing only gemcitabine) presented a higher content release at pH 5.5. This is expected since this nanoparticle has no surface modification to block the drug release. In the case of MSNs-FA0.9–Gem and MSNs-FA2.6–Gem, Gem was more confined within the pores and protected by ferulic acid from the surface.58 It is worth noting that the release profiles for all samples were similar under both physiological and acidic conditions.59 Low release indicates that the drug is protected inside the pores of the nanoparticles. It should be pointed out that this class of nanoparticles, derived from MCM-41, can be phagocytosed by the cells, presenting a better therapeutic effect.60
Upon simple surface modifications, silica mesoporous nanoparticles are capable of enhancing antitumor therapy and cellular selectivity in the organism,61 reaching the cytoplasm by endocytic mechanisms.62 However, when the drug molecules enter into diseased cells, transporter proteins often eject cytotoxic molecules as a mechanism of resistance.63 In this regard, it was demonstrated that silica nanoparticles loaded with gemcitabine lead to controlled release64 by the fusion of endosomes (pH 7.4) with lysosomes (phagolysosomes), promoting pH reduction (pH 4.8) and drug release in the cytoplasm.62
Upon assessing nanocomposite activity over cell proliferation, we determined the IC50 values for all nano-encapsulated silica NPs developed using MTT assays. Pancreatic cancer cells (PANC-1) and normal hepatic cells (HEPA-RG) were incubated with silica experimental groups in 96-well plates for 6 hours and 24 hours. After incubation with NPs, the IC50 value was determined from the triplicate experiments. We observe a dose-dependent reduction (0–100 μg ml−1) in the mitochondrial function, with pure silica NPs (MSNs) revealing low toxicity in both cell lines (Fig. S4A and S5A, ESI†).
Occasionally, novel modalities of treatments combine two or more drugs to decrease disease relapse. Nanoparticles carrying such chemotherapeutic agents may also regulate immune-suppressed host defense cells to restore pro-inflammatory responses, reducing the viability of angiogenic cells in the tumor microenvironment.65 The simultaneous administration of Gem and albumin particles loaded with paclitaxel (nab-paclitaxel), for example, improved pancreatic cancer therapy in the clinic.66 Here, we chose ferulic acid to act simultaneously with Gem for its antioxidant properties and antineoplastic activity, inducing cell cycle arrest and the expression of apoptosis genes.67
Both molecules (Gem and FA) exhibited cytotoxicity above 0.1 μM in pancreatic cancer cells.67,68 The combination of low doses of Gem and FA resulted in lower IC50 values, revealing the advantage of using a combined therapy in comparison to the isolated drug molecules. MSNs improved drug delivery in neoplastic cells and is suggested to be more effective than isolated molecules, reducing PANC-1 proliferation better than in HEPA–RG, (as shown in Fig. S6, ESI†). Although MSNs-FA2.6–Gem activity was similar to MSNs-Gem, they are more toxic than MSNs-FA in the period of 24 h (Table 4). This can be explained by the replacement of chemotherapeutics by FA inside the nanoparticle as we increase the concentration of antioxidant molecules. It reduces the delivery of antineoplastic agents and cell death, as revealed by a significant increase of the IC50 value of the MSNs-FA26–Gem group in 6 h.
| PANC-1 | HEPA-RG | |||
|---|---|---|---|---|
| 06 h | 24 h | 06 h | 24 h | |
| MSN-NH2 | 79.4 | 100 | 94.1 | 35.7 |
| MSNs-FA2.6 | 75.8 | 20.4 | >100 | 35.7 |
| MSNs-Gem | 34.6 | 14.8 | 52.9 | 14.9 |
| MSNs-FA0.9–Gem | 31.62 | 9.16 | 56.3 | 14.5 |
| MSNs-FA2.6–Gem | 34.7 | 14.8 | 79.5 | 17.8 |
| MSNs-FA26–Gem | 95.5 | 41.57 | >100 | 77.62 |
Mean from three independent experiments
The capture of nanocarriers by healthy cells remains the main barrier to improve the therapeutic efficacy of silica nanoparticles. MSNs modified with monoclonal antibodies and aptamers allow the addressing of therapeutic agents to target cells, minimizing the drug delivery across normal tissues.29 In the present study, we investigated the transport of drug molecules by silica nanoparticles by testing their specificity and effectiveness to pancreatic cancer cells incorporating anti-glypican-1 (GPC1) antibody. PANC-1 and HEPA cells were incubated with MSNs-Gem and MSNs-FA2.6–Gem functionalized or not with anti-GPC1 antibodies. The antibody-conjugated nanoparticles were more efficient at inhibiting pancreatic cancer cell growth than MSNs-FA2.6–Gem as shown in Fig. 10, exhibiting a significant cytotoxicity to neoplastic cells after 24 h. No statistical difference was observed among the treatments in the cell lines that do not express glypican-1 (HEPA-RG). MSNs-Gem and MSNs-Gem–anti-GPC1 were equally toxic to PANC-1, indicating that the monoclonal antibody did not improve the Gem antitumor activity against the pancreatic cancer cells. The opposite was observed for nanoparticles containing FA. As shown in Fig. 10A, anti-GPC1 functionalized nanoparticles (MSNs-FA2.6–Gem–anti-GPC1) exhibited low cell viability compared to the same nanoparticles without anti-GPC1 functionalization (MSNs-FA2.6–Gem). This indicates that antioxidant molecules enhanced the gemcitabine effects, corroborating the previous results from the study by Ju et al.69 This correlates the role of antioxidant mechanisms in pancreatic tumor cells resistant to gemcitabine applications.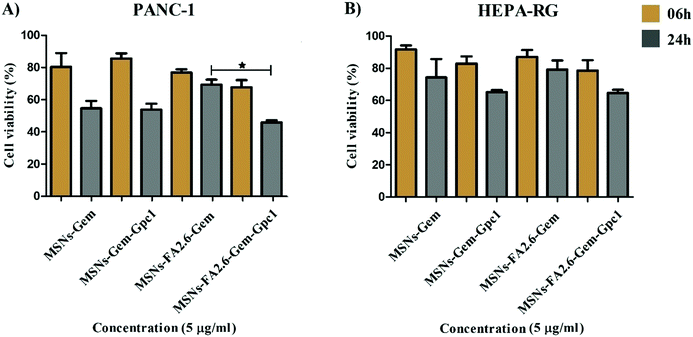 | ||
| Fig. 10 MTT assay performed in PANC-1 and HEPA-RG cell lines (104 cells per well) in the presence and absence of anti-glypican-1 antibody in MSNs (5 μg ml−1). | ||
HEPA–RG is a human hepatic cell line that does not express the glypican-1 antigen; thus, we expected the absence of MSNs-FA2.6–Gem–Gpc1 cytotoxicity. However, particles conjugated with anti-GPC-1 exhibited a higher activity after 24 h but still without statistical significance between MSNs-Gem and MSNs-FA2.6–Gem groups (Fig. 10B).
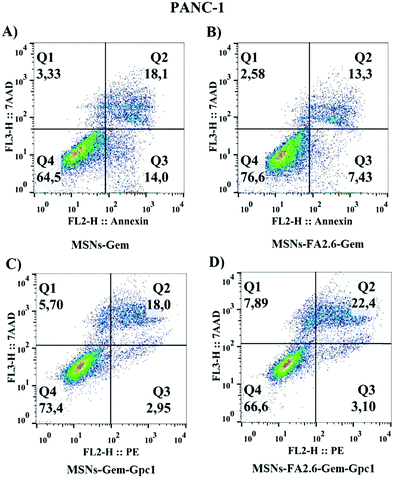
Cellular viability was also assessed by flow cytometry to investigate nanoparticle specificity (Fig. 11). The apoptosis/necrosis assays confirmed that MSNs-FA2.6–Gem–anti-GPC1 induced pancreatic cell death after 24 hours. The latter NPs exhibited higher cytotoxic potential compared to MSNs-FA2.6–Gem, with the apoptotic cell death population (Annexin+/7AAD− and Annexin+/7AAD+) predominating over necrotic positive cells (7AAD+). MSNs-Gem was more cytotoxic than MSNs-Gem–anti-GPC1, supporting the importance of FA molecules in the treatment to potentialize the NP efficacy. The results indicate that MSNs-Gem is able to interact with tumor cells, inducing a higher toxicity in comparison to the pure Gem. However, the presence of anti-GPC1 antibodies in nanoparticles apparently did not increase the nanoparticle cytotoxicity in PANC-1 cells, as revealed by the same percentage of dead cells in the presence or absence of antibody. Interestingly, nanoparticles modified with ferulic acid (MSNs-FA2.6–Gem–Gpc1) increased cell death (7AAD+/annexin V+) = 22.4; (7AAD−/annexin V+ = 3.10) compared to MSNs-Gem–Gpc1, resulting in low viability over cells that interacted with nanocomposites. Different from the MTT results, absence or low cytotoxic activity was observed when nanoparticles conjugated with antibodies were added to healthy hepatocellular cultures (Fig. S7, ESI†). This could be explained because the adhesion molecules expressed on the cellular membrane of liver cells interact with silica nanoparticles, inducing an unspecific uptake.70 Finally, our results confirm the antibody specificity in the target cells and reinforce drug internalization in PANC-1, with ferulic acid molecules enhancing MSNs-Gem–Gpc1 cytotoxicity.
Conclusion
We have successfully synthesized a novel nanoplatform for cancer therapy by developing mesoporous silica nanoparticles encapsulating ferulic acid/gemcitabine functionalized with anti-GPC1 antibodies to target human pancreatic cancer cells PANC-1. The well-ordered mesoporous silica nanoparticles and the functionalization with APTES were obtained via a “one-pot” methodology that allowed the adsorption of gemcitabine inside the pores. In addition, the amino groups facilitated the attachment of the antibody to silica nanoparticles. The functionalization of silica nanoparticles with anti-GPC1 antibodies allowed the transport of the chemotherapeutic drug to the specific cancer cell PANC-1. Our results show that silica nanoparticles potentialized the gemcitabine toxic effects in the pancreatic cancer cells with low doses of chemotherapeutic drugs. MSNs are efficient nanoplatforms to simultaneously deliver gemcitabine and ferulic acid for pancreatic carcinoma cells, enhancing their cytotoxic effects in comparison to drugs alone. Besides, the conjugation with antioxidant molecules favors the chemotherapeutic activity in the PANC-1 cells, increasing the toxic effects of MSNs on carcinogenic cells.Conflicts of interest
There are no conflicts to declare.Acknowledgements
This study was funded by the Brazilian National Council for Scientific and Technological Development (CNPq) (project number 435325/2016-7) and the São Paulo Research Foundation (FAPESP) (project number 2017/22056-9, 2018/12670-4 and 2020/00124-5).References
- A. Jemal, F. Bray, M. M. Center, J. Ferlay, E. Ward and D. Forman, CA: Cancer J. Clin., 2011, 61, 69–90 Search PubMed.
- A. Vincent, J. Herman, R. Schulick, R. H. Hruban and M. Goggins, Lancet, 2011, 378, 607–620 CrossRef.
- R. L. Siegel, K. D. Miller and A. Jemal, CA: Cancer J. Clin., 2020, 70, 7–30 Search PubMed.
- F. Riva, O. I. Dronov, D. I. Khomenko, F. Huguet, C. Louvet, P. Mariani, M. Stern, O. Lantz, C. Proudhon, J. Pierga and F. Bidard, Mol. Oncol., 2016, 10, 481–493 CrossRef CAS PubMed.
- K. Samanta, S. Setua, S. Kumari, M. Jaggi, M. M. Yallapu and S. C. Chauhan, Pharmaceutics, 2019, 11, 1–25 CrossRef PubMed.
- WHO, http://Www.Who.Int/Medicines/Publications/Essentialmedicines/En, 2015, 1–43.
- N. M. F. S. A. Cerqueira, P. A. Fernandes and M. J. Ramos, Chem. – Eur. J., 2007, 13, 8507–8515 CrossRef CAS.
- M. L. Alvarellos, J. Lamba, K. Sangkuhl, C. F. Thorn, L. Wang, D. J. Klein, R. B. Altman and T. E. Klein, Pharmacogenet. Genomics, 2014, 24, 564–574 CrossRef CAS PubMed.
- X. W. Zhang, Y. X. Ma, Y. Sun, Y. B. Cao, Q. Li and C. A. Xu, Target. Oncol., 2017, 12, 309–321 CrossRef.
- FDA, “delayed-release tablets”https://www.fda.gov/media/111445/download, 2020.
- Y. Dai, J. Su, K. Wu, W. Ma, B. Wang, M. Li, P. Sun, Q. Shen, Q. Wang and Q. Fan, ACS Appl. Mater. Interfaces, 2019, 11, 10540–10553 CrossRef CAS.
- B. Al-Lazikani, U. Banerji and P. Workman, Nat. Biotechnol., 2012, 30, 679–692 CrossRef CAS.
- R. B. Mokhtari, T. S. Homayouni, N. Baluch, E. Morgatskaya, S. Kumar, B. Das and H. Yeger, OncoTargets Ther., 2017, 8, 38022–38043 CrossRef.
- R. A. Fryer, B. Barlett, C. Galustian and A. G. Dalgleish, Anticancer Res., 2011, 31, 3747–3756 CAS.
- N. Kumar and V. Pruthi, Biotechnol. Rep., 2014, 4, 86–93 CrossRef PubMed.
- W. Wu, S. Y. Lee, X. Wu, J. Y. Tyler, H. Wang, Z. Ouyang, K. Park, X. M. Xu and J. X. Cheng, Biomaterials, 2014, 35, 2355–2364 CrossRef CAS PubMed.
- H. Mori, K. Kawabata, N. Yoshimi, T. Tanaka, T. Murakami, T. Okada and H. Murai, Anticancer Res., 1999, 19, 3775–3778 CAS.
- A. Hirata, Y. Murakami, T. Atsumi, M. Shoji, T. Ogiwara, K. Shibuya, S. Ito, I. Yokoe and S. Fujisawa, In Vivo, 2005, 19, 849–854 CAS.
- V. R. Bandugula and R. N. Prasad, Tumor Biol., 2013, 34, 251–259 CrossRef CAS.
- S. Balakrishnan, S. Manoharan, L. M. Alias and M. R. Nirmal, Indian J. Biochem. Biophys., 2010, 47, 7–12 CAS.
- T. Wang, X. Gong, R. Jiang, H. Li, W. Du and G. Kuang, Am. J. Transl. Res., 2016, 8, 968–980 CAS.
- W. He, J. Yan, F. Sui, S. Wang, X. Su, Y. Qu, Q. Yang, H. Guo, M. Ji, W. Lu, Y. Shao and P. Hou, ACS Nano, 2018, 12, 11664–11677 CrossRef CAS.
- Y. Chang, L. He, Z. Li, L. Zeng, Z. Song, P. Li, L. Chan, Y. You, X. F. Yu, P. K. Chu and T. Chen, ACS Nano, 2017, 11, 4848–4858 CrossRef CAS PubMed.
- P. A. J. Muller and K. H. Vousden, Nat. Cell Biol., 2013, 15, 2–8 CrossRef CAS PubMed.
- M. Amit, H. Takahashi, M. P. Dragomir, A. Lindemann, F. O. Gleber-Netto, C. R. Pickering, S. Anfossi, A. A. Osman, Y. Cai, R. Wang, E. Knutsen, M. Shimizu, C. Ivan, X. Rao, J. Wang, D. A. Silverman, S. Tam, M. Zhao, C. Caulin, A. Zinger, E. Tasciotti, P. M. Dougherty, A. El-Naggar, G. A. Calin and J. N. Myers, Nature, 2020, 578, 449–454 CrossRef CAS.
- K. Hientz, A. Mohr, D. Bhakta-Guha and T. Efferth, OncoTargets Ther., 2017, 8, 8921–8946 CrossRef.
- A. Y. Rwei, W. Wang and D. S. Kohane, Nano Today, 2015, 10, 451–467 CrossRef CAS.
- L. Brannon-Peppas and J. O. Blanchette, Adv. Drug Delivery Rev., 2004, 56, 1649–1659 CrossRef CAS PubMed.
- A. Watermann and J. Brieger, Nanomaterials, 2017, 7(7), 189 CrossRef PubMed.
- M. Manzano and M. Vallet-Regí, Adv. Funct. Mater., 2020, 30, 3–5 CrossRef.
- A. H. Faraji and P. Wipf, Bioorg. Med. Chem., 2009, 17, 2950–2962 CrossRef CAS.
- M. Vallet-Regí, ISRN Mater. Sci., 2012, 2012, 1–20 CrossRef.
- M. Colilla, B. González and M. Vallet-Regí, Biomater. Sci., 2013, 1, 114–134 RSC.
- S. A. Melo, H. Sugimoto, J. T. O’Connell, N. Kato, A. Villanueva, A. Vidal, L. Qiu, E. Vitkin, L. T. Perelman, C. A. Melo, A. Lucci, C. Ivan, G. A. Calin and R. Kalluri, Cancer Cell, 2014, 26, 707–721 CrossRef CAS PubMed.
- S. A. Melo, L. B. Luecke, C. Kahlert, A. F. Fernandez, S. T. Gammon, J. Kaye, V. S. LeBleu, E. A. Mittendorf, J. Weitz, N. Rahbari, C. Reissfelder, C. Pilarsky, M. F. Fraga, D. Piwnica-Worms and R. Kalluri, Nature, 2015, 523, 177–182 CrossRef CAS.
- A. Wada, S. Tamaru, M. Ikeda and I. Hamachi, J. Am. Chem. Soc., 2009, 5321–5330 CrossRef CAS.
- N. Shenoy, M. Stenson, J. Lawson, J. Abeykoon, M. Patnaik, X. Wu and T. Witzig, Lab. Invest., 2017, 97, 494–497 CrossRef CAS.
- K. S. Louis and A. C. Siegel, Methods Mol. Biol., 2011, 740, 7–12 CrossRef CAS.
- I. Miletto, E. Bottinelli, G. Caputo, S. Coluccia and E. Gianotti, Phys. Chem. Chem. Phys., 2012, 14, 10015–10021 RSC.
- S. Saroj and S. J. Rajput, Drug Dev. Ind. Pharm., 2018, 44, 1198–1211 CrossRef CAS.
- A. C. Pradhan, S. Martha, S. K. Mahanta and K. M. Parida, Int. J. Hydrogen Energy, 2011, 36, 12753–12760 CrossRef CAS.
- K. P. S. Zanoni, R. R. C. Vilela, I. D. A. Silva, N. Y. Murakami Iha, H. Eckert and A. S. S. De Camargo, Inorg. Chem., 2019, 58, 4962–4971 CrossRef CAS.
- E. Gianotti, B. M. Estevão, I. Miletto, S. Tonello, F. Renò and L. Marchese, ChemistrySelect, 2016, 1, 127–131 CrossRef CAS.
- K. Liu, X. Liu, Q. Zeng, Y. Zhang, L. Tu, T. Liu and X. Kong, ACS Nano, 2012, 6(5), 4054–4062 CrossRef CAS.
- L. Lopez, V. Montes, H. Kušar, S. Cabrera, M. Boutonnet and S. Järås, Appl. Catal., A, 2016, 526, 77–83 CrossRef CAS.
- D. W. Johnson, J. Agric. Food Chem., 1967, 15, 757–761 CrossRef.
- B. Martins Estevão, F. Cucinotta, N. Hioka, M. Cossi, M. Argeri, G. Paul, L. Marchese and E. Gianotti, Phys. Chem. Chem. Phys., 2015, 17, 26804–26812 RSC.
- K. S. W. Sing and R. T. Williams, Adsorpt. Sci. Technol., 2004, 22, 773–782 CrossRef CAS.
- A. Molinari, A. Maldotti, A. Bratovcic and G. Magnacca, Catal. Today, 2011, 161, 64–69 CrossRef CAS.
- E. Gianotti, B. Martins Estevão, F. Cucinotta, N. Hioka, M. Rizzi, F. Renò and L. Marchese, Chem. – Eur. J., 2014, 20, 10921–10925 CrossRef CAS PubMed.
- B. M. Estevão, D. S. Pellosi, C. F. De Freitas, D. Vanzin, D. S. Franciscato, W. Caetano and N. Hioka, J. Photochem. Photobiol., A, 2014, 287, 30–39 CrossRef.
- K. H. Müller, M. Motskin, A. J. Philpott, A. F. Routh, C. M. Shanahan, M. J. Duer and J. N. Skepper, Biomaterials, 2014, 35, 1074–1088 CrossRef PubMed.
- M. P. Monopoli, D. Walczyk, A. Campbell, G. Elia, I. Lynch, F. Baldelli Bombelli and K. A. Dawson, J. Am. Chem. Soc., 2011, 133, 2525–2534 CrossRef CAS.
- V. Nairi, S. Medda, M. Piludu, M. F. Casula, M. Vallet-Regì, M. Monduzzi and A. Salis, Chem. Eng. J., 2018, 340, 42–50 CrossRef CAS.
- A. C. P. da Silva, P. H. Y. Cordeiro, B. M. Estevão, W. Caetano, H. Eckert, S. M. O. Santin, M. P. Moisés, N. Hioka and A. L. Tessaro, J. Braz. Chem. Soc., 2019, 30, 1599–1607 CAS.
- M. Mahmoudi, I. Lynch, M. R. Ejtehadi, M. P. Monopoli, F. B. Bombelli and S. Laurent, Chem. Rev., 2011, 111, 5610–5637 CrossRef CAS PubMed.
- F. Chen, H. Hong, Y. Zhang, H. F. Valdovinos, S. Shi, G. S. Kwon, C. P. Theuer, T. E. Barnhart and W. Cai, ACS Nano, 2013, 7, 9027–9039 CrossRef CAS PubMed.
- E. Peretti, I. Miletto, B. Stella, F. Rocco, G. Berlier and S. Arpicco, Pharmaceutics, 2018, 10, 11–14 CrossRef.
- I. Miletto, E. Bottinelli, A. Siviero, D. Fabbri, P. Calza and G. Berlier, J. Nanopart. Res., 2016, 18, 227 CrossRef.
- M. Rizzi, S. Tonello, B. M. Estevão, E. Gianotti, L. Marchese and F. Renò, J. Photochem. Photobiol., B, 2017, 167, 1–6 CrossRef CAS.
- I. I. Slowing, J. L. Vivero-Escoto, C. W. Wu and V. S. Y. Lin, Adv. Drug Delivery Rev., 2008, 60, 1278–1288 CrossRef CAS PubMed.
- I. Schütz, T. Lopez-Hernandez, Q. Gao, D. Puchkov, S. JaBerlinbs, D. Nordmeyer, M. Schmudde, E. Rühl, C. M. Graf and V. Haucke, J. Biol. Chem., 2016, 291, 14170–14184 CrossRef.
- G. D. Kruh and M. G. Belinsky, Oncogene, 2003, 22, 7537–7552 CrossRef CAS PubMed.
- M. K. Gurka, D. Pender, P. Chuong, B. L. Fouts, A. Sobelov, M. W. McNally, M. Mezera, S. Y. Woo and L. R. McNally, J. Controlled Release, 2016, 231, 60–67 CrossRef CAS PubMed.
- W. Tang, J. Yang, Y. Yuan, Z. Zhao, Z. Lian and G. Liang, Nanoscale, 2017, 9, 6529–6536 RSC.
- J. Tahara, K. Shimizu, N. Otsuka, J. Akao, Y. Takayama and K. Tokushige, Cancer Chemother. Pharmacol., 2018, 82, 245–250 CrossRef CAS PubMed.
- U. Fahrioğlu, Y. Dodurga, L. Elmas and M. Seçme, Gene, 2016, 576, 476–482 CrossRef.
- H. H. Yan, K. H. Jung, M. K. Son, Z. Fang, S. J. Kim, Y. L. Ryu, J. Kim, M. H. Kim and S. S. Hong, OncoTargets Ther., 2014, 5, 9150–9168 CrossRef.
- H. Q. Ju, T. Gocho, M. Aguilar, M. Wu, Z. N. Zhuang, J. Fu, K. Yanaga, P. Huang and P. J. Chiao, Mol. Cancer Ther., 2015, 14, 788–798 CrossRef CAS.
- Q. Mu, N. S. Hondow, Ł. Krzemiński, A. P. Brown, L. J. C. Jeuken and M. N. Routledge, Part. Fibre Toxicol., 2012, 9, 1–11 CrossRef PubMed.
Footnote |
| † Electronic supplementary information (ESI) available. See DOI: 10.1039/d1ma00225b |
| This journal is © The Royal Society of Chemistry 2021 |

