
 Open Access Article
 This Open Access Article is licensed under a Creative Commons Attribution-Non Commercial 3.0 Unported Licence
Exchange-spring mechanism and Griffiths-like phase in room-temperature magnetoelectric Ni–BaTiO3 composites†
Ramany
Revathy
 a,
Nandakumar
Kalarikkal
b,
Manoj Raama
Varma
*ac and
Kuzhichalil Peethambharan
Surendran
*ac
a,
Nandakumar
Kalarikkal
b,
Manoj Raama
Varma
*ac and
Kuzhichalil Peethambharan
Surendran
*ac
aMaterials Science and Technology Division, CSIR-National Institute for Interdisciplinary Science and Technology (NIIST), Research Centre of University of Kerala, Thiruvananthapuram-695019, Kerala, India. E-mail: kpsurendran@niist.res.in; manoj@niist.res.in; Fax: +91-471-2491712; Tel: +91-471-2515258 Tel: +91-471-2515377
bInternational & Inter-University Centre for Nanoscience and Nanotechnology, Mahatma Gandhi University, Kottayam, Kerala-686560, India
cAcademy of Scientific and Innovative Research, CSIR-HRDC Campus, Uttar Pradesh-201002, India
First published on 17th June 2021
Abstract
Magnetoelectric composite materials consisting of coupled magnetic and ferroelectric phases open doors to exciting applications like electrically controlled magnetic sensors and memories. In this direction, we report the first-time observation of the exchange-spring mechanism in nickel–barium titanate magnetoelectric composite systems. The low field DC magnetization measurements of the Ni–BaTiO3 composite systems reveal an anomalous magnetic behaviour indicating the presence of a Griffiths-like phase. The exchange bias loop shift observed in the Ni–BaTiO3 systems confirms the formation of antiferromagnetic NiO. The structural transitions of BaTiO3 visible in the magnetic data implicate magnetoelectric coupling between Ni and BaTiO3. The maximum value of the magnetoelectric coupling coefficients observed for the Ni–BaTiO3 0–3 composites is 18.53 mV cm Oe−1, and for the composites with 1–3 connectivity it is 10.91 mV cm Oe−1; both values are higher than the reported values of Ni–BaTiO3 particulate composites. In addition to this, the magnetoelectric coupling coefficients of the Ni–BaTiO3 composites with 1–3 connectivity show an increasing trend towards the BaTiO3 rich composite.
1. Introduction
Multiferroics exhibit multiple properties like ferromagnetism, ferroelectricity, ferroelasticity etc. in the same system, enabling cross control of ferroic order parameters.1 Among various multiferroics, magnetoelectric (ME) materials whose magnetism can be controlled by electricity have drawn great attention. Due to coupling between ferromagnetic (FM) and ferroelectric (FE) order, they find immense applications in sensors and memories, where one ferroic property can be manipulated using the conjugate field of the other.2 Most single-phase ME materials have minimal ME coupling, and the majority of them possess Curie temperatures much below ambient. Hence single-phase ME materials are likely to be too weak for practical applications. Among them, BiFeO3 shows high Curie and Néel temperatures far above room temperature, and thus is widely investigated.3 In comparison to single-phase ME materials, ME composites have high demand due to their much higher ME coefficient and operating temperature. Multifunctional composites are defined using connectivity schemes such as 2–2 (2 dimensionally laminated), 0–3 (zero dimensional (0D) particles dispersed in a 3-dimensional (3D) matrix), and 1–3 composites (one dimensional (1D) materials embedded in a 3D matrix).4 In a magnetoelectric composite, the ME coupling is generated due to the magnetostrictive and piezoelectric effects, mainly happening at the interface.5BaTiO3 (BTO) is a well-studied system due to the high dielectric permittivity and phase transitions. BTO exhibits various temperature dependent phases such as cubic, tetragonal, orthorhombic and rhombohedral. Among these, the high-temperature cubic structure is paraelectric (>393 K), while the others are ferroelectric.6 ME composites of BTO and ferrimagnetic (FiM) CoFe2O4 (CFO) have been widely investigated.7–9 But Ni–BTO systems are far less studied due to the high conductivity of Ni. For the synthesis of highly insulating Ni–BTO composites, the partial pressure of oxygen is a crucial factor. If the partial pressure is too high, Ni gets oxidized, and, for a too-small value of the partial pressure, oxygen defects in BTO result in high leakage current.10
Most of the reported literature on Ni–BTO composites is focused on multilayer ceramic capacitor (MLCC) applications.11–13 In BTO coated Ni, the nano ferroelectric coating inhibited the oxidation of the Ni core.12 Composites of Ni and BTO are far less investigated as magnetoelectric materials. The first documented record in this direction happened only in 2010 when Lutsev et al. reported the spin-wave dynamics in Ni/BTO nanocomposites, who also measured the ME coupling coefficient of these composites using microwave spectroscopy.14 Around the same time, the electric manipulation of the magnetization of Ni/BTO hybrid structures was reported, which revealed the magnetoelectric coupling phenomenon. Accordingly, the strain induced in BTO is transferred to the Ni layer, which affects the magnetization due to inverse magnetostriction.15 More recently, the variation of magnetoelectricity in a BTO/Ni composite as a function of compaction pressure was reported by Brosseau et al.16 Now it is well known that the magnetization of FM materials is influenced by the interplay of various anisotropies, in which strain anisotropy plays a substantial role. Compressive stress induces significant changes in the magnetic anisotropy at the FM grain boundaries.16 In 2012, Dai et al. investigated the electronic structure and ME effect at the interface of X/BTO (X = Ni, Fe) superlattices using the first-principles density functional theory.17 They observed that in Ni/BTO composites the ME effect is determined by the change of magnetic moments on Ni atoms near the interface.17 In 2014, Liang et al. investigated the ME properties of BTO thin films deposited on Ni foils and found that the ME coupling coefficient is inversely related to the thickness of the interfacial NiO layer.18 In 2019, Siva Vadla et al. reported the ME coupling in BTO nanotubes electrodeposited with Ni.19 In that study, both the inner and outer surface of BTO tubes are deposited with Ni, thereby maximizing the strain transfer at the Ni–BTO–Ni interfaces. Subsequently, Buttlar et al. also synthesized ME composites of micro-sized Ni particles embedded in a BTO matrix by reductive sintering under nitrogen gas.20 In 2020, we have reported the ME effect in hierarchically grown Ni nanowires decorated with BTO nanoparticles and found that the coercivity gets improved by optimal FE decoration.21 Recently, our group reported the ME coupling in BTO coated sea urchin-like Ni nanoparticles and found that the ME coupling influences the electric and magnetic transport mechanisms.81
In several solid-state physical systems, including ferrites22 and perovskites,23 Griffiths-like phase (GP) is frequently being reported. Recently, we have reported GP in Fe3O4 nanostructures.24 Nevertheless, only a few reports are available on the observation of GP in multiferroic materials. In the simplest terms, GP represents the presence of magnetic inhomogeneity in a paramagnetic (PM) matrix showing nonlinear inverse susceptibility (χ−1) above its ferromagnetic Curie temperature (TC).25 Thus, GP is usually observed as a downturn in χ−1 above TC. In 2012, Prokhorov et al. reported GP in single-phase multiferroic BiMnO3 and BiFe0.5Mn0.5O3 films.26 Later, Singh et al. reported GP in a manganese doped Co3TeO6 multiferroic.27 Due to the highly conducting nature, ME structures involving 0D and 1D Ni are mostly unexplored. The observation of exchange bias and GP in such systems has not been reported yet. Our intention is to throw more light on the factors controlling the cross-coupling in such systems.
In the present investigation, we report the synthesis of 0–3 and 1–3 ME composites made of sea-urchin-like Ni nanoparticles and one dimensional prickly Ni nanowires with ferroelectric BTO for room temperature ME applications. The ferroelectric, magnetic and magnetoelectric properties of these ME composites were investigated thoroughly. Magnetic measurements elucidate the first observation of the exchange spring mechanism and Griffiths-like phase in Ni–BTO composites.
2. Experimental
2.1. Synthesis
The nickel nanostructures were synthesized through a chemical reduction process, as described in our former paper.28 Analytical grade chemicals were used with no further purification. NaOH (SD Fine-Chem Limited, 98% pellets) was used as the base to control the pH value. The reducing agent N2H4·H2O (99% solution in water, Merck) controls the Ni nanostructure's reduction. The reaction was carried out for different molarities of NaOH and thereby varying the value of the pH. When the pH was 9.1, prickly Ni nanowires (coded as NW, hereafter) were formed, while a pH of 10.2 yields sea-urchin-like Ni nanoparticles (coded as NP, hereafter). BTO nanoparticles were synthesized through the same procedure as described in our recently published paper.21 For the present study, the ME composites are prepared using NP and NW as the FM phase and BTO as the FE phase. Two sets of ME composites Ni–BTO in different morphology were synthesized, namely NP–BTO and NW–BTO. Both sets of samples were prepared in three different weight percentages (wt%), with Ni![[thin space (1/6-em)]](https://www.rsc.org/images/entities/char_2009.gif) :BTO ratio of 1:1, 1:2 and 1:5, where Ni acts as the filler and BTO as the matrix for making 0–3 ME composites of NP–BTO and 1–3 ME composites of NW–BTO. These two sets of composites are coded as NP–BTO 1:1, NP–BTO 1:2 and NP–BTO 1:5, and NW–BTO 1:1, NW–BTO 1:2 and NW–BTO 1:5. All the samples were prepared by mixing Ni and BTO samples using an agate mortar and pestle for an hour.
:BTO ratio of 1:1, 1:2 and 1:5, where Ni acts as the filler and BTO as the matrix for making 0–3 ME composites of NP–BTO and 1–3 ME composites of NW–BTO. These two sets of composites are coded as NP–BTO 1:1, NP–BTO 1:2 and NP–BTO 1:5, and NW–BTO 1:1, NW–BTO 1:2 and NW–BTO 1:5. All the samples were prepared by mixing Ni and BTO samples using an agate mortar and pestle for an hour.
2.2. Material characterization
The crystal structure of the samples NP, NW and BTO were determined by X-ray diffraction (XRD) techniques using a PANalytical X’pert Pro diffractometer (Cu-Kα X-rays with λ = 1.5406 Å). The morphology of samples NP, NW and BTO was studied using a transmission electron microscope (300 kV HRTEM, FEI Tecnai T30 with EDS, USA). The scanning electron microscopy (SEM) images, energy-dispersive X-ray spectroscopy (EDS) and elemental mapping of the ME composites were investigated using an SEM-ZEISS EVO 18 (Carl Zeiss, Germany). X-ray photoelectron spectroscopy (XPS, PHI 5000, ULVAC-PHI Inc., USA) analysis of the ME composites was carried out to study the surface chemistry, and the XPS data were processed using Multipak software. Magnetic characterization of the ME composites was carried out using a vibrating sample magnetometer (VSM) in a physical property measurement system (PPMS, Quantum Design, USA). The magnetoelectric coupling measurements were carried out using a magnetoelectric setup made by Marine India, New Delhi, comprising an electromagnet, a Helmholtz coil and a Hall probe.3. Results and discussion
3.1. Phase identification and morphology analysis
In general, ferromagnetic Ni crystallizes in fcc symmetry, whereas BaTiO3 crystallizes in ferroelectric tetragonal symmetry at room temperature. The XRD spectra of samples NP and NW are shown in Fig. 1(a). As expected, both samples have an fcc nickel phase (matched with JCPDS card No. 04-0850). Fig. 1(b) shows the XRD pattern of BTO nanoparticles indexed using tetragonal structured BaTiO3 (matched with JCPDS card No. 01-089-1428). Fig. 1(c)–(e) show the TEM images of NP, NW and BTO, respectively. Sample NP has a morphology resembling a sea urchin, and NW has a one-dimensional morphology with prickles on the surface, which is analogous to the stem of the plant Euphorbia. The TEM image showing the prickly surface of sample NW is shown in the inset of Fig. 1(d). The average particle size of the samples was calculated using GATAN Microscopy Suite software. Sample NP has an average particle size of 250 nm, and the diameter of NW is in the range of 500–700 nm. On the other hand, the BTO nanoparticles have an average particle size of 60 nm (see Fig. 1(e)).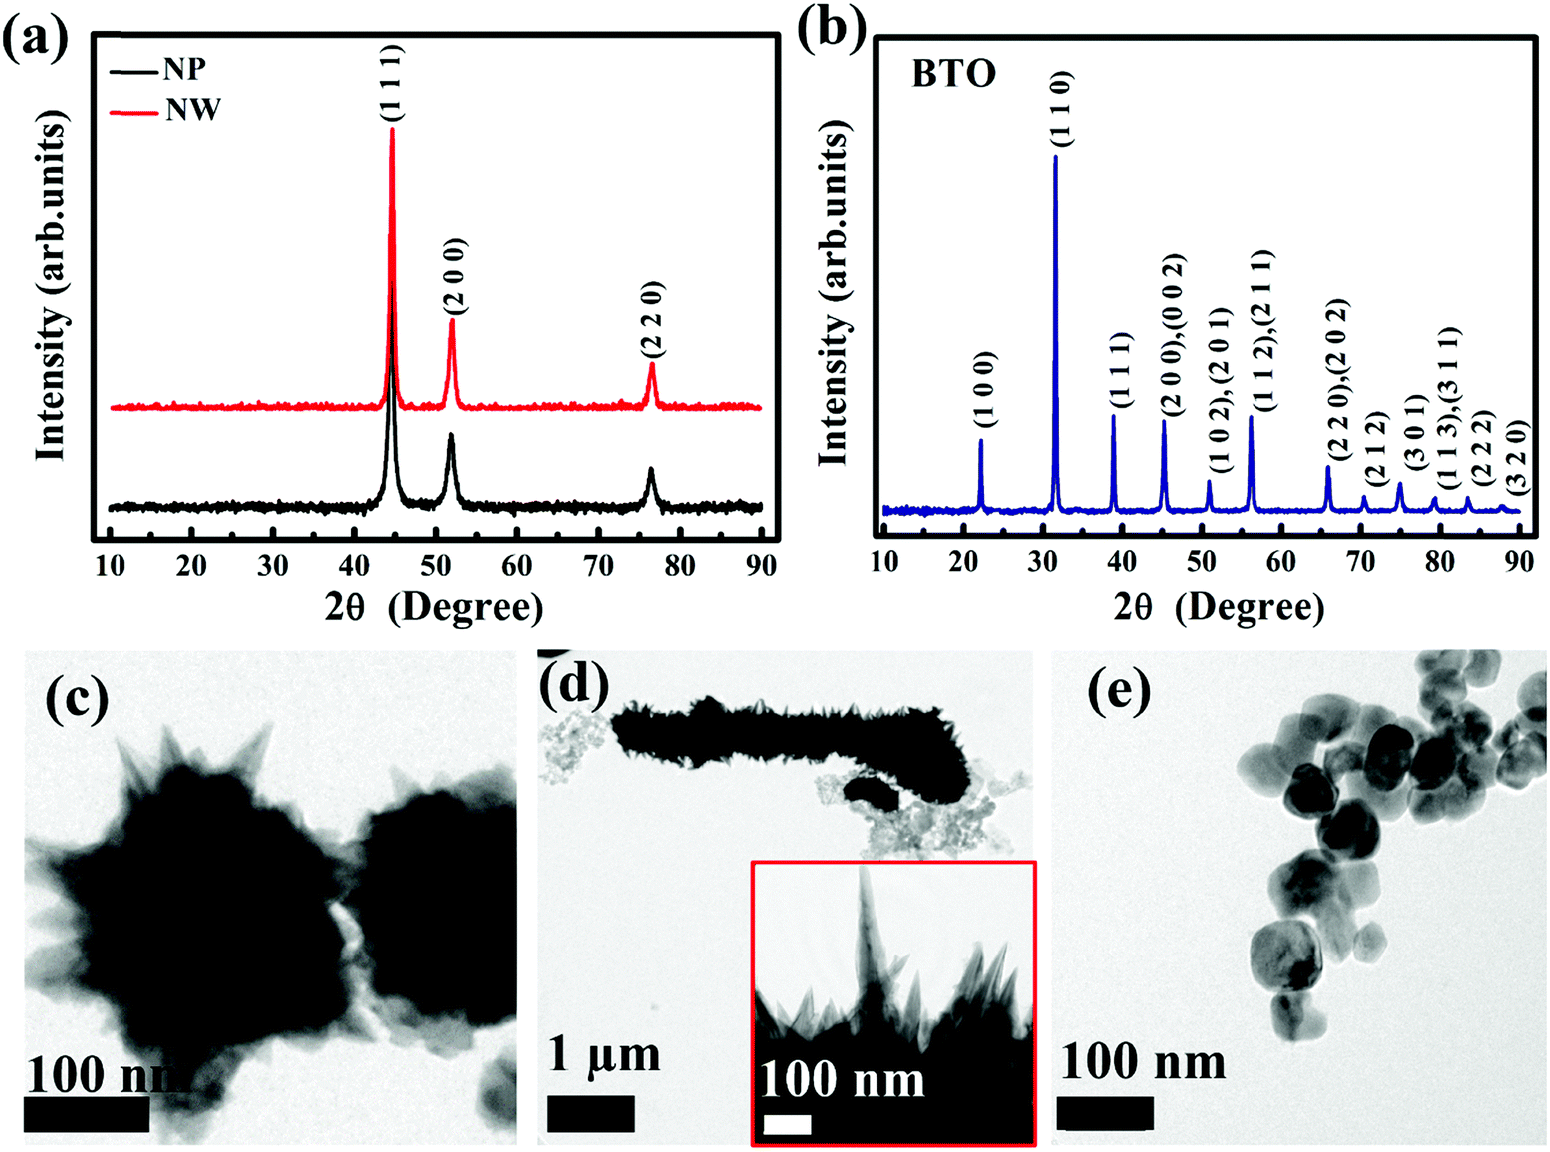 | ||
| Fig. 1 XRD patterns of (a) NP, NW, and (b) BTO, and TEM images of (c) NP, (d) NW, and (e) BTO. | ||
It is well known that, below a critical particle size, the room-temperature ferroelectricity of BTO nanoparticles completely disappears. Some of the previous reports show that the complete vanishing of ferroelectricity was observed below 30 nm due to its phase transition from tetragonal to cubic.29,30 However, this critical size largely depends on the synthesis methods, which vary in the range of 10–100 nm.31 There were exceptions in the exact critical particle size as well. For example, Qi et al. synthesized ultrafine tetragonal BTO nanoparticles of 7 nm and confirmed the room temperature ferroelectricity by Raman spectroscopy.32 If BTO has a cubic structure, the (200) plane in the XRD pattern is observable at 2θ ∼44.9° without splitting. But tetragonal BTO shows a peak splitting of the (2 0 0) and (0 0 2) planes in the 2θ range 44° to 46°. Due to the peak broadening at the nanoscale, the tetragonal (0 0 2) peak is not clearly visible, and it is difficult to determine the tetragonality (c/a axial ratio).33 So, we have carried out the deconvolution of the diffraction peak in the 2θ range 44.8° to 45.6°, and confirmed the (0 0 2) and (2 0 0) peaks of the tetragonal phase in BTO and both sets of Ni–BTO composites, which is shown in Fig. S1(a), (c) and (d) (ESI†). Also, the deconvolution of multiple peaks of the tetragonal BTO (2 0 2) and (2 2 0) planes in the 2θ range 65.4° to 66.4° is shown in Fig. S1(b) (ESI†). The deconvolution of the XRD peaks gives evidence for the presence of the (0 0 2) plane, which is a signature of the tetragonal ferroelectric phase of BTO nanoparticles.
In order to further confirm the tetragonality of the synthesized BTO nanoparticles, we have carried out the Rietveld refinement of BTO nanoparticles by simultaneously considering the cubic and tetragonal phases, which is shown in Fig. 2(a). Here, the Rietveld refinement was carried out using GSAS-EXP GUI software. From the refinement, 94.88% tetragonal phase and 5.12% cubic phase is achieved with a χ2 value of 1.09. So, the present BTO system is more or less tetragonal, and the tetragonality can be found from the refined lattice parameters. The lattice parameters obtained for the tetragonal BTO are a = b = 4.0030(1) Å, c = 4.0150(3) Å, α = β = γ = 90°. The tetragonality is given by the c/a ratio, which is obtained as 1.0029 for BTO. The indexed XRD patterns of NP–BTO 1:1 and NW–BTO 1:1 are shown in Fig. 2(b), and the corresponding Rietveld refined patterns are shown in Fig. 2(c) and (d). The obtained lattice parameters for NP–BTO 1:1 are a = 3.5281(1) Å for the fcc Ni phase and a = b = 4.0108(1) Å and c = 4.0229(2) Å for the tetragonal BTO phase with a χ2 value of 1.06. Similarly, for NW–BTO 1:1, the refined lattice parameters are a = 3.5281(4) Å for the fcc Ni phase and a = b = 4.0058(7) Å and c = 4.0182(3) Å for the tetragonal BTO phase with a χ2 value of 1.01. So the calculated axial ratio c/a is 1.0030 and 1.0031 for NP–BTO 1:1 and NW–BTO 1:1, respectively. Hence, only a slight variation is observed in the tetragonality of BTO while making the 0–3 and 1–3 composites.
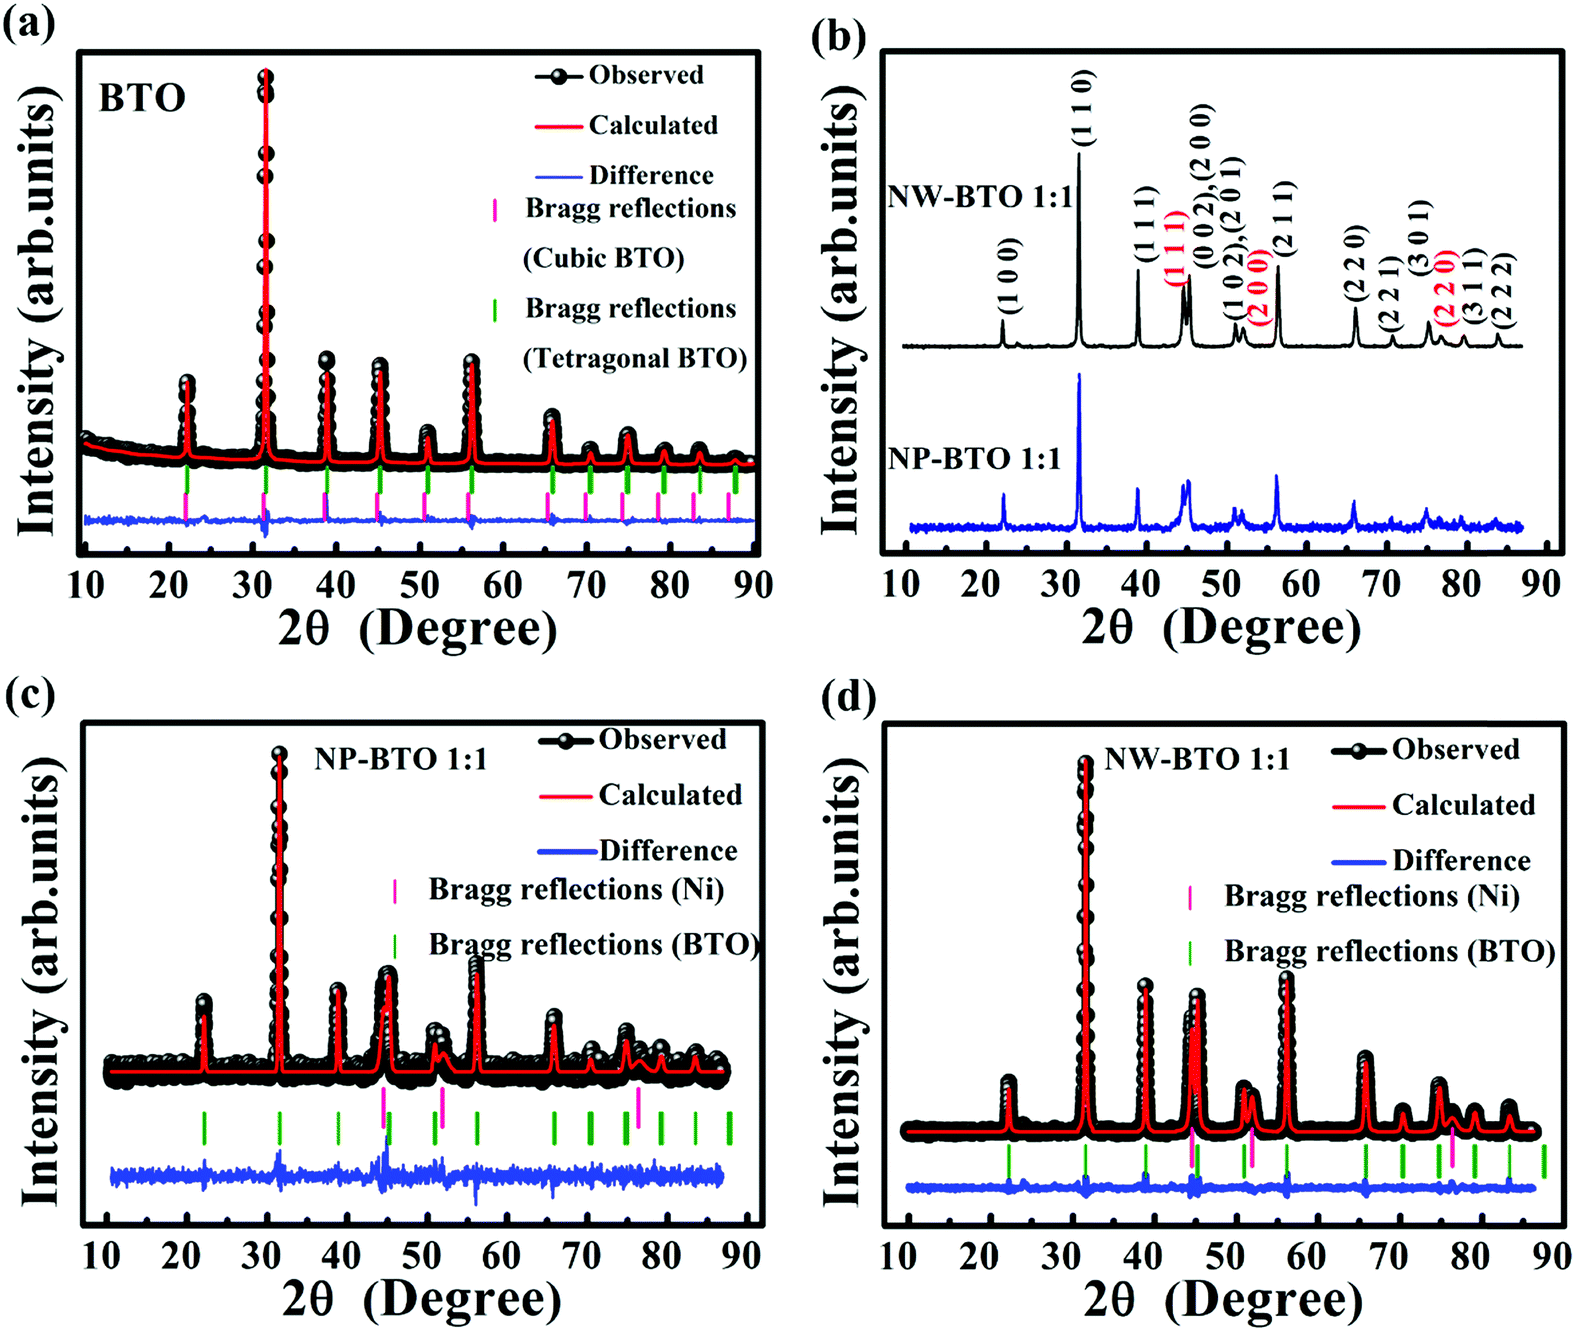 | ||
| Fig. 2 (a) Rietveld refined XRD patterns of BTO nanoparticles, (b) XRD patterns of NP–BTO 1:1 and NW–BTO 1:1, Rietveld refined XRD patterns of (c) NP–BTO 1:1, and (d) NW–BTO 1:1. | ||
The SEM images and EDS of pelletized sample NP–BTO 1:1 are shown in Fig. 3(a) and (b), and those of NW–BTO 1:1 are shown in Fig. 3(c) and (d). EDS of both samples confirmed the elemental composition, Ni, Ba, Ti and O. The atomic percentages obtained for NP–BTO 1:1 are 31.26% Ni, 10.43% Ba, 9.86% Ti and 48.45% O. For NW–BTO 1:1, 43.92% Ni, 10.57% Ba, 8.90% Ti and 36.61% O are obtained. Ideally, the Ba/Ti ratio should be equal to 1, but the atomic percentage obtained from EDS indicated the Ti deficiency occurred in the ME composites. According to previous reports, BTO can possess oxygen vacancies or titanium vacancies, depending on the synthesis route used, heat treatment employed, or the resulting particle size.34–38 Recently Duong et al. reported the presence of oxygen vacancies and non-stoichiometry of BTO in a Ni-doped BTO system.39Fig. 3(e)–(h) and (i)–(l) are the elemental mapping of samples NP–BTO 1:1 and NW–BTO 1:1, respectively. The elemental mapping of both samples shows the uniform distribution of elements in the samples and confirmed the homogeneous mixing of Ni and BTO in both the investigated particulate composites. Detailed electric, magnetic and magnetoelectric analyses were conducted to estimate the efficiency of the prepared 0–3 and 1–3 ME composites NP–BTO and NW–BTO, respectively.
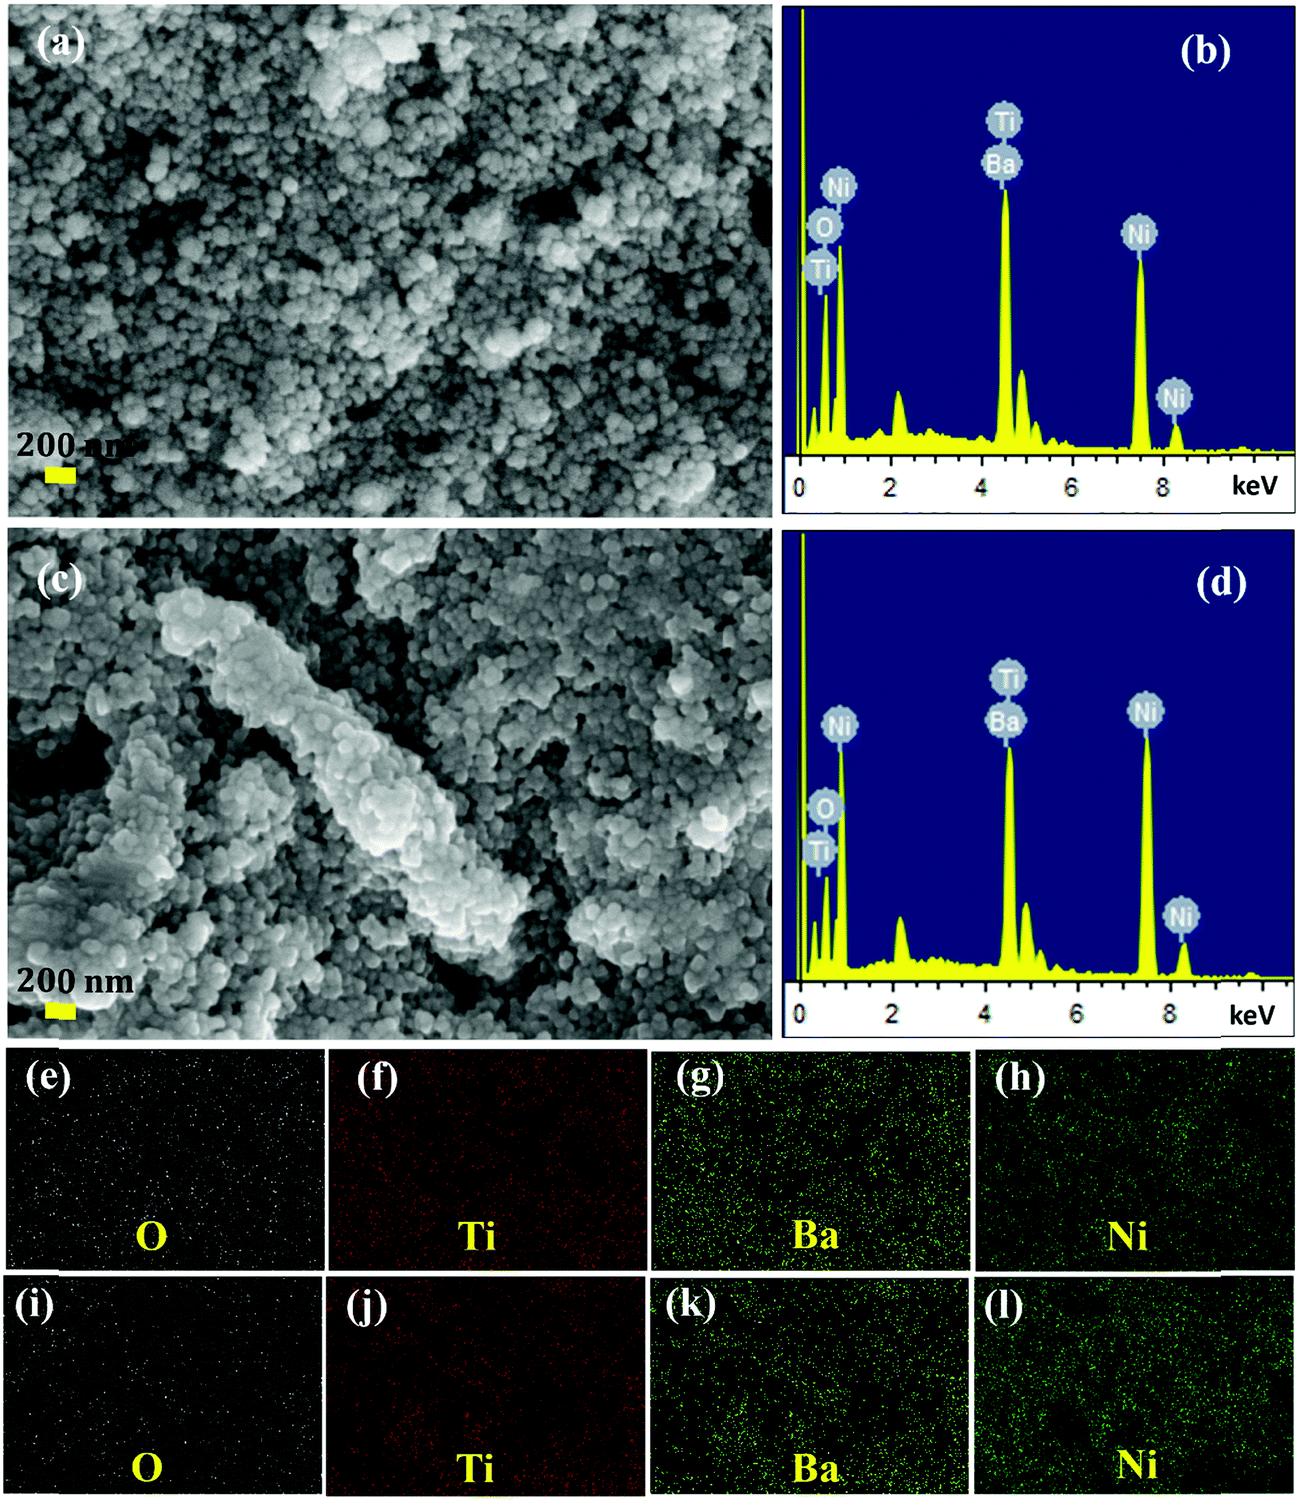 | ||
| Fig. 3 SEM images and EDS of (a and b) NP–BTO 1:1 and (c and d) NW–BTO 1:1, and elemental mapping of (e)–(h) NP–BTO 1:1 and (i)–(l) NW–BTO 1:1. | ||
3.2. Ferroelectric P–E loop analysis of the ME composites
Fig. 4 shows the polarization versus electric field (P–E) loops of the Ni–BTO ME composites. For making the ME composites, we used BTO nanoparticles with an average particle size of about 60 nm. In both the NP–BTO and NW–BTO series, the PR values slightly increase as a function of BTO concentration and the sample with a 1:5 ratio shows the maximum PR. For NP–BTO 1:5, the obtained PR is 0.006 μC cm−2, whereas 0.026 μC cm−2 for NW–BTO 1:5. The saturation and remnant polarization values of the ME composites increase as a function of BTO content since each FE grain acts as a centre of polarization.40 Here, we can observe that the PR values of the NW–BTO composites are higher than those of NP–BTO. The electrical conductivity is a crucial factor that controls the properties of ferroelectric composites.41 The parent ferromagnetic Ni samples NP and NW have room temperature conductivities of 3.83 × 10⁴ S m−1 and 6.21 × 10⁴ S m−1, respectively.21 The high aspect ratio of 1D sample leads to improved conductivity in NW. Hence, the overall conductivity of the NW–BTO composites should also be greater than that of the NP–BTO composites. We have tried to estimate the resistance of the ME composites via the two probe method using a source meter (2450-Keithley). All the NP–BTO composites show a resistance of the order of TΩ and due to this high value, the accurate estimation of the resistance was not possible with the available testing setup. In the case of the NW–BTO composites, the resistance obtained is 0.144 Ω, 21.2 Ω and 10.3 GΩ for the samples with NW:BTO ratios of 1:1, 1:2, and 1:5, respectively. These results indicate that the NW–BTO composites have lower resistivity (or higher conductivity) compared to the NP–BTO composites.
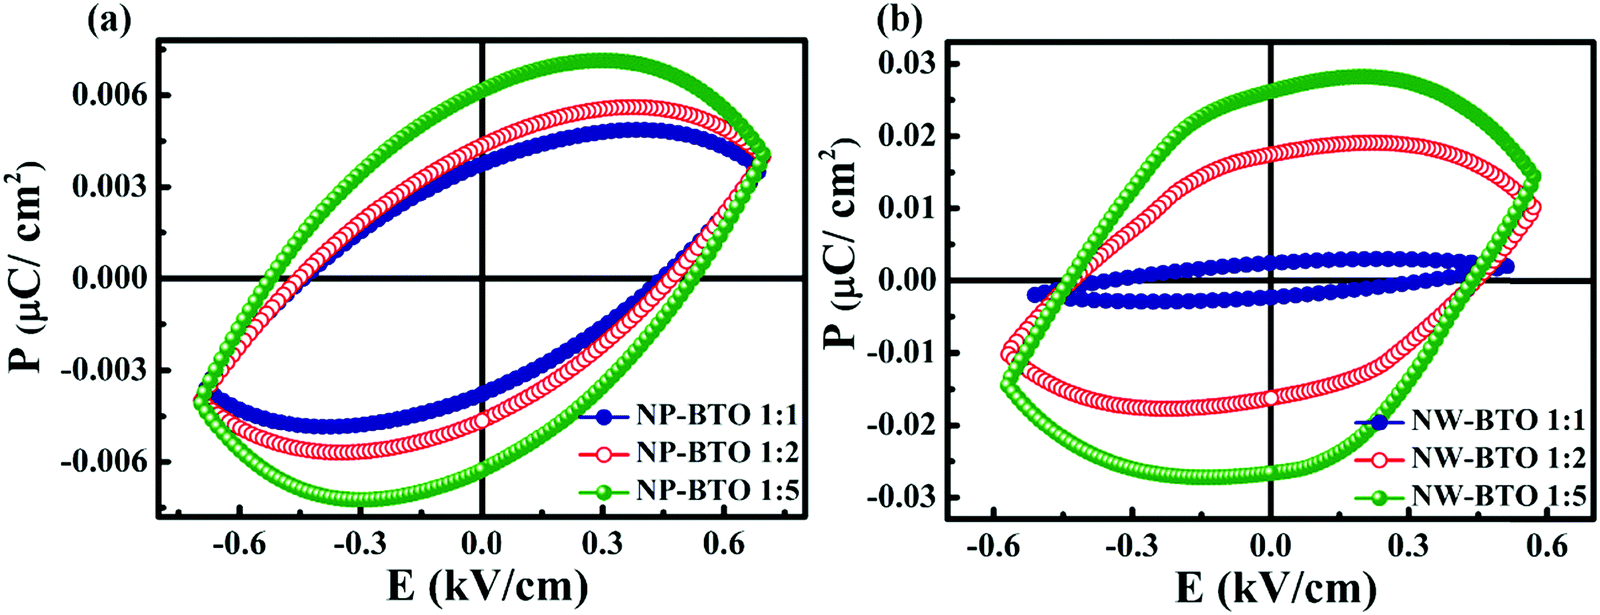 | ||
| Fig. 4 P–E loops of the (a) NP–BTO ME composites and (b) NW–BTO ME composites. | ||
The electrical transport mechanism in a multicomponent material can give vital clues about its ferroic properties. This correlation was thoroughly studied by Wei et al. in 2007, who theoretically studied the effect of electrical conductivity on the ferroelectric polarization in a 0–3 composite. They found that the polarization of the ferroelectric material in a composite can be enhanced by the proper increase of the conductivity.41 In the present study, the conductivity of the ME composite is altered by the addition of Ni with different morphology and an increased conductivity is obtained for the NW–BTO composites. Hence the PR value of the NW–BTO composites is higher than that of NP–BTO. However, while looking into the PE loop of the NW–BTO composites, the sample with high conductivity (NW–BTO 1:1) shows the lowest PR value. According to Wei et al., by the application of the same electric field, composites with higher conductivity become polarized faster.41 In that case, saturation polarization (PS) is achieved by the application of a small electric field. Similarly, in the present systems also, the NW–BTO composites saturate under a low field. However, when the conductivity exceeds a particular limit, the polarization reduces since it is unfavourable to the polarization of the ferroelectric component. As shown, when the resistance increases from 0.144 Ω to 10.3 GΩ, there is a sudden increase in PR value (0.002 to 0.026 μC cm−2).
The electrically conducting nature of the composites with an insulating matrix (BTO) and conducting filler (NW) is explained with percolation theory. According to this, an insulator to conductor transition is obtained at a critical filler content called the percolation threshold.42 In the present case, the wt% of the Ni must be kept below the percolation threshold in order to avoid the conducting network in the Ni–BTO ME composites and thereby increasing the polarization. Such an insulator to conductor transition is observed when the composition changes from NW–BTO 1:2 to NW–BTO 1:1. Due to the conducting Ni phase present in the studied composite systems, PS is achieved under the application of a small electric field. Above a threshold electric field, the composites become highly leaky and this causes the destruction of the polarization. Hence the applied electric field is limited to 0.7 kV cm−1 and 0.6 kV cm−1, respectively, for the NP–BTO and NW–BTO series.
Obviously, the ferroelectricity in the studied ME composites is due to the nanostructure of ferroelectric BTO. We have tested the P–E loop of BTO nanoparticles alone, which also shows low remanent polarization (PR = 0.023 μC cm−2) similar to the ME composites (see Fig. S2(a) in the ESI†). On the other hand, the sintered BTO at 1200 °C shows a large remanent polarization of 16.9 μC cm−2 (see Fig. S2(b) in the ESI†), which is in good agreement with previous reports.43 Here, the PR value in nanostructured BTO is found to be reduced compared to sintered bulk BTO, which is a consequence of the finite size effect in ferroelectrics. The volume of the grain boundary increases as the grain size decreases. The grain boundary possesses several defects and has low permittivity, thereby possessing poor ferroelectricity.45 At the same time, the space charges in the grain boundary eliminate the polarization charge on the grain surface and thereby form a depletion layer on the surface of the grain. Hence, in nanosized ferroelectric materials there is a discontinuity of the polarization on the surface of grains, which causes the formation of a depolarization field (Ed).44Ed is an internal field that depolarizes the ferroelectric material, resulting in the low polarization of ferroelectric nanomaterials compared to the bulk. On the other hand, the grain size increases with sintering and reduces the grain boundary volume, leading to an increase in the PR value. Similar smaller values for remanent polarization were previously reported in ferroelectric nanomaterials.46
3.3. Magnetic measurements
Magnetic hysteresis (M–H) loops were recorded at different temperatures in the field range −90 kOe to +90 kOe using VSM. Fig. 5 and 6 show the M–H loops of different ME composites of the NP–BTO series and NW–BTO series, respectively. Here, Fig. 5(a) presents the M–H loop of NP–BTO 1:1 taken at different temperatures, showing ferromagnetism up to 500 K, while the loop taken at 900 K shows a paramagnetic nature. So the ferromagnetic TC lies between 500 K and 900 K. The zoomed-in portion of Fig. 5(a) showing the coercivity and remanence is plotted in Fig. 5(b). Fig. 5(c)–(f) show the M–H loops and their zoomed-in portion of NP–BTO 1:2 and 1:5. Also, for sample NW–BTO 1:1, a similar paramagnetic nature is observed at 900 K (see Fig. 6(a)).
 | ||
| Fig. 5 M–H loops at different temperatures and the zoomed portion of the loops at 10 K, 100 K and 300 K for the NP–BTO ME composites. | ||
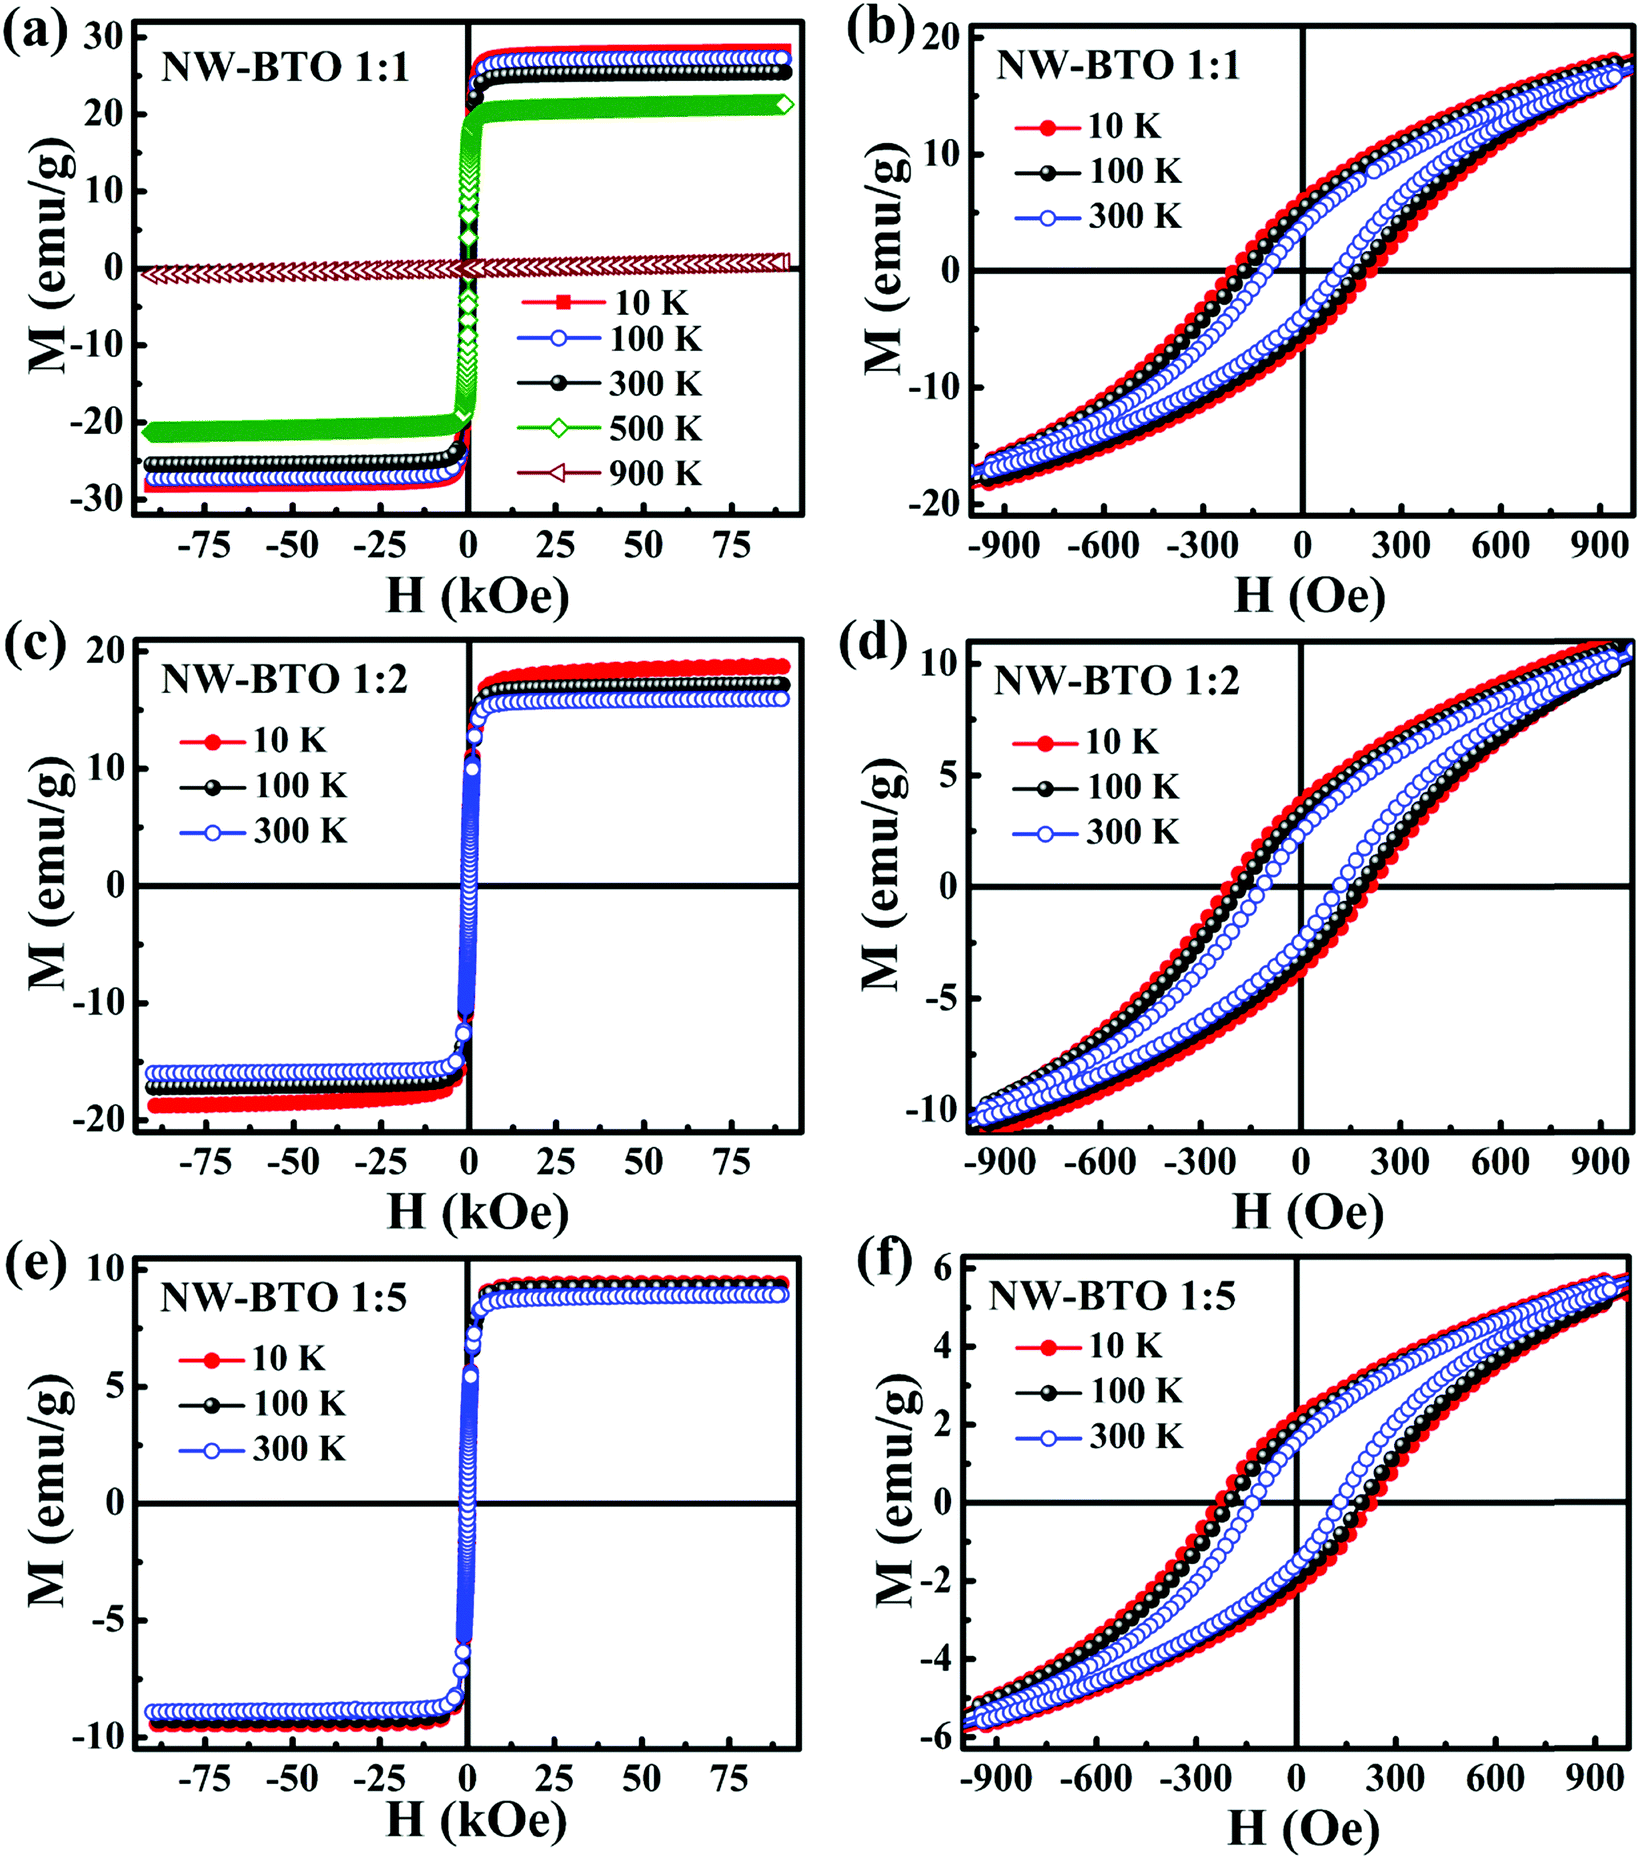 | ||
| Fig. 6 M–H loops at different temperatures and the zoomed portion of the loops at 10 K, 100 K and 300 K for the NW–BTO ME composites. | ||
The comparison of the obtained coercive field (HC), saturation magnetization (MS) and remanent magnetization (MR) of NP with the NP–BTO series and NW with the NW–BTO series is tabulated in Tables 1 and 2, respectively.
| Sample | T (K) | H C (Oe) | M S (emu g−1) | M R (emu g−1) |
|---|---|---|---|---|
| NP | 300 | 120 | 50 | 9 |
| NP–BTO 1:1 |
10 | 228 | 27.5 | 5.8 |
| 100 | 169 | 27.3 | 4.6 | |
| 300 | 99 | 25.7 | 3.1 | |
| NP–BTO 1:2 |
10 | 236 | 18.5 | 3.4 |
| 100 | 196 | 18 | 2.9 | |
| 300 | 119 | 17 | 1.9 | |
| NP–BTO 1:5 |
10 | 277 | 8.9 | 2.2 |
| 100 | 230 | 8.6 | 1.8 | |
| 300 | 133 | 8.1 | 1.2 | |
| Sample | T (K) | H C (Oe) | M S (emu g−1) | M R (emu g−1) |
|---|---|---|---|---|
| NW | 300 | 140 | 56.21 | 8.74 |
| NW–BTO 1:1 |
10 | 206 | 28.2 | 6 |
| 100 | 175 | 27.2 | 5.2 | |
| 300 | 113 | 25.5 | 3.8 | |
| NW–BTO 1:2 |
10 | 212 | 18.7 | 3.7 |
| 100 | 181 | 17.2 | 3.3 | |
| 300 | 117 | 15.9 | 2.5 | |
| NW–BTO 1:5 |
10 | 227 | 9.4 | 2.2 |
| 100 | 200 | 9.2 | 1.9 | |
| 300 | 132 | 8.9 | 1.6 | |
Detailed magnetic studies of samples NP and NW were previously analyzed, published in 2019.28 Compared to NP and NW, magnetoelectric composites NP–BTO 1:1 and NW–BTO 1:1 show an evident decrease of the MS, MR and HC values, which is due to the diamagnetic BTO nanoparticles present in these samples.21,47 On increasing the wt% of BTO, MS and MR decrease at all temperatures for both NP–BTO and NW–BTO series, as expected. However, in both the series, M–H at all temperatures shows an abnormal trend of HC with an increase in the BTO wt% (see Tables 1 and 2). From this, it is evident that the ferroelectric phase BTO plays a critical role to increase the coercive field. To visualize the increment in the coercive field, a comparative plot of the M–H loops for both series is depicted in Fig. 7(a) and (c). For better clarity, Fig. 7(b) and (d) present the zoomed portion of the M–H loops at 10 K for the NP–BTO series and NW–BTO series, respectively. In both cases, HC increases, and MR decreases with the increase of the BTO content. Also, the room temperature HC of 133 Oe obtained for composite NP–BTO 1:5 is greater than that of the HC value of purely ferromagnetic sample NP (HC = 120 Oe for NP) itself. In the case of the NW–BTO series, there is a gradual increase of the coercivity with an increase in the BTO concentration (i.e., from 113 Oe to 132 Oe). Even though these changes observed in the coercivities are small, these results are reliable, since we have ironed out possible sources of error. In a standard procedure before the actual measurement, we have characterized the remnant field and corrected the absolute field error using a standard paramagnetic sample palladium (details are given in the supporting information). That means, the unusual nature of increasing HC with an increment in the BTO content is observed in both cases. This observation solicits more investigation and understanding of the underlying phenomena.
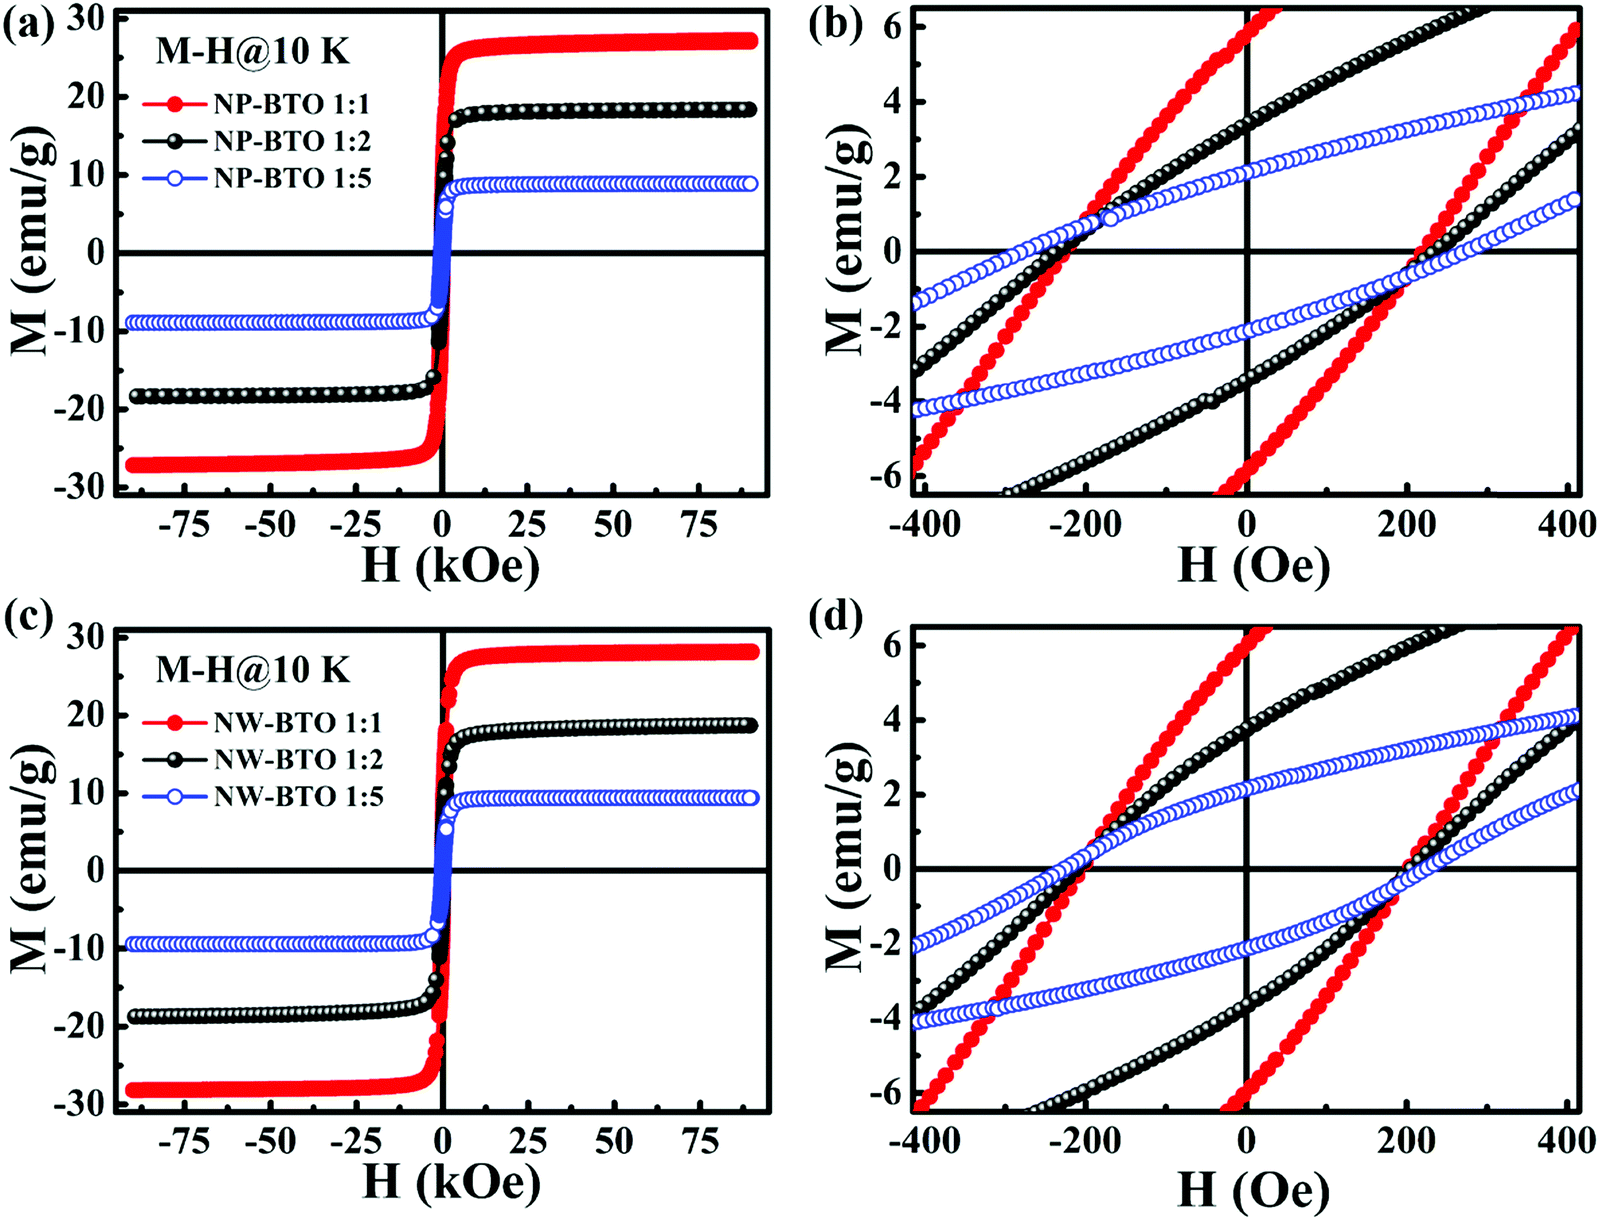 | ||
| Fig. 7 Comparison of the M–H loops at 10 K for the (a) NP–BTO composites and (c) NW–BTO composites, (b) zoomed-in portion of (a), and (d) zoomed portion of (c). | ||
In 2009, Mangalam et al. observed the weak ferromagnetic nature of BTO nanoparticles.48 This is unusual since Ti in BTO is in the d0 state, which has to be modified to a partially filled state somehow in order to show even weak ferromagnetism. As reported in ref. 48, defect induced weak ferromagnetism of BTO nanoparticles is due to the presence of oxygen vacancies at the nanoparticle surface. A positron annihilation study of BTO nanoparticles has confirmed the presence of oxygen vacancies.49 Each vacancy of oxygen can donate two electrons to the d0 state of a Ti4+ ion and form Ti2+ with a d2 electronic configuration. Sometimes, each electron of oxygen can go to two different Ti4+ ions and produce two Ti3+ ions having a d1 configuration.48,50 A particle size reduction causes an increase in oxygen vacancies, thereby increasing the number of Ti2+ and Ti3+ ions. Thus the increase in Ti ions with partially filled d orbitals gives a nonzero magnetic moment and produces weak ferromagnetism.51 Later in 2013, Phan et al. reported ferromagnetism in BTO nanoparticles formed by mechanical ball milling, and they observed that the ferromagnetic order increases with the increase in the milling time from zero hours to six hours.52 Also, they confirmed the FM nature of the ball-milled BTO samples using electron spin resonance (ESR) spectroscopy.52 Recently, Rubavathi et al. investigated the influence of the Ba/Ti ratio on the exhibition of weak ferromagnetism in BTO and found that the Ti-deficient sample with a Ba/Ti ratio greater than one exhibits weak ferromagnetism.53
In the present study, BTO samples having an average particle size of 60 nm were used for making ME composites, which show a diamagnetic nature (see the plot labelled as BTO in Fig. S3, ESI†). However, during the synthesis of the ME composites, the Ni and BTO samples were thoroughly ground. According to a previous report by Phan et al.,52 there is a chance of getting weak ferromagnetism in BTO present in the ME composites, giving rise to exciting magnetic properties. Furthermore, the atomic percentage of the Ni–BTO ME composites obtained from EDS confirms the Ti deficiency. As a consequence, there is a chance of the formation of weak ferromagnetism in BTO present in the ME composites.53 Hence, in order to find out the reason for the observation of the unusual nature of increasing HC with the increment of the BTO content, a detailed magnetic study of BTO nanoparticles ground for different durations is necessary. The BTO nanoparticles were ground for different durations, 10 minutes, 30 minutes and 60 minutes, and these samples are labelled as BTO 10, BTO 30, and BTO 60, respectively. Fig. S3 (ESI†) shows the comparison of a full loop taken in the field range −50 kOe to 50 kOe for the unground BTO, BTO 10, BTO 30 and BTO 60 samples. Among these, BTO shows a diamagnetic nature, but all the more ground samples show a weak ferromagnetic nature. For studying the ferromagnetic nature of the ground BTO nanoparticles in detail, M–H loops were taken at different temperatures in the range −4000 Oe to +4000 Oe for the BTO 10, BTO 30 and BTO 60 samples, and are shown in Fig. 8(a)–(c). The obtained values of HC, MS and MR are tabulated in Table 3. A comparison of the M–H loops at 10 K for the ground BTO samples is shown in Fig. 8(d), which clearly shows that BTO 60 has the highest MS. From Table 3, it is understood that on increasing the grinding time MS increases, which indicates that the ferromagnetic order increase with grinding time.52
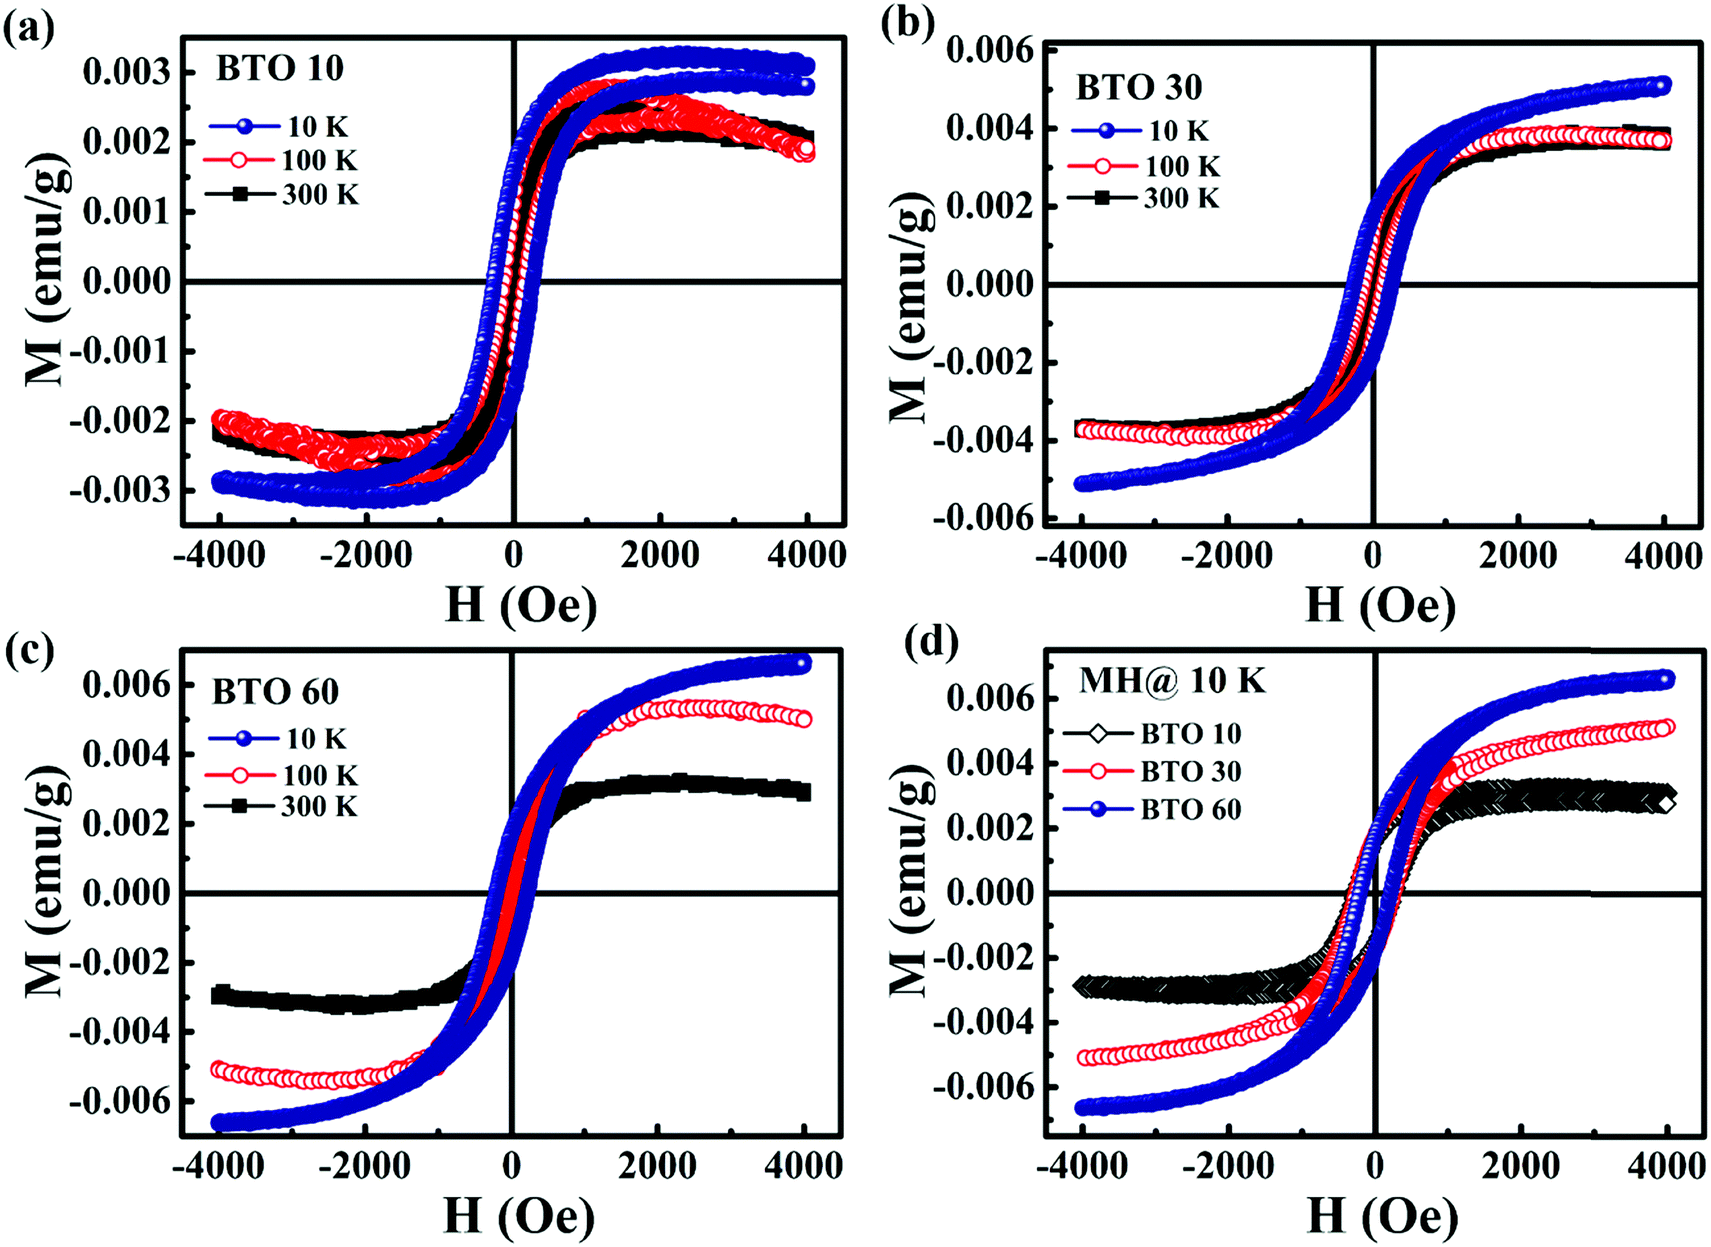 | ||
| Fig. 8 M–H loops of the ground BTO samples (a) BTO 10, (b) BTO 30 and (c) BTO 60 and (d) comparison of the M–H loops at 10 K. | ||
| Sample | T (K) | H C (Oe) | M S (emu g−1) | M R (emu g−1) |
|---|---|---|---|---|
| BTO 10 | 10 | 274 | 0.0033 | 0.0016 |
| 100 | 142 | 0.0027 | 0.0011 | |
| 300 | 42 | 0.0024 | 0.0005 | |
| BTO 30 | 10 | 268 | 0.0051 | 0.0018 |
| 100 | 141 | 0.0038 | 0.0013 | |
| 300 | 41 | 0.0032 | 0.0006 | |
| BTO 60 | 10 | 212 | 0.0067 | 0.0017 |
| 100 | 106 | 0.0054 | 0.0012 | |
| 300 | 33 | 0.0037 | 0.0004 | |
In the present investigation, Ni–BTO ME composites were prepared by grinding Ni samples with BTO for 60 minutes. The weak ferromagnetic nature of ground BTO in the ME composites is attributed to the Ti deficiency and the formation of the Ti3+ oxidation state. The formation of the Ti3+ state in the Ni–BTO composites is further confirmed from the XPS analysis (see Fig. S4 in the ESI†). In both NP–BTO 1:1 and NW–BTO 1:1, the deconvoluted XPS spectra of Ti 2p3/2 show a mixed oxidation state of Ti3+ (near 457.8 eV), and Ti4+ (near 458.1 eV).54 Here, the BTO sample ground for 60 minutes shows a room temperature HC of 33 Oe, while the FM phases NP and NW have a room temperature HC of 120 Oe and 140 Oe, respectively. Due to the appropriate difference in coercivity of the FM and FE phases, the prepared composites NP–BTO and NW–BTO can act as composites with the magnetic component being a combination of hard and soft magnets. It is well known that, nickel is a soft magnetic material, whereas hard magnets are mostly intermetallic alloys. However, in the present case, NP and NW can be assumed as relatively hard ferromagnetic phases, whereas BTO acts as a soft phase since BTO has much less coercivity than NP and NW. Hence an exchange-spring mechanism (ESM) is possible in these ME composites.
Usually, an ESM is observed in hard–soft magnetic composites and the exchange-spring magnets possess large magnetic energy product (BH)max.55 In 2019, Pattanayak et al. reported an ESM in ME composite BaFe12O19–Na0.5Bi0.5TiO3,56 which was the first-ever report of the observation of an ESM in magnetoelectric composites, and they explained the mechanism of the ESM in ME composites. A schematic representation of the ESM in the Ni–BTO composites is depicted in Fig. 9. As reported in ref. 56, soft magnetic moments can slightly rotate on the application of a small external magnetic field (H), but hard magnetic moments remain unvaried (see Fig. 9(b)). Due to the exchange coupling, the magnetic moments of soft and hard phases act as a spring at the hard/soft interface.57 On again increasing the magnetic field, the soft magnetic moments rotate completely to the downward direction due to the increase of the exchange energy density (see Fig. 9(c)). However, the hard magnetic moments do not rotate until the exchange energy density is comparable to the anisotropy energy density, which can occur only under the application of a high external field (see Fig. 9(d)). Hence HC of hard materials is increased.56 These results suggest that the observed increasing trend of HC in ME composites NP–BTO and NW–BTO is attributed to an ESM between Ni and BTO. So the present work provides novel insight on the ESM in the Ni–BTO magnetoelectric composite system.
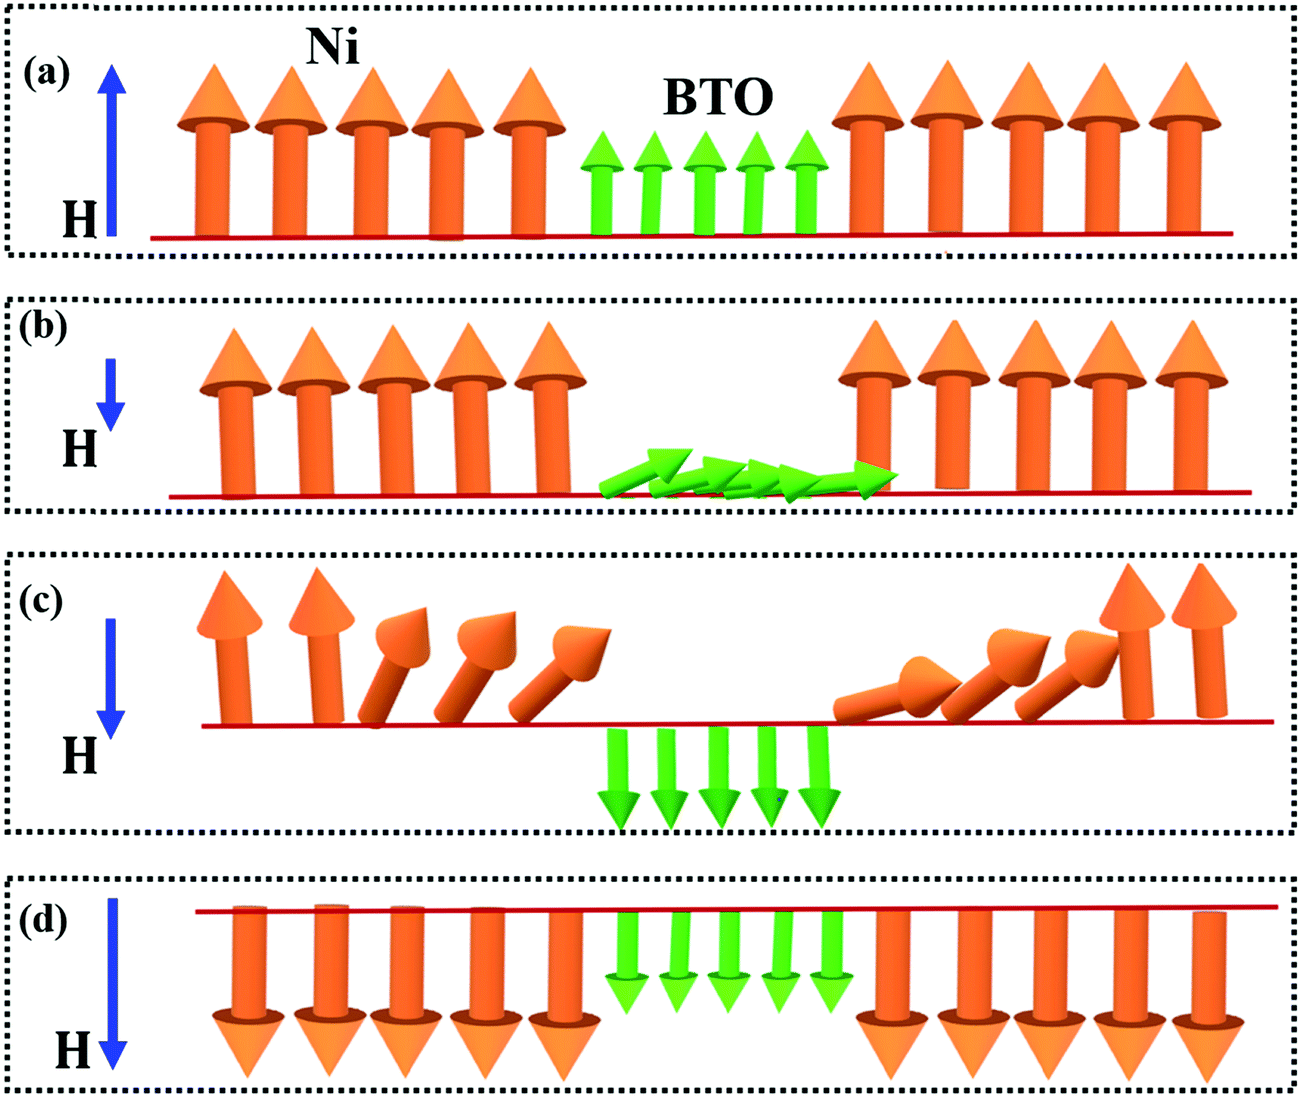 | ||
| Fig. 9 Schematic representation of the ESM in the Ni–BTO composites. | ||
In order to study the temperature dependent magnetic properties, we have taken NP–BTO 1:1 and NW–BTO 1:1 as representative of the NP–BTO and NW–BTO series, respectively. The magnetization versus temperature (M–T) curve was recorded using zero-field-cooled (ZFC) and field-cooled (FC) modes in the temperature range, 300 K to 950 K. Fig. 10(a) and (b) show the M–T curves for NP–BTO 1:1 and NW–BTO 1:1, respectively, and both reflect the ferromagnetic nature. The ferromagnetic to paramagnetic transition temperature, TC, was calculated from the derivative dM/dT. The obtained TC for NP–BTO 1:1 is 625 K (shown in the inset of Fig. 10(c)) and 617 K for NW–BTO 1:1 (see the inset of Fig. 10(d)). The inverse susceptibility (1/χ) versus temperature plots, called Curie–Weiss (C–W) plots, taken at a field of 10000 Oe for NP–BTO 1:1 and NW–BTO 1:1, are shown in Fig. 10(c) and (d), wherein the paramagnetic region of the CW plot is fitted using the CW law. Sample NP–BTO follows the C–W law, but the C–W plot of NW–BTO 1:1 shows a small deviation from the C–W law even at a higher field of 10000 Oe. For further analyzing the behaviour of the magnetic spins in the PM region, we have to consider the C–W plot taken at different magnetic fields lower than 10000 Oe.
 | ||
| Fig. 10
M–T curves at different magnetic fields for (a) NP–BTO 1:1 and (b) NW–BTO 1:1, and C–W plot and linear fit in the PM region of samples (c) NP–BTO 1:1 and (d) NW–BTO 1:1 (the inset of (c and d) shows the dM/dT versus T plot). | ||
The C–W plots at different applied magnetic fields of 100 Oe, 1000 Oe, and 10000 Oe for NP–BTO 1:1 and NW–BTO 1:1 are depicted in Fig. 11(a) and (b), respectively. A clear deviation from the C–W law is noticed for lower fields below a certain temperature. This observation suggests the occurrence of Griffiths-like phase (GP).58,59 The GP phenomenon was first proposed for randomly diluted Ising ferromagnets, which possess magnetic spins only in a fraction of the lattice, and the remaining portion is either occupied with non-magnetic atoms or remains vacant.59 Based on the theory of Griffiths, there is a finite probability of finding FM clusters within the paramagnetic matrix, in a temperature range Θ < T < TG, where Θ and TG are the Curie–Weiss temperature and Griffiths temperature, respectively. In this region, long-range FM order is nonexistent, which leads to the absence of spontaneous magnetization.60
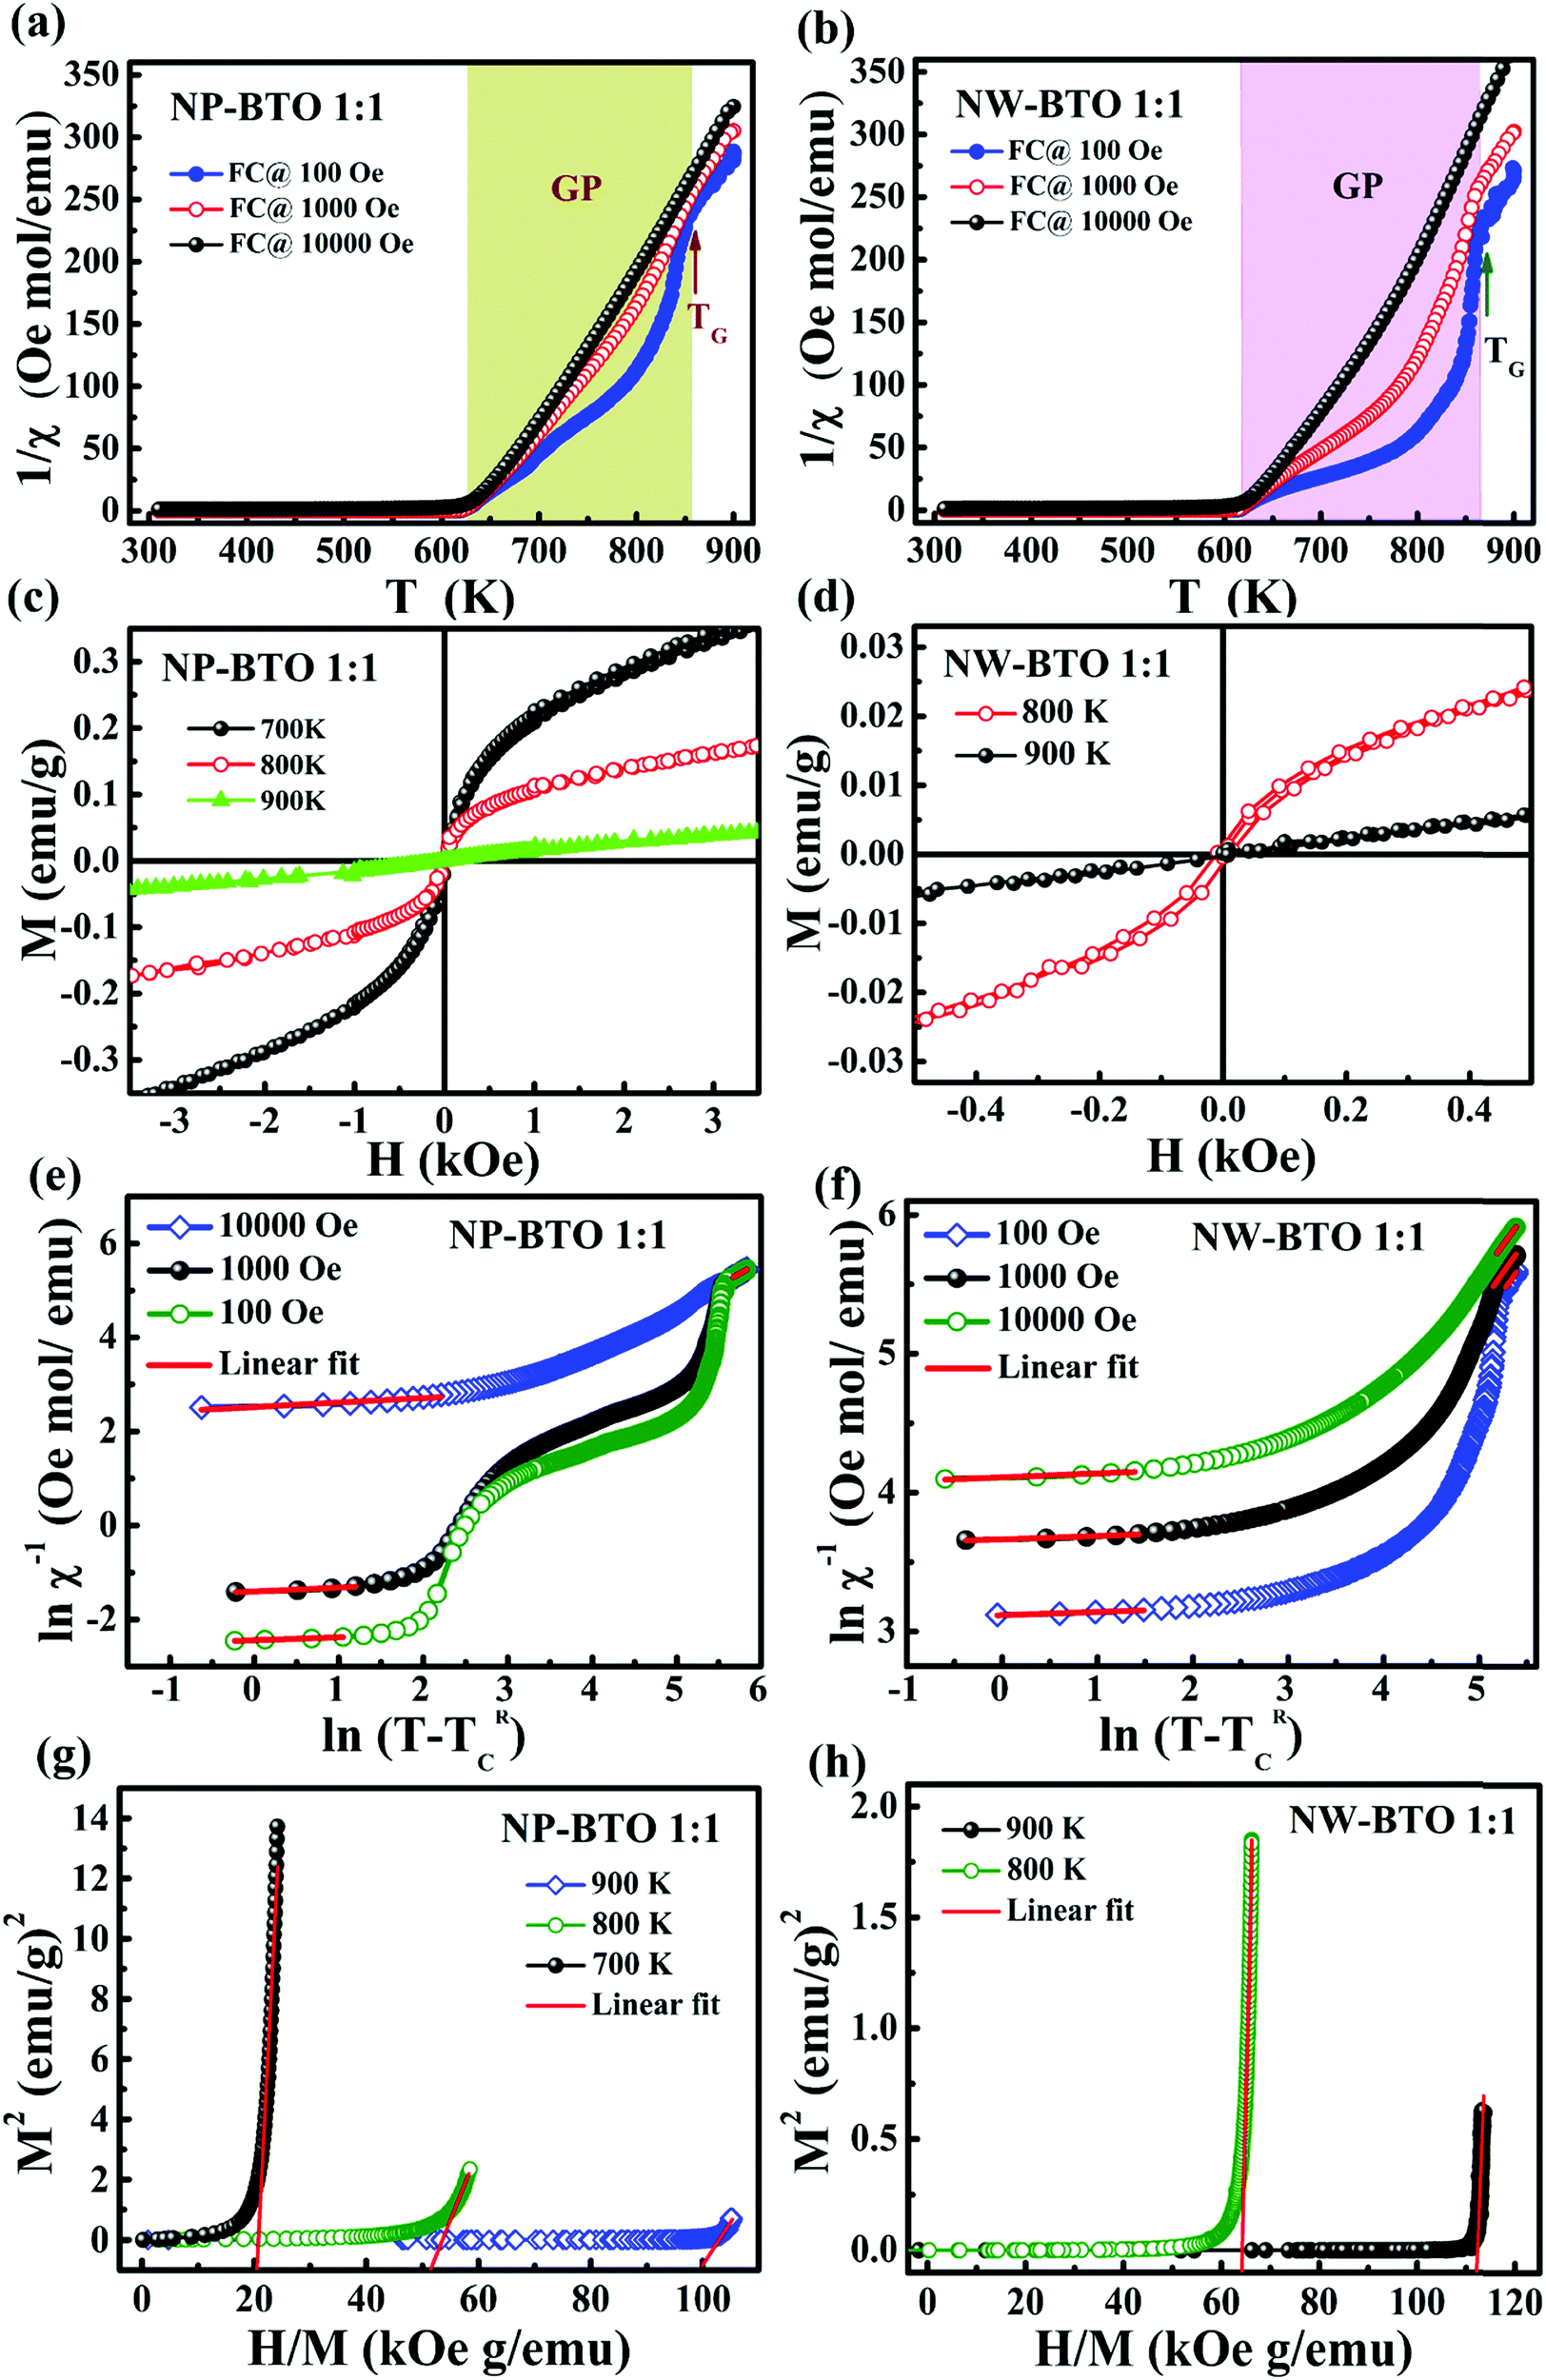 | ||
| Fig. 11 Curie–Weiss plots at different applied magnetic fields for (a) NP–BTO 1:1 and (b) NW–BTO 1:1, zoomed portion of the M–H loops at temperatures above TC for (c) NP–BTO 1:1 and (d) NW–BTO 1:1, Griffiths analysis of (e) NP–BTO 1:1 and (f) NW–BTO 1:1, and Arrott plots of (g) NP–BTO 1:1 and (h) NW–BTO 1:1. | ||
Later, Bray extended this explanation to show that the GP is supposed to be present in the temperature range TRC < T < TG, where TRC is the random critical temperature of FM clusters in which the susceptibility diverges.61 According to this, the GP is defined as the region between the ferromagnetically ordered states above TRC and the disordered state below TG, i.e., the GP is part of the PM phase, in which FM clusters are present. Recently, GP has been reported in AFM and FiM systems also.62,63 The GP is usually observed as a downturn in the C–W plot, above TC. At higher applied fields, the downturn anomaly disappears, and the inverse susceptibility obeys the C–W law. The temperature of deviation at the high temperature is referred to as the Griffiths temperature (TG), which is marked in Fig. 11(a) and (b). In both cases, we can see that there is more than one downturn, and the deviation from the C–W law disappears at higher field, which is a clear indication of a GP. More than one downturn in the GP regime indicates the presence of FM clusters with different sizes formed in the PM matrix.58 In NW–BTO 1:1, the GP is not completely suppressed even at a field of 10000 Oe (see Fig. 11(b)), indicating the strength of the GP.
Fig. 11(c) and (d) show the high-temperature M(H) measurements for NP–BTO 1:1 and NW–BTO 1:1 carried out using the VSM-oven set up attached to the PPMS system. For NP–BTO 1:1, the M–H loops taken at 700 K and 800 K show a ferromagnetic nature, while paramagnetic at 900 K (see Fig. 11(c)). But, TC obtained from the M(T) measurements is 625 K for NP–BTO 1:1, which means that, after 625 K, the system shows a PM nature. However, the M–H loops at 700 K and 800 K clearly indicate the presence of FM clusters after TC. The paramagnetic nature of the M(H) data observed at 900 K indicates the suppression of the GP at a temperature between 800 K and 900 K. Similar results were obtained for NW–BTO 1:1 as well (see Fig. 11(d)). This FM behaviour above TC in both samples confirms the existence of the GP. Fig. S5 (ESI†) shows the C–W linear fit at 100 Oe, from which TG and Θ are calculated as 854.6 K and 589.5 K, respectively, for NP–BTO 1:1 and 864.7 K and 674.5 K, respectively, for NW–BTO 1:1. The GP in the Ni–BTO magnetoelectric multiferroic system is attributed to the AFM phase (NiO) embedded in the FM phase (Ni).27 Our previous study shows the formation of a Ni(OH)2 layer at the Ni–BTO interface in BTO decorated Ni nanowires, which represents the bonding of oxygen atoms at the interface.21 To substantiate the presence of an interfacial NiO layer, we performed XPS analysis (see Fig. S6, ESI†) for both the NP–BTO 1:1 and NW–BTO 1:1 samples. Fig. S6(b) and (c) (ESI†) show the peak fitted high-resolution XPS spectra of Ni in samples NP–BTO 1:1 and NW–BTO 1:1, respectively. In both cases, the peak at 851.6 eV corresponds to Ni, while the other peaks represent the Ni2+ oxidation state.54 Hence, we have ample proof that both the Ni0 and Ni2+ states coexist in the Ni–BTO ME composites. The presence of BTO in these ME composites prompts the minor oxidation of the nickel surface and the formation of the Ni2+ state. The curve fitted O 1s spectra of both samples show a peak at 531.2 eV representing the formation of OH− bonds, indicating the bonding of oxygen atoms at the Ni–BTO interface (see Fig. S6(d) and (e), ESI†). Hence, the Ba2+ ions in BTO are attracted towards the hydrated layer of Ni(OH)2 and form the Ni–O–Ba bond.64 So, the prepared Ni–BTO magnetoelectric system can form an interface of antiferromagnetic NiO. Hence, the GP in the Ni–BTO ME system is due to the presence of possible short-range FM and AFM clusters in the PM matrix.65
At low fields, the inverse susceptibility of the GP obeys power law 1/χ = (T − TRC)1−λ, in which λ is the susceptibility exponent (0 ≤ λ < 1). λ = 1 corresponds to the GP, and λ = 0 corresponds to the PM state, and Θ can be considered as TRC. The linear part of the ln(χ−1) vs. ln(T − TRC) plot is fitted using the power law, which is shown in Fig. 11(e) and (f). The slope of the ln(χ−1) vs. ln(T − TRC) plot gives λ values. In the GP regime, the slope of the fitted straight line gives an exponent λGP of about 0.941 for NP–BTO 1:1 and 0.977 for NW–BTO 1:1 at 100 Oe. These λGP values near 1 give additional evidence of the existence of GP Ni–BTO ME composites. On applying fields of 10000 Oe, the estimated λPM values above TG are ∼0.01 and 0.03 for NP–BTO 1:1 and NW–BTO 1:1, respectively. This indicates that a higher magnetic field reduces the size of the FM/AFM clusters within the PM phase. But, at a field of 10000 Oe, the λGP values obtained are 0.904 for NP–BTO 1:1 and 0.971 for NW–BTO 1:1. This critical information, where the value of λ decreases with the increase of the external field, is the hallmark of Griffiths-like singularities.60 The high value of λGP obtained for both systems suggests the strength of the GP.66
Arrott plot (M2versus H/M) analysis is a standard way to establish the presence of FM nature.66 Arrott plots at 700 K, 800 K and 900 K, which is well above TC and below TG for NP–BTO 1:1, are shown in Fig. 11(g). The negative y-intercept (M2-axis intercept) obtained from the linear fit of the Arrott plot again confirmed the absence of spontaneous magnetization (MS = 0). Similar results were obtained for NW–BTO 1:1 (see Fig. 11(h)). Thus the observation of zero MS above TC in the Arrott plots additionally suggests peculiar GP formation in the Ni–BTO ME composites.
In order to confirm the AFM interface formation, field cooled (FC) measurements of the Ni–BTO samples were carried out since the presence of an FM–AFM interface leads to exhibiting the exchange bias (EB) phenomenon. EB is observed when a material having an FM–AFM interface is cooled to a temperature below the Néel temperature (TN) of the AFM through TN where TC of the FM should be greater than TN. During field cooling, AFM moments align parallel to nearby FM moments and an anisotropy is induced at the interface. The unidirectional anisotropy creates a loop shift to the left or right.67,68 Hence EB is the outcome of exchange anisotropy between two magnetic materials with competing interactions. However, unusual EB is reported in some systems with an FM–perovskite oxide interface69 and perovskite like BTO is suitable for creating competing interactions at the interface.70 Here, we have observed an unexpected exchange coupling between Ni and BTO. Fig. 12(a) shows the FC M–H loop of NP–BTO 1:1 taken at 10 K by providing a 20 kOe cooling field, while Fig. 12(b) depicts the zoomed-in portion of the loop. The M–H loop was shifted to the left side with HC1 = 240 Oe and HC2 = 203 Oe, and the shift is in the opposite direction to the cooling field. Thus NP–BTO 1:1 shows negative exchange bias below TN of the system.
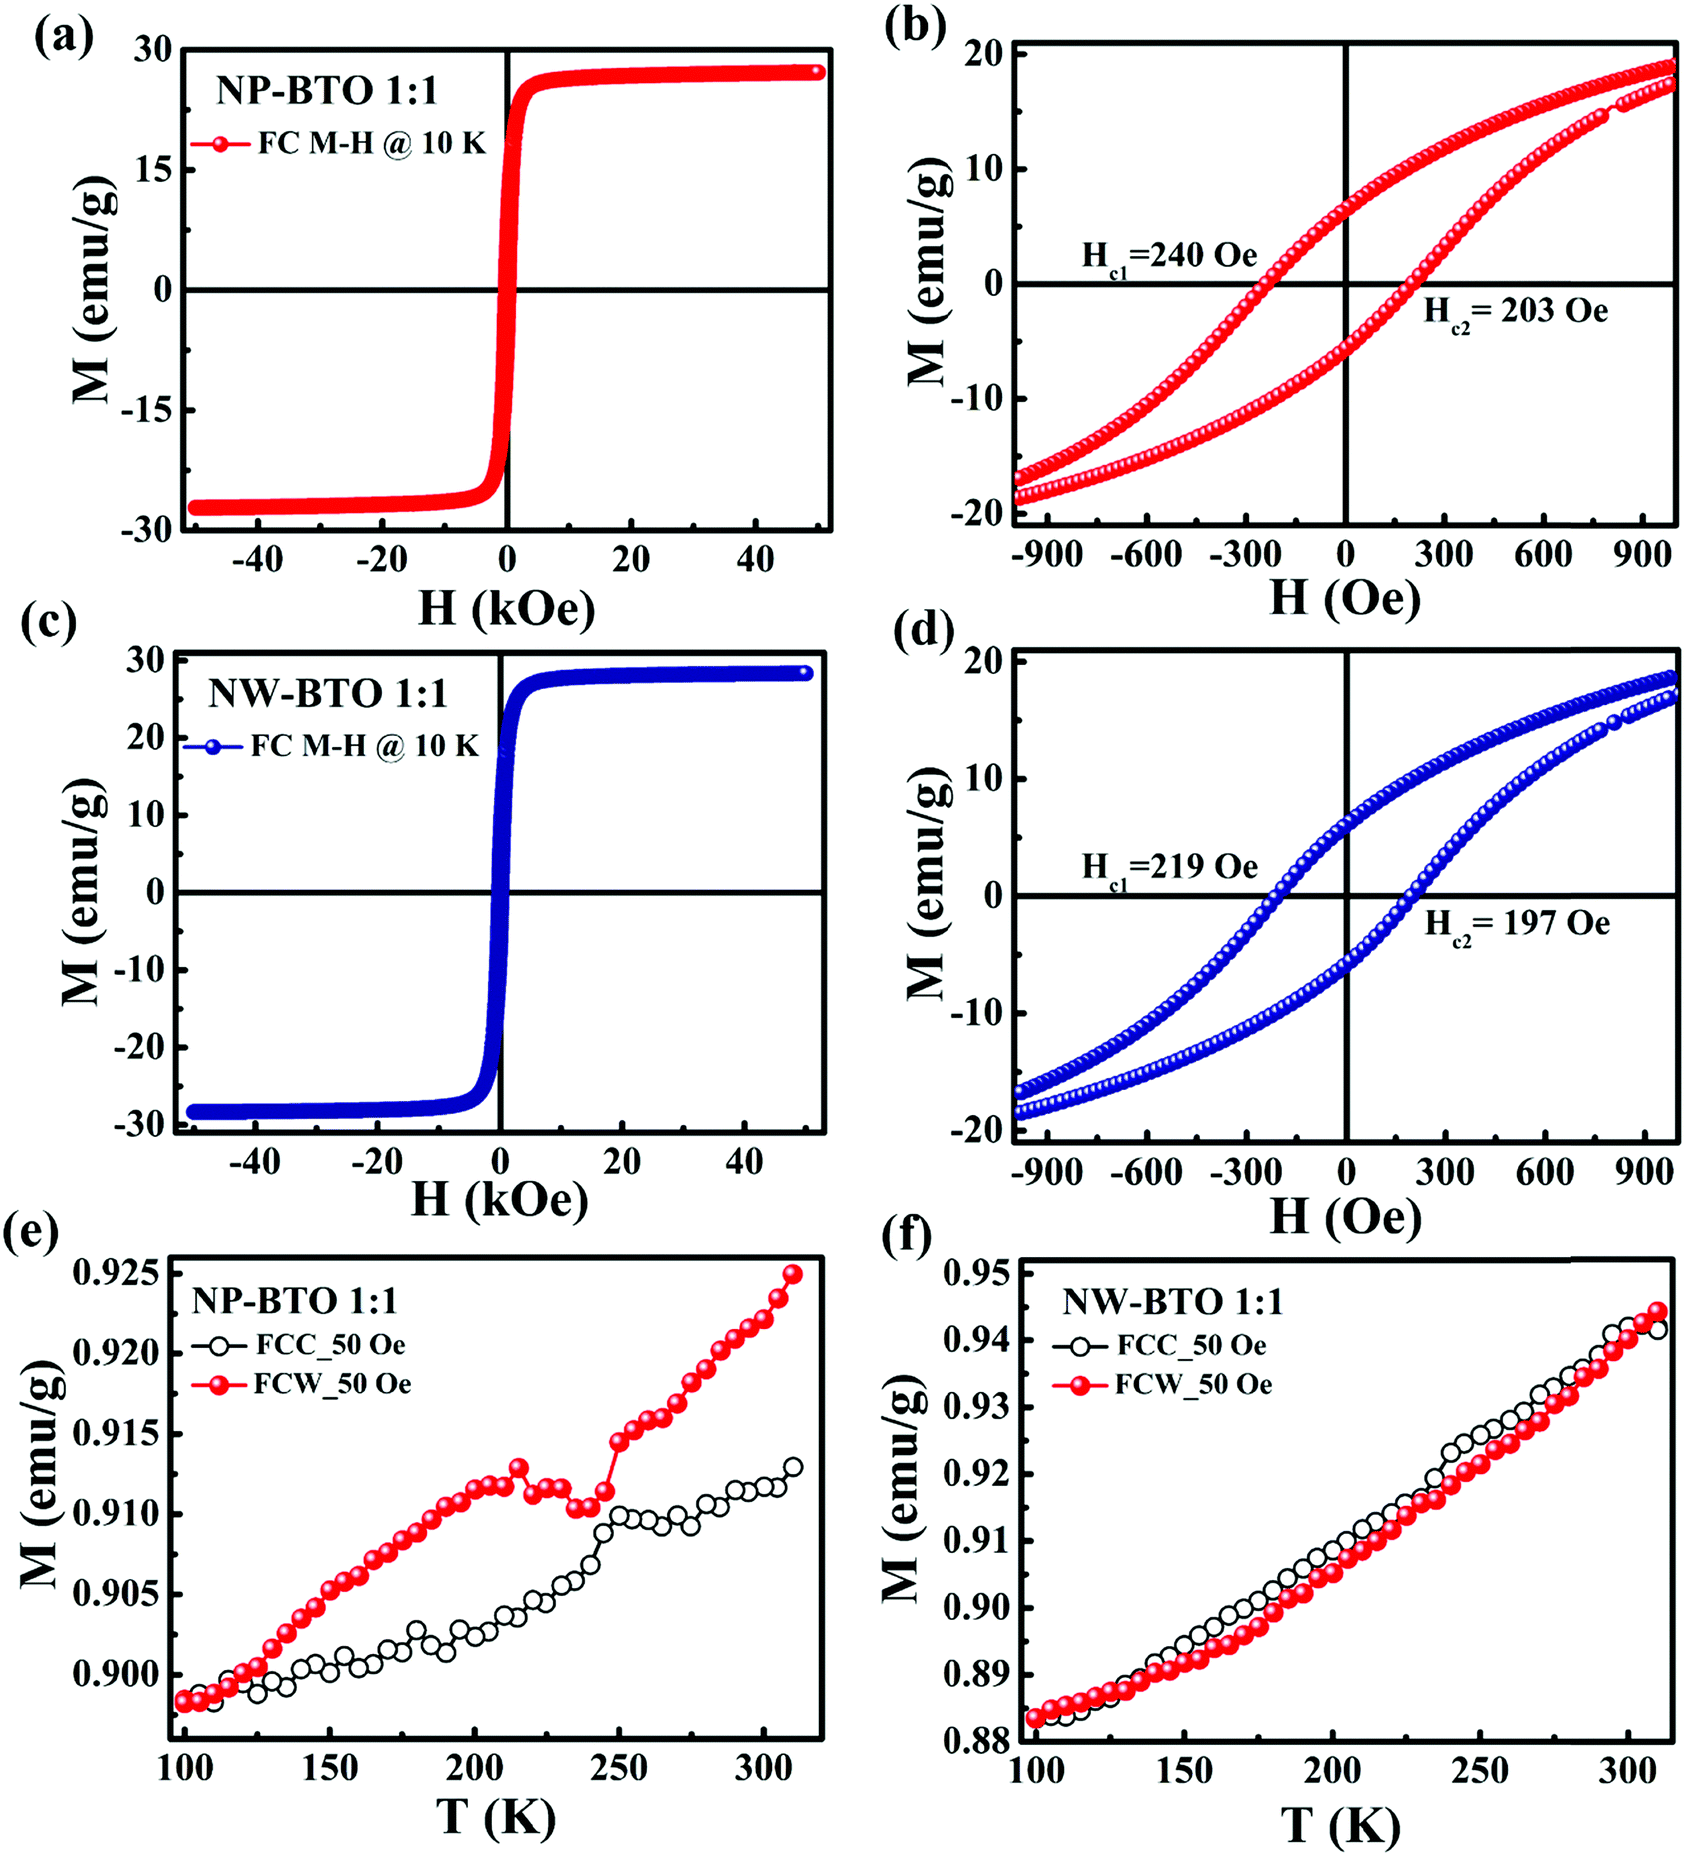 | ||
| Fig. 12 FC M–H loops at 10 K for (a) NP–BTO 1:1 and (c) NW–BTO 1:1, (b) zoomed portion of (a), (d) zoomed-in portion of (c), and FCC and FCW measurements from 100–310 K at 50 Oe for (e) NP–BTO 1:1 and (f) NW–BTO 1:1. | ||
Similar negative exchange bias with HC1 = 219 Oe and HC2 = 197 Oe is observed in NW–BTO 1:1 (see Fig. 12(c) and (d)). In 2014, EB in the Fe/BTO interface was reported by Paul et al.70 They observed that the magnetism due to the formation of FeO at the interface is responsible for such exotic EB phenomena. The oxygen in BTO can result in creating an AFM NiO layer at the Ni–BTO interface. A similar effect has been reported at the Fe/MgO and Fe/BTO interfaces.69,70 Also, an increase in the EB field (HEB) with increasing thickness of BTO was reported in the Fe/BTO system,70 which is due to (i) AFM layer thickness variations at the interface or (ii) structural changes at the FM/BTO interface. Hence the observation of EB in the Ni–BTO composites confirmed the formation of NiO, and the presence of the FM–AFM–FE (Ni–NiO–BTO) interface indicates the coupling between AFM NiO and BTO. The AFM interaction reconfirms the observation of the GP in the Ni–BTO composite systems.
It is well-known that BTO exhibits different structural transitions. For testing these structural changes at the Ni–BTO interface, we have conducted M(T) measurements in FCC (field cooled cooling) and FCW (field cooled warming) modes at a field of 50 Oe from 100 K to 310 K, as shown in Fig. 12(e) and (f). In the case of NP–BTO 1:1, the M–T data in the temperature range 125–240 K indicate a discontinuity in the magnetization. The temperature ranges in which thermal hysteresis is observed are around the reported values of the rhombohedral to orthorhombic transition of BTO.71 In Fig. 12(e), above 250 K, the M–T data shows bifurcation, which represents the orthorhombic to tetragonal transition of BTO. Borges et al. reported similar observations in Fe ion implanted BTO single crystals and verified the above mentioned structural transitions of BTO through magnetic measurements.71 Similarly, small discontinuities in magnetization are observed in the case of NW–BTO 1:1 from 130–240 K and 240–310 K (see Fig. 12(f)). We have performed FCC and FCW measurements for the ground BTO sample BTO 60 also, since it exhibits weak ferromagnetism (see Fig. S7, ESI†). However, we could not observe evident thermal hysteresis in the M–T data near the structural transition temperatures of BTO. Hence these observations of thermal hysteresis in the Ni–BTO composites near the transition temperatures indirectly indicate ME coupling between Ni and BTO.71
3.4. Magnetoelectric measurements
The magnetoelectric effect in ME composites is obtained due to the interaction of magnetic and ferroelectric phases present in the system. Here direct ME coupling analysis was carried out to check the coupling between the magnetostrictive Ni and piezoelectric BTO phases present in both sets of samples. In the ME measurements, an alternating magnetic field (HAC) was applied to modulate the FM phase. The applied magnetic field induces a strain in the FM domains. As a result, strain-mediated stress is developed in the FE domains, which creates ferroelectric polarization in the piezoelectric phase.72 The corresponding voltage developed was measured using a lock-in amplifier. Since the ME coupling in the FM–FE composite is strain mediated, the area of contact between the FM and FE phases plays an important role.ME measurements have been carried out using 850 Hz HAC, by varying the magnetic field from 0 Oe to 80 Oe, by keeping the DC bias field (HDC) constant at 1 kOe. The obtained ME voltage (Vout) increases in a linear manner with HAC,73 and the linear coupling coefficient is  , where t is the thickness of the measured sample. The variation of the ME voltage with the applied HAC for both sets of ME composites is plotted in Fig. 13(a) and (b). The ME coupling coefficient can be calculated from the slope of the linear portion of the graph. The obtained values of α are tabulated in Table 4.
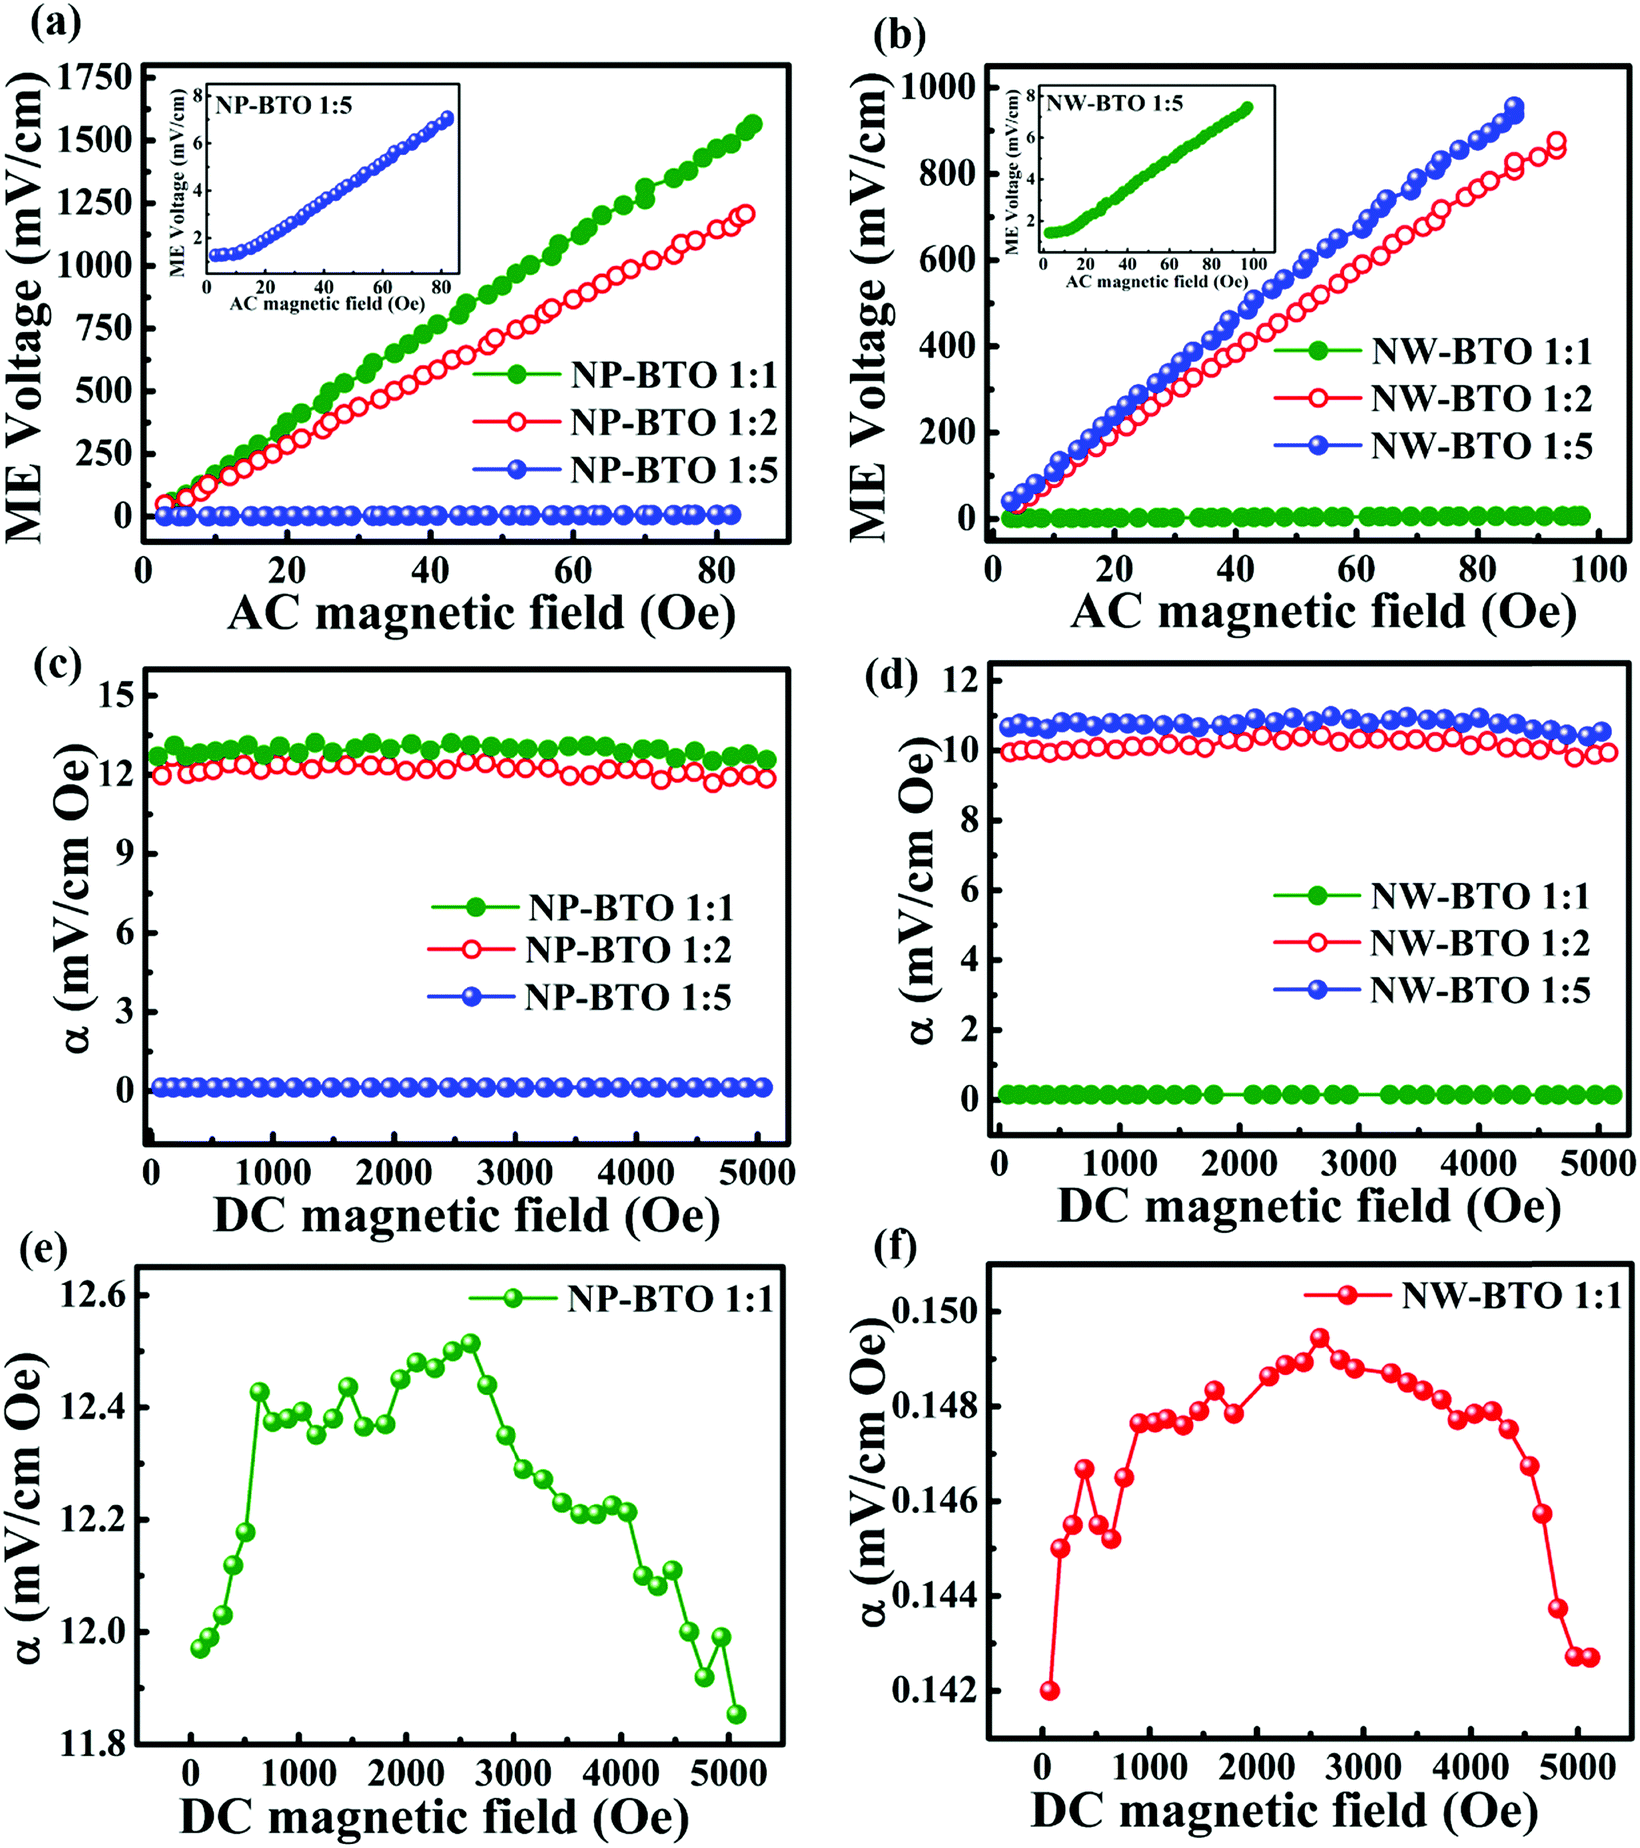 | ||
| Fig. 13 Variation of the ME voltage with the AC magnetic field for (a) NP–BTO series and (b) NW–BTO series, and the variation of the ME coupling coefficient with the DC magnetic field in (c) the NP–BTO series, (d) the NW–BTO series, (e) NP–BTO 1:1 and (f) NW–BTO 1:1. | ||
| Sample code | ME coupling coefficient (α) (mV cm−1 Oe−1) |
|---|---|
| NP–BTO 1:1 |
18.53 |
| NP–BTO 1:2 |
14.56 |
| NP–BTO 1:5 |
0.08 |
| NW–BTO 1:1 |
0.07 |
| NW–BTO 1:2 |
9.51 |
| NW–BTO 1:5 |
10.91 |
For the investigated ME composites of the NP–BTO series, the maximum value of α = 18.53 mV cm−1 Oe−1 is observed for the composites with a 1:1 ratio, and, further, the ME coupling is reduced with increasing BTO content. The ME coupling in magnetoelectric composites depends on the magnetostriction of the FM phase and piezoelectricity of the FE phase.72 In ME composites, a low fraction of FM phase results in the reduction of magnetostriction, and also a small amount of FE phase leads to the reduction of piezoelectricity. Nan theoretically predicted that the reduction of both piezoelectricity and magnetostriction causes the lowering of magnetoelectric coupling.74 In the case of the NP–BTO series, on increasing the Ni:BTO ratio from 1:1 to 1:5, the increase in BTO leads to the reduction of magnetostriction due to the lower amount of FM phase Ni. Hence the reduction of α in the NP–BTO series as a function of BTO is justified.
In the case of the NW–BTO series, on the other hand, the coupling coefficient increases as a function of BTO addition, where the maximum α is achieved for the NW–BTO 1:5 sample. Usually, the cross-coupling in ME composites depends on the properties of both the FE and FM phases, interfacial conditions, phase fraction, connectivity, wt% or volume concentration and shape of inclusion.75 In 2015, Wang et al. studied the aspect ratio (length to diameter ratio of the spheroidal inclusion phase) dependence of ME coupling in the CFO–BTO composite model and found that the spheroidal inclusion phase having elongated shapes such as ellipsoids, rods, or wires provides stronger ME coupling.75 The aspect ratio is represented as zero for 2–2 connectivity, greater than zero for 0–3 connectivity and infinity for 1–3 connectivity.75 Also, Wang and co-workers reported that CFO-in-BTO composites have a larger α than BTO-in-CFO composites, i.e., the composites with BTO as the matrix can provide the stronger ME coupling.75
Usually, in FM–FE composite systems, the ME coupling coefficient reaches a maximum value for a specific ferroic phase fraction. Yang et al. theoretically studied the phase fraction dependence of α in the CFO–BTO composite system and observed that, on increasing the aspect ratio, the phase fraction for the maximum α shifts towards the BTO rich phase.76 Since the aspect ratio is larger for composites with 1–3 connectivity, the maximum ME coupling is obtained for BTO rich 1–3 composite.76 In the present case, the NP–BTO composites with 0–3 connectivity exhibit a maximum α for a 1:1 phase fraction of Ni and BTO. Meanwhile, in the case of NW–BTO with 1–3 connectivity, the phase fraction for which the maximum α is obtained is the NW–BTO 1:5 sample since it is the BTO rich composite. This is attributed to the relatively large magnetostriction and high interface area in the 1–3 connected systems. Due to the large aspect ratio, the 1–3 composites possess high magnetic anisotropy and magnetostriction, and hence the resulting strain developed is high.76 The maximum ME coupling is attributed to the maximum area of contact between the FM and FE phases.77 On increasing the phase fraction of BTO, the interfacial area of contact between one dimensional Ni and zero-dimensional BTO increases such that the strain mediated stress in the BTO domains is improved.74,76 Hence, enormous strain transfer occurs in the NW–BTO composites, which causes the increase of the ME coupling coefficient as a function of BTO and obtains a maximum of 10.91 mV cm−1 Oe−1. From Fig. 13(a) and (b) it is also observed that NP–BTO 1:1 and NW–BTO 1:5 have developed adequate ME voltages of 75 mV cm−1 and 65 mV cm−1, respectively, even at a feeble HAC of 5 Oe. At a field of 80 Oe, the generated voltage becomes 1.5 V cm−1 and 0.87 V cm−1, respectively, for NP–BTO 1:1 and NW–BTO 1:5.
Fig. 13(c) and (d) present the combined plots of the variation of the ME coupling coefficient with HDC, and a separate plot is shown in Fig. 13(e) and (f). For this, HDC was varied from 0 to 5000 Oe in the presence of HAC = 10 Oe and the corresponding ME voltage generated has been detected. The peak points of the above plots gave the value of α, which is in agreement with the value obtained from Fig. 13(a) and (b). The AC and DC field measurements reveal the same trends for ME coupling with the BTO phase fraction. From Fig. 13(e) and (f), it is clear that the ME composite shows a decrease in α with the increase of HDC beyond 2500 Oe. Since the ME coupling is the derivative of the piezomagnetic strain in the FM phase, the change in magnetostriction of Ni is directly reflected in the ME coupling.8 Usually, the magnetostrictive coefficient (λ) achieves saturation at a certain HDC. So, beyond that field, the magnetostriction and the corresponding induced strain can develop a constant electric field in the piezoelectric phase, i.e., dE/dH decreases with increasing field beyond a critical field.78 Hence the value of α decreases after that critical field. The change in λ with the applied magnetic field can be found from the virgin curve of the M–H loop using the relation  and is shown in Fig. S8 (ESI†). From Fig. 13(e) and (f) and Fig. S8(a) and (b) (ESI†), it is evident that there is a mutually agreeing trend for the variation of the ME coupling coefficient and the magnetostrictive coefficient.
The previously reported values of α in BTO–Ni heterostructures were not appreciably high. A comparison of the obtained ME coupling coefficients with previous reports is tabulated in Table S1 (ESI†). In 2008, Qiao et al. described the ME coupling in BTO–Ni thin films.79 Later α of screen-printed BTO–Ni thick films was reported by Hao et al., and obtained as 7 μV cm−1 Oe1.80 In 2020, we reported the ME coupling in BTO decorated hierarchical Ni nanowire assemblies and obtained an α of 517 μV cm−1 Oe−1.21 Recently, Buttlar et al. reported ME coupling of microsized composite Nix–(BaTiO3)1−x and a maximum α of 4.8 mV cm−1 Oe−1, which is obtained for a composite with x = 0.4.6 Hence the presently obtained ME coupling coefficients for NP–BTO 1:1 and NW–BTO 1:5 are comparatively higher than those of reported particulate composite systems of Ni and BTO. The present demonstration of a consistent linear ME coupling coefficient and a relatively high ME voltage in Ni–BTO particulate composite systems offers numerous applications ranging from magnetoelectric field sensors to energy harvesters.
4. Conclusions
In the present investigation, ME composites were prepared by taking sea urchin-like Ni nanoparticles and hierarchical prickly Ni nanowires as the ferromagnetic constituents and BTO nanoparticles as the ferroelectric part, with different Ni:BTO ratios. As expected, the PR value of both the NP–BTO and NW–BTO series slightly increases as a function of BTO concentration. Due to the grinding of the Ni and BTO samples, weak ferromagnetism is induced in BTO present in the ME composites, and the ferromagnetic order increases with the increase in grinding time. Owing to the difference in the coercive fields of the Ni and BTO phases, the Ni–BTO ME structures act as a hard–soft magnetic composite and exhibit the exchange-spring mechanism. Due to the presence of short-range FM and AFM clusters in the PM matrix, the Ni–BTO composites show a peculiar Griffiths-like phase. The exchange bias shift observed in these Ni–BTO ME composites confirms the formation of an AFM layer of NiO at the Ni–BTO interfaces. An indirect implication of magnetoelectric coupling between Ni and BTO is given by the observation of structural transitions of BTO in the magnetic measurements of the Ni–BTO composites. The ME composites of the NP–BTO series show a maximum value of the coupling coefficient of 18.53 mV cm−1 Oe−1 for the composites with a 1:1 ratio, and, further, the ME coupling reduces as a function of the BTO content. Due to the large aspect ratio of the NW–BTO 1–3 composites, they possess high magnetostriction, which leads to a shift of the maximum value of the ME coupling coefficients towards the BTO rich sample NW–BTO 1:5. The obtained α values of the investigated composites fulfil the required criteria for potential magnetoelectric applications and could be used for room temperature magnetoelectric sensing and energy harvesting applications.
Conflicts of interest
There are no conflicts to declare.Acknowledgements
Author R. R. acknowledges the support of KSCSTE (Kerala State Council for Science, Technology and Environment), Kerala, India, for granting a Research Fellowship (No. 001/FSHP-MAIN/2015/KSCSTE). The authors acknowledge the measurement facilities obtained from different labs of CSIR-NIIST. The authors are grateful to Mr Rahul M. T., IIUCNN, Kottayam, for magnetoelectric measurements. Authors are incredibly thankful to Mr Thejas K. K. for the timely help for XRD measurements. Author M. R. V. is thankful to the Science and Engineering Research Board, Department of Science and Technology, New Delhi, India. Authors K. P. S. and M. R. V. are also thankful to the Council of Scientific and Industrial Research, New Delhi, for funding this research through a Niche Creating Project, MLP 0044.References
- H. Schmid, Ferroelectrics, 1994, 162, 317–338 Search PubMed.
- R. Ramesh and N. A. Spaldin, Nat. Mater., 2007, 3, 21–29 Search PubMed.
- J. Ma, J. Hu, Z. Li and C. Nan, Adv. Mater., 2011, 23, 1062–1087 Search PubMed.
- M. Bichurin, V. Petrov, S. Priya and A. Bhalla, Adv. Cond. Matter Phys., 2012, 2012, 129794 Search PubMed.
- C. W. Nan, Phys. Rev. B: Condens. Matter Mater. Phys., 1994, 50, 6082 Search PubMed.
- T. Buttlar, T. Walther, K. Dörr and S. G. Ebbinghaus, Phys. Status Solidi B, 2020, 1900622 Search PubMed.
- A. Manjeera, M. Vittal, V. R. Reddy, G. Prasad and G. S. Kumar, Ferroelectrics, 2017, 519, 15–22 Search PubMed.
- A. Hanumaiah, T. Bhimasankaram, S. V. Suryanarayana and G. S. Kumar, Bull. Mater. Sci., 1994, 17, 405–409 Search PubMed.
- T. Walther, U. Straube, R. Koferstein and S. G. Ebbinghaus, J. Mater. Chem. C, 2016, 4, 4792–4799 Search PubMed.
- Y. Huang, S. Chen and W. Tuan, J. Am. Ceram. Soc., 2007, 90, 1438–1443 Search PubMed.
- C. Pecharroman, F. Esteban-betegon, J. F. Bartolome, S. Lopez-esteban and J. S. Moya, Adv. Mater., 2001, 13, 1541–1544 Search PubMed.
- B. J. Lee, J. Lee and S. Hong, Adv. Mater., 2003, 15, 1655–1658 Search PubMed.
- Y. Il Shin, K. M. Kang, Y. G. Jung, J. G. Yeo, S. G. Lee and U. Paik, J. Eur. Ceram. Soc., 2003, 23, 1427–1434 Search PubMed.
- L. Lutsev, S. Yakovlev, V. Castel and C. Brosseau, J. Phys. D: Appl. Phys., 2010, 43, 325302 Search PubMed.
- S. Geprags, A. Brandlmaier, M. Opel, R. Gross, S. T. B. Goennenwein, S. Geprägs, A. Brandlmaier, M. Opel, R. Gross and S. T. B. Goennenwein, Appl. Phys. Lett., 2010, 96, 142509 Search PubMed.
- C. Brosseau and V. Castel, Spectrosc. Lett., 2012, 45, 471–476 Search PubMed.
- J. Q. Dai, H. Zhang and Y. M. Song, J. Magn. Magn. Mater., 2012, 324, 3937–3943 Search PubMed.
- W. Liang, Z. Li, Z. Bi, T. Nan, H. Du, C. Nan, C. Chen, Q. Jia and Y. Lin, J. Mater. Chem. C, 2014, 2, 708–714 Search PubMed.
- S. Siva Vadla, T. Costanzo, S. John, G. Caruntu and S. C. Roy, Scr. Mater., 2019, 159, 33–36 Search PubMed.
- T. Buttlar, T. Walther, K. Dörr and S. G. Ebbinghaus, Phys. Status Solidi, 2020, 1900622 Search PubMed.
- R. Revathy, A. Kaipamangalath, M. Raama Varma and K. P. Surendran, New J. Chem., 2020, 44, 3690–3699 Search PubMed.
- M. H. Abdellatif, C. Innocenti, I. Liakos, A. Scarpellini, S. Marras and M. Salerno, J. Magn. Magn. Mater., 2017, 424, 402–409 Search PubMed.
- N. Adeela, U. Khan, S. Naz, M. Iqbal, M. Irfan and Y. Cheng, Appl. Surf. Sci., 2017, 422, 184–191 Search PubMed.
- R. Revathy, M. R. Varma and K. P. Surendran, Phys. Status Solidi B, 2020, 2000341 Search PubMed.
- X. Zheng, T. Gao, W. Jing, X. Wang, Y. Liu, B. Chen, H. Dong, Z. Chen, S. Cao, C. Cai and V. V. Marchenkov, J. Magn. Magn. Mater., 2019, 491, 165611 Search PubMed.
- V. G. Prokhorov, G. G. Kaminsky, J. M. Kim, Y. J. Yoo, Y. P. Lee, V. L. Svetchnikov, G. G. Levchenko, Y. M. Nikolaenko and V. A. Khokhlov, Low Temp. Phys., 2012, 38, 413–418 Search PubMed.
- H. Singh, H. Ghosh, C. L. Prajapat and M. R. Singh, Mater. Res. Bull., 2016, 80, 273–279 Search PubMed.
- R. Revathy, M. Raama Varma and K. P. Surendran, Mater. Res. Bull., 2019, 120, 110576 Search PubMed.
- F.-S. Yen, H.-I. Hsiang and Y.-H. Chang, Jpn. J. Appl. Phys., 1995, 34, 6149–6155 Search PubMed.
- Z. Zhao, V. Buscaglia, M. Viviani, M. T. Buscaglia, L. Mitoseriu, A. Testino, M. Nygren, M. Johnsson and P. Nanni, Phys. Rev. B: Condens. Matter Mater. Phys., 2004, 70, 024107 Search PubMed.
- K. Uchino, E. Sadanaga and T. Hirose, J. Am. Ceram. Soc., 1989, 72, 1555 Search PubMed.
- J. Q. Qi, T. Peng, Y. M. Hu, L. Sun, Y. Wang, W. P. Chen, L. T. Li, C. W. Nan and H. L. W. Chan, Nanoscale Res. Lett., 2011, 6, 1–4 Search PubMed.
- M. Yashima, T. Hoshina, D. Ishimura, S. Kobayashi, W. Nakamura, T. Tsurumi and S. Wada, J. Appl. Phys., 2005, 98, 014313 Search PubMed.
- H. U. Anderson, J. Am. Ceram. Soc., 1973, 56, 605 Search PubMed.
- H. Arend and L. Kihlborg, J. Am. Ceram. Soc., 1969, 52, 63 Search PubMed.
- N. G. Eror and D. M. Smyth, J. Solid State Chem., 1978, 24, 235–244 Search PubMed.
- P. Erhart and A. Karsten, J. Appl. Phys., 2007, 102, 084111 Search PubMed.
- G. V. Lewis and C. R. A. Catlow, J. Phys. Chem. Solids, 1986, 47, 89 Search PubMed.
- N. X. Duong, J.-S. Bae, J. Jeon, S. Y. Lim, S. H. Oh, A. Ullah, M. Sheeraz, J. S. Choi, J.-H. Ko, S. M. Yang, K.-H. Kim, W. Kim, C. W. Ahn and T. H. Kim, Ceram. Int., 2019, 45, 16305–16310 Search PubMed.
- P. B. Belavi, G. N. Chavan, L. R. Naik, V. L. Mathe and R. K. Kotnala, IJSTR, 2013, 2, 298–306 Search PubMed.
- N. Wei, D. Zhang, F. Yang, X. Han, Z. Zhong and K. Zheng, J. Phys. D: Appl. Phys., 2007, 2716 Search PubMed.
- D. Ponnamma, N. Ninan and S. Thomas, Application of nanomaterials: Advance and key technologies, 2018, pp. 391–414 Search PubMed.
- Y. Tan, J. Zhang, Y. Wu, C. Wang, V. Koval, B. Shi, H. Ye, R. Mckinnon, G. Viola and H. Yan, Sci. Rep., 2015, 5, 9953 Search PubMed.
- V. R. Mundinepalli, L. Feng, W. Lin and B. S. Murty, J Adv. Ceram., 2015, 4, 46–53 Search PubMed.
- A. Gruverman and A. Kholkin, Rep. Prog. Phys., 2005, 69, 2443–2474 Search PubMed.
- I. Bibi, U. Ali, S. Kamal, S. Ata, S. M. Ibrahim, F. Majid, Z. Nazeer, F. Rehman, S. Iqbal and M. Iqbal, J. Mater. Res. Technol., 2020, 9, 12031–12042 Search PubMed.
- M. Rasly, M. Afifi, A. E. Shalan and M. M. Rashad, Appl. Phys. A: Mater. Sci. Process., 2017, 123, 331 Search PubMed.
- R. V. K. Mangalam, N. Ray, U. V. Waghmare, A. Sundaresan and C. N. R. Rao, Solid State Commun., 2009, 149, 1–5 Search PubMed.
- R. V. K. Mangalam, M. Chakrabarti, D. Sanyal, A. Chakrabati and A. Sundaresan, J. Phys.: Condens. Matter, 2009, 21, 445902–445906 Search PubMed.
- A. M. Stoneham, J. Gavartin, A. L. Shluger, A. V. Kimmel, R. D. Muoz, H. M. Ronnow, G. Aeppli and J. Renner, J. Phys.: Condens. Matter, 2007, 19, 255208 Search PubMed.
- S. G. Bahoosh, S. Trimper and J. M. Wesselinowa, Phys. Status Solidi RRL, 2011, 5, 382–384 Search PubMed.
- T. L. Phan, P. Zhang, D. S. Yang, T. D. Thanh, D. A. Tuan and S. C. Yu, J. Appl. Phys., 2013, 113, 17E305 Search PubMed.
- P. E. Rubavathi, M. Veera Gajendra Babu, B. Bagyalakshmi, L. Venkidu, D. Dhayanithi, N. V. Giridharan and B. Sundarakannan, Vacuum, 2019, 159, 374–378 Search PubMed.
- https://srdata.nist.gov/xpsx .
- H. Zeng, J. Li, J. P. Liu, Z. L. Wang and S. Sun, Nature, 2002, 420, 395–398 Search PubMed.
- R. Pattanayak, S. P. Ghosh and S. Panigrahi, J. Magn. Magn. Mater., 2019, 482, 14–19 Search PubMed.
- P. M. S. Monteiro and D. S. Schmool, Phys. Rev. B: Condens. Matter Mater. Phys., 2010, 81, 214439 Search PubMed.
- N. Marcano, P. A. Algarabel, L. F. Barquín, J. P. Araujo, A. M. Pereira, J. H. Belo, C. Magén, L. Morellón and M. R. Ibarra, Phys. Rev. B, 2019, 99, 054419 Search PubMed.
- R. B. Griffith, Phys. Rev. Lett., 1969, 23, 1–3 Search PubMed.
- A. K. Pramanik and A. Banerjee, J. Phys.: Condens. Matter, 2016, 28, 35LT02 Search PubMed.
- A. J. Bray, Phys. Rev. Lett., 1987, 59, 586–589 Search PubMed.
- M. K. Majee, P. A. Bhobe and A. K. Nigam, J. Magn. Magn. Mater., 2019, 485, 112–117 Search PubMed.
- D. Yang, P. Zhao, S. Huang, T. Yang and D. Huo, Results Phys., 2019, 12, 344–348 Search PubMed.
- Y. Hao, X. Wang, H. Zhang and L. Li, Jpn. J. Appl. Phys., 2015, 54, 015501 Search PubMed.
- N. Pérez, F. Casanova, F. Bartolomé, L. M. García, A. Labarta and X. Batlle, Phys. Rev. B: Condens. Matter Mater. Phys., 2011, 83, 184411 Search PubMed.
- B. Sathyamoorthy, A. Raja and G. Chandrasekaran, J. Mater. Sci.: Mater. Electron., 2018, 1–10 Search PubMed.
- N. A. Spaldin, Magnetic Materials: Fundamentals and Applications, Cambridge University Press, New York, 2nd edn, 2011 Search PubMed.
- J. Nogués and I. K. Schuller, J. Magn. Magn. Mater., 1999, 192, 203–232 Search PubMed.
- Y. Fan, K. J. Smith, G. Lupke, A. T. Hanbicki, R. Goswami, C. H. Li, H. B. Zhao and B. T. Jonker, Nat. Nanotechnol., 2013, 1–7 Search PubMed.
- A. Paul, C. Reitinger, C. Autieri, B. Sanyal, W. Kreuzpaintner, J. Jutimoosik, R. Yimnirun, F. Bern, P. Esquinazi, P. Korelis and P. Böni, Appl. Phys. Lett., 2014, 105, 022409 Search PubMed.
- R. P. Borges, C. Silva, M. M. Cruz and M. Godinho, J. Phys.: Conf. Ser., 2010, 200, 072014 Search PubMed.
- A. A. Momin, R. Parvin, M. Shahjahan, F. Islam, H. Tanaka and A. K. M. A. Hossain, J. Mater. Sci.: Mater. Electron., 2020, 31, 511–525 Search PubMed.
- P. Zachariasz, J. Kulawik and P. Guzdek, Mater. Des., 2015, 86, 627–632 Search PubMed.
- C. Nan, Phys. Rev. B: Condens. Matter Mater. Phys., 1994, 50, 6082 Search PubMed.
- Y. Wang, Y. Su, J. Li and G. J. Weng, J. Appl. Phys., 2015, 117, 164106 Search PubMed.
- T. N. Yang, J.-M. Hu, C. W. Nan and L. Q. Chen, Appl. Phys. Lett., 2014, 104, 052904 Search PubMed.
- A. S. Kumar, C. S. C. Lekha, K. Nandakumar, S. Vivek, M. R. Anantharaman and S. S. Nair, J. Mater. Sci.: Mater. Electron., 2019, 30, 8239–8248 Search PubMed.
- B. D. Cullity, J. Met., 1971, 35–41 Search PubMed.
- L. Qiao and X. Bi, Appl. Phys. Lett., 2008, 92, 214101 Search PubMed.
- L. B. Hao, Q. Y. Fu, D. X. Zhou, W. Luo, F. Xue and L. Zhou, J. Mater. Sci.: Mater. Electron., 2013, 24, 3885–3890 Search PubMed.
- R. Revathy, R. M. Thankachan, N. Kalarikkal, M. R. Varma and K. P. Surendran, J. Alloys Compd., 2021, 881, 160579 Search PubMed.
Footnote |
| † Electronic supplementary information (ESI) available. See DOI: 10.1039/d1ma00264c |
| This journal is © The Royal Society of Chemistry 2021 |