 Open Access Article
The impact of site selectivity and disorder on the thermoelectric properties of Yb21Mn4Sb18 solid solutions: Yb21Mn4−xCdxSb18 and Yb21−yCayMn4Sb18†
Allan
He
a,
Giacomo
Cerretti
 b and
Susan M.
Kauzlarich
 *a
*a
aDepartment of Chemistry, One Shields Ave, University of California, Davis, California 95616, USA. E-mail: smkauzlarich@ucdavis.edu
bJet Propulsion Laboratory, California Institute of Technology, 4800 Oak Grove Drive, MS 277-105, Pasadena, California 91125, USA
First published on 4th August 2021
Abstract
Thermoelectric materials can convert heat into electricity. They are used to generate electricity when other power sources are not available or to increase energy efficiency by recycling waste heat. The Yb21Mn4Sb18 phase was previously shown to have good thermoelectric performance due to its large Seebeck coefficient (∼290 μV K−1) and low thermal conductivity (0.4 W m−1 K−1). These characteristics stem respectively from the unique [Mn4Sb10]22− subunit and the large unit cell/site disorder inherent in this phase. The solid solutions, Yb21Mn4−xCdxSb18 (x = 0, 0.5, 1.0, 1.5) and Yb21−yCayMn4Sb18 (y = 3, 6, 9, 10.5) have been prepared, their structures characterized and thermoelectric properties from room temperature to 800 K measured. A detailed look into the structural disorder for the Cd and Ca solid solutions was performed using synchrotron powder X-ray diffraction and pair distribution function methods and shows that these are highly disordered structures. The substitution of Cd gives rise to more metallic behavior whereas Ca substitution results in high resistivity. As both Cd and Ca are isoelectronic substitutions, the changes in properties are attributed to changes in the electronic structure. Both solid solutions show that the thermal conductivities remain extremely low (∼0.4 W m−1 K−1) and that the Seebeck coefficients remain high (>200 μV K−1). The temperature dependence of the carrier mobility with increased Ca substitution, changing from approximately T−1 to T−0.5, suggests that another scattering mechanism is being introduced. As the bonding changes from polar covalent with Yb to ionic for Ca, polar optical phonon scattering becomes the dominant mechanism. Experimental studies of the Cd solid solutions result in a max zT of ∼1 at 800 K and, more importantly for application purposes, a ZTavg ∼ 0.6 from 300 K to 800 K.
Introduction
Thermoelectric materials can provide a clean energy alternative when employed in a device to regenerate electrical power from waste heat. These devices are inherently renewable and environmentally friendly making them an enticing alternative to fossil fuels. Wide-scale application of thermoelectrics and commercialization is currently being held back by modest device conversion efficiency.1 Efficiencies can be improved by developing new and better materials2 and/or through engineering considerations. The thermal to electrical conversion efficiency of a thermoelectric material is described by the figure of merit where α is the Seebeck coefficient, T is the temperature, ρ is the electrical resistivity, and κ is the thermal conductivity. To be an efficient thermoelectric material, low thermal conductivity, low resistivity, and high Seebeck coefficient are required to maximize the figure of merit, zT. The simultaneous optimization of these parameters (α, ρ, κ) is a naturally conflicting goal because of their interconnected relationship with the charge carrier concentration (n) of the material. This has led to many different strategies for optimization in the thermoelectric community. One common avenue is to first start from intrinsically low thermal conductivity materials (those with large unit cells) to provide a good starting point for optimization. One class of low thermal conductivity materials can be identified as charge-balanced and semiconducting Zintl compounds. The type of bonding in Zintl compounds can fall anywhere in between ionic, covalent, or metallic and because of this flexibility, one may imagine that a large number of unique and undiscovered compounds are possible. The subset of Zintl phases with complex unit cells gives rise to more phonon modes leading to increased phonon scattering and lower thermal conductivity. Examples of such materials include Yb14MnSb11,3,4 Zn–Sb phases,5–7 and Tl2Ag12Te7+δ.8 Other optimization strategies include: electronic structure modification (e.g. increasing the density of states (DOS) near the Fermi level) either through substitutional doping demonstrated in PbTe,9 defect control,10 and nanostructuring/compositing for decreased thermal conductivity11 or improved electronic and mechanical properties.12
Our previous study on the parent Yb21Mn4Sb18 (referred to as 21-4-18) compound showed that extremely low values of thermal conductivity (∼0.4 W m−1 K−1)13 can be achieved due to the complex structural disorder inherent within the system.13,14 Paired with a high Seebeck coefficient (∼290 μV K−1) given largely from the unique [Mn4Sb10]22− anion substructure, the intrinsic phase without any optimization shows a peak zT of ∼0.75 at 800 K. Optimization of this compound was achieved through carrier concentration manipulation with the doping of sodium into the structure, increasing the maximum zT to ∼0.8 and ZTavg from 0.34 to 0.49 over the entire temperature range (300–800 K).13 Here, the term ZTavg refers to the average zT across the specified temperature range calculated from the integration method.15 Sodium doping improves the ZTavg and brings the thermoelectric compatibility factor(s) of the 21-4-18 phase closer to other top performing thermoelectric materials making it more desirable for practical applications.13 Since thermoelectric devices depend on segmentation of different materials, maximal efficiencies are only achieved if the compatibility factors of said materials are similar.
Yb21Mn4Sb18 can be understood using a Zintl formalism of electron counting. The unit cell (Z = 4) (Fig. 1) contains 1 linear [Mn4Sb10]22− anion, 2 dumbbell [Sb2]4− anions, 4 isolated Sb3− anions, and 21 Yb2+ cations making it charge-balanced.
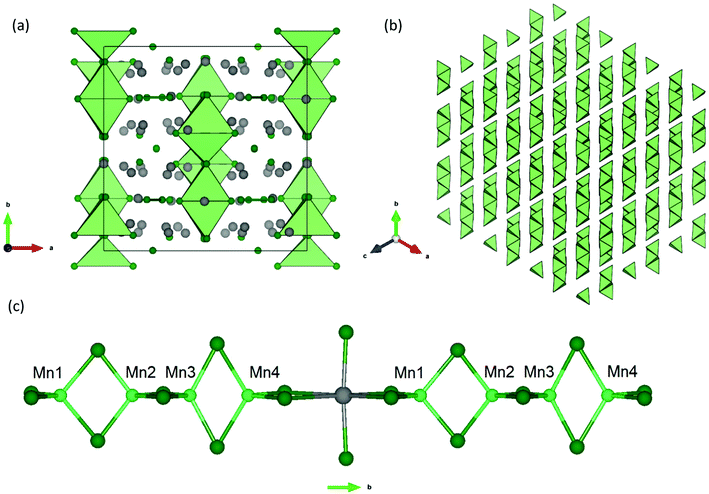 | ||
| Fig. 1 (a) Unit cell of the Yb21Mn4Sb18 structure (a = 16.930(3) Å, b = 17.029(3) Å, c = 16.693(3) Å, β = 92.61(3)°, C2/c) viewed down the c-axis.13 Yb atoms represented in grey, Mn atoms in light green, and Sb atoms in dark green. (b) Polyhedral view of the [Mn4Sb10]22− tetramer stacking shown along the (111) direction, without atoms for clarity. (c) Inter-tetramer coordination shown parallel to the b-axis. | ||
Building on our previous work, herein we present the structure and thermoelectric properties of the Yb21Mn4−xCdxSb18 (x = 0, 0.5, 1.0, 1.5) and Yb21−yCayMn4Sb18 (y = 3, 6, 9, 10.5) solid solutions. Although both Cd and Ca can be considered to be 2+ and therefore substitute isoelectronically for Mn2+ and Yb2+ respectively, the physical properties change drastically and cannot be explained using electron counting rules. Instead, it is necessary to consider how each solid solution changes the electronic structure to rationalize the physical properties that emerge for each solid solution. Yb21Mn4Sb18 is a half metallic compound with Mn2+ having a half filled d band.13 Cd was chosen as it has a filled d orbital and as such was expected to remove the half metallicity to improve the electrical transport. Ca substitution was expected to increase electron donation to the clusters and thereby increase the Seebeck coefficients further. The Cd substitution in general makes the 21-4-18 phase more metallic while Ca has the opposite effect. In particular, introduction of the ionic Ca species reveals that the dominant carrier scattering mechanism can be tuned in Zintl phases and thereby providing a new avenue for thermoelectric properties optimization. The introduction of Cd and Ca into the 21-4-18 system shows the high flexibility and tunability of this structure type. This study focuses on isovalent substitutions on the A and M site in the A21M4Pn18 system (where A is a 2+ rare-earth metal or alkali-earth element, M is a transition metal, and Pn is a pnictogen). The observed change in the physical properties for each solid solution is therefore only due to changes in the electronic band structure topology and not a combination of changes in band structure and carrier concentration as would be the case from aliovalent doping studies.
Experimental section
Synthesis
The polycrystalline Yb21Mn4−xCdxSb18 (x = 0.5, 1.0, 1.5) and Yb21−yCayMn4Sb18 (y = 3, 6, 9, 10.5) samples were successfully synthesized using ball-milling and sintering processes, similar to that described previously.13 Attempts to synthesize the x = 2.0 sample resulted in the presence of Yb11Sb10 impurity; therefore, the maximum composition of x = 1.5 was investigated. The Yb filings (Metall Rare Earth Limited, 99.99%), Ca pieces (Sigma Aldrich, 99.99%) Mn pieces (Alfa Aesar, 99.95%), Cd shots (Alfa Aesar, 99.95%) and Sb shots (Alfa Aesar, 99.999%) were loaded into a stainless steel ball-mill (50 mL vial using 3 stainless steel 0.5′′ balls) under Ar atmosphere (<1 ppm H2O) in their appropriate stoichiometries (10 g total mass), and sealed inside a Mylar bag. The contents were milled for 1 h in a SPEX 8000 M High-Energy ball mill. For additional homogeneity, the resulting powder was ground thoroughly under Ar atmosphere, resealed in a Mylar bag, and subsequently milled for an additional hour. The mixture was then placed into 8 cm long Nb tubes, crimped and welded in an arc welder under partial Ar pressure, and jacketed in a fused silica tube under vacuum. The reaction was heated to 650 °C (100 °C h−1), sintered for 7 days, and allowed to slowly cool down to room temperature.Densification of the powders for physical property measurements was done using spark plasma sintering (SPS) using a Dr Sinter SPS-2050 system. Approximately 2–3 g of material was sieved through a 200 mesh filter and loaded into a 12.7 mm graphite die. The SPS chamber was evacuated until <12 Pa and an initial pressure of 6 kN was applied to the die. The mixture was heated to 535 °C in 6 minutes, heated to 585 °C in 1 minute, followed by 45 minutes of dwell time. The pressure was adjusted monotonically to 11 kN upon compression of the mixture. All pellets obtained were >95% dense (Archimedes’ method) from this method.
Synchrotron powder X-ray diffraction
Synchrotron powder X-ray diffraction data were collected at the Argonne National Laboratory using the 11-BM beamline of the Advanced Photon Source (APS), Argonne National Laboratory. The samples were placed into Kapton capillaries, sealed with epoxy and the scattering data collected in transmission mode. Because of the highly absorbing nature of the samples, the powders were diluted with SiO2 until μR ≈ 1. A wavelength of λ = 0.457884 Å was used and the data were measured at room temperature. A comparison was completed with Rietveld refinement using the 11 BM data with our previously reported structure13 and a more recently reported disordered structural model of 21-4-18.14 The recently published model contains more independent parameters14 and yielded a slightly lower Rwp value of ∼5.9 compared to our previous model which obtained a Rwp value of ∼6.1. The atomic positions and atomic displacement parameters of both models were refined.Pair distribution function
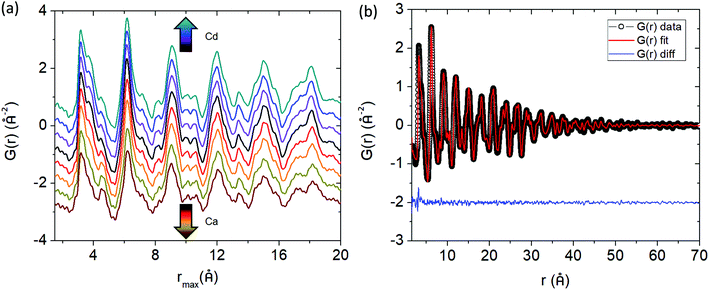
Synchrotron X-ray total scattering measurements on the Yb21Mn4−xCdxSb18 (x = 0, 0.5, 1.0, 1.5) and Yb21−yCayMn4Sb18 (y = 3, 6, 9, 10.5) samples were carried out at 11-ID-B beamline (λ = 0.2115 Å) at the Advanced Photon Source, Argonne National Laboratory using a 2D plate detector. The powders were sealed inside polyimide capillaries using epoxy and the data were collected at room temperature. The data images were analyzed using General Structure Analysis System-II (GSAS-II) program16 where they were azimuthally integrated, resulting in a 1D pattern. The experimental parameters were calibrated using CeO2 as the standard material. The pair distribution functions (PDFs) were obtained through the PDFgetX3 software17 using a Qmax of 23.47 Å−1 and were corrected for background diffraction from the air/capillary. The G(r) functions were modelled with the PDFgui software18 using the results from Rietveld refinement of the powder X-ray synchrotron data as starting parameters. Overall, the lattice parameters, atomic displacement parameters (ADPs) and atomic positions were refined. Reverse Monte Carlo (RMC) fitting of the PDFs was done with RMCprofile software19 using a 8 × 8 × 8 supercell (88![[thin space (1/6-em)]](https://www.rsc.org/images/entities/char_2009.gif) 064 atoms). The simulations were constrained with bond valence sum rules in order to keep the model chemically sound. A minimum distance restraint was applied to prevent any unreasonably short atomic pairs. Convergence was achieved after approximately 100 h on a standard PC. The resultant structural model from RMC was tested on 11 BM powder data using Rietveld refinement and resulted in a slightly higher R value (5.908 vs. 5.833 originally), as expected since the RMC model captures local structural features.
064 atoms). The simulations were constrained with bond valence sum rules in order to keep the model chemically sound. A minimum distance restraint was applied to prevent any unreasonably short atomic pairs. Convergence was achieved after approximately 100 h on a standard PC. The resultant structural model from RMC was tested on 11 BM powder data using Rietveld refinement and resulted in a slightly higher R value (5.908 vs. 5.833 originally), as expected since the RMC model captures local structural features.
Thermoelectric property measurements
A Linseis LSR-3 instrument was used for resistivity and Seebeck coefficient measurements using the 4-probe method from 350 K to 800 K under He atmosphere. Samples were cut into bars (∼10 mm × 2 mm × 2 mm) and measured using 8 mm probes. Many samples were measured to ensure reproducibility of the data and were cross-checked by measurements at the Jet Propulsion Laboratory (JPL). The Seebeck coefficient measured at JPL employed a light pulse technique with W/Nb thermocouples.20 A custom system (4-point probe) was used to measure the electrical resistivity and Hall voltage simultaneously under dynamic vacuum, from which, the carrier density and mobility were derived.21Thermal diffusivity (D) was measured using a Netzsch LFA 457 instrument under vacuum up to 800 K. The sample disks were polished flat and an even graphite coating was applied. The heat capacity (Cp) was estimated using the Dulong–Petit method, and the density (d) was measured by Archimedes’ method. The thermal conductivity (κ) was then calculated using the formula κ = DdCp.
Compositional analysis
The samples were mounted in epoxy and polished to a smooth, flat surface. Elemental analysis was carried out using energy dispersive spectroscopy (EDS) using a FEI Scios DualBeam SEM/FIB with a window-less Oxford Instruments X-max50, 50 mm2 silicon drift detector. Backscattered electron images were collected with an accelerating voltage of 20 kV and a current of 1.6 nA.Results and discussion
Crystal structure
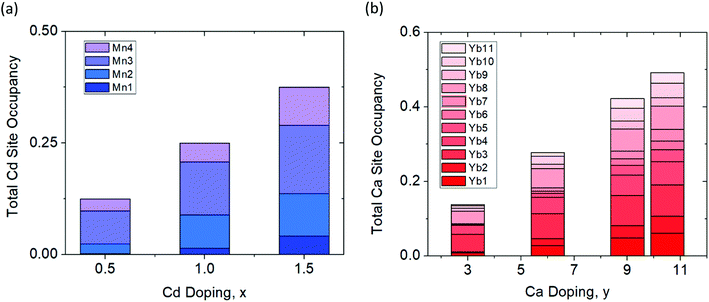
The synchrotron powder X-ray diffraction patterns (Fig. 2) of all the prepared polycrystalline samples (x = 0, 0.5, 1.0, 1.5) and y = 3.0, 6.0, 9.0, 10.5) remain in the monoclinic C2/c, α-Ca21Mn4Sb18 structure type. No impurity phases were apparent in either the Cd or Ca solid solution series. During Rietveld refinement, the relative Mn/Cd and Yb/Ca occupancies were allowed to refine freely on each of the 4 Mn/Cd sites and the 11 Yb/Ca sites that converged to values close to nominal loading composition (see ESI† (Tables S1 and S2)). Subsequent refinements constrained the total Mn/Cd and Yb/Ca occupancies to the nominal composition, with little to no change in Rwp (see ESI† (Tables S1 and S2)). Substitution of the transition metal site (Mn) with Cd was found to exhibit site preference within the [Mn4Sb10]22− tetramer chain, where the Cd atoms prefer to reside on the terminal sites (Mn1/Cd1 and Mn4/Cd4) of the tetramer unit and the Mn atoms prefer to occupy the central two sites (Mn2/Cd2 and Mn3/Cd3) within the tetramer (see Fig. 3a). In fact, the Mn2 site is completely devoid of Cd for the compositions investigated. We believe that the Cd site preference for the terminal sites of the tetramer unit arise from their intrinsically softer, longer bonds. The terminal sites are directly next to an octahedrally coordinated Yb atom (Yb11) which has previously been shown to exhibit rattling and disorder13 and the softer bonds of the Cd atoms would be more accommodating of any local distortions on the octahedral site. Additionally, a comparison of the (Mn, Cd)–(Mn, Cd) distances within the tetramer chain reveal that the Mn2–Mn3/Cd3 bond distance is the shortest among all the TM–TM bonds in the tetramer unit. It is reasonable to expect that the Mn atoms would prefer to sit on the two sites that are closest to each other to give rise to the strongest exchange coupling. With additional Cd doping, the tetramer structure evolves such that the Mn1/Cd1 atom begins to segregate away from the other atoms (i.e. Mn1/Cd1–Mn2 distance increases from 3.64(3) Å to 4.004(2) Å for x = 0 and x = 1.5, respectively) while the total length of the tetramer chain remains relatively constant (i.e. Mn1/Cd1–Mn4/Cd4 distance ranges from 8.74(3) Å to 8.724(2) Å for x = 0 and x = 1.5, respectively).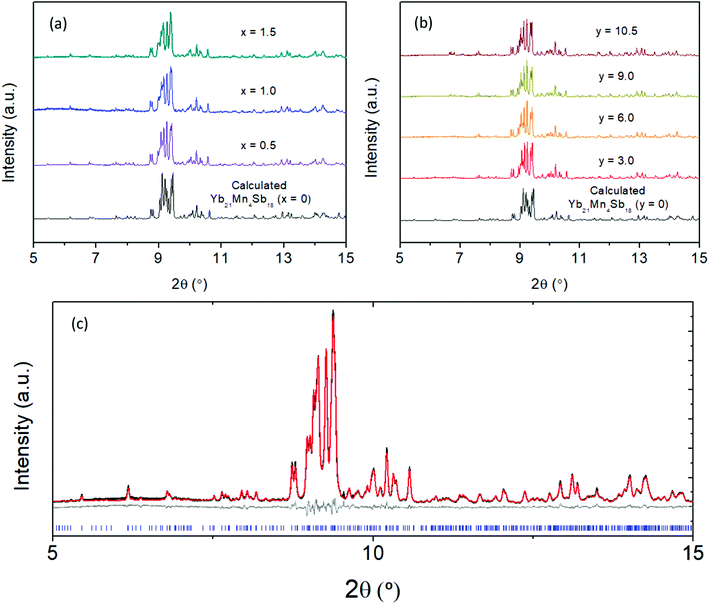 | ||
| Fig. 2 Synchrotron powder X-ray diffraction data collected at room temperature for (a) Yb21Mn4−xCdxSb18 (x = 0, 0.5, 1.0, 1.5) and (b) Yb21−yCayMn4Sb18 (y = 3.0, 6.0, 9.0, 10.5) with λ = 0.457884 Å. (c) A representative Rietveld refinement for sample Yb21Mn2.5Cd1.5Sb18 where data are shown in black, calculated fit in red, difference in grey, and Bragg reflections in blue. Rietveld refinement parameters and results can be found in ESI† (Tables S1 and S2). | ||
Substituting Ca on the rare earth site (Yb) did not result in any site preference (see Fig. 3b). Overall, the Ca atoms are spread fairly evenly on all of the 11 sites which is probably due to the similarity in their 6-coordinate ionic radii (Ca: 1.00 Å vs. Yb: 1.02 Å) and bonding. The lack of site preference for the Ca atoms has been previously observed in the Yb14−xCaxMnSb11 system.22
Pair distribution function
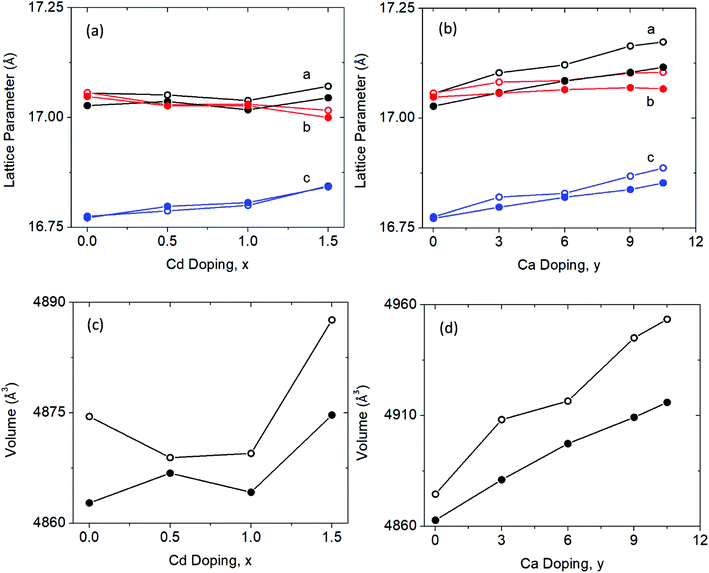 | ||
| Fig. 5 Lattice parameters and unit cell volume obtained from Rietveld refinement (filled circles) of the X-ray synchrotron data and the small box modelling (open circles) of total scattering X-ray synchrotron data (G(r) with an rmax = 70 Å, see ESI† (Tables S3 and S4)). (a and c) Lattice parameters and unit cell volume of Cd solid solution. (b and d) Lattice parameters and unit cell volume of the Ca solid solution. | ||
Both the lattice parameter and unit cell volume obtained from the Rietveld refinements and PDF refinements follow the same trend. With increasing Cd substitution, lattice parameters a and c both increase while b decreases, resulting in an overall increase in unit cell volume from x = 0 to x = 1.5. For the Ca solid solution series, there is a similar trend. Lattice parameters a and c both increase, while b stays relatively the same resulting in the unit cell volume increase across the series.
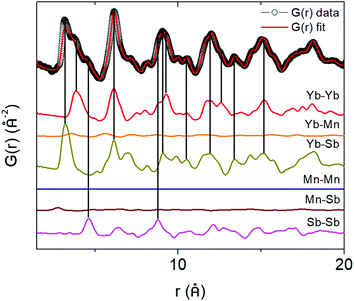
To directly see the contribution of individual atom–atom pairs to the pair distribution function, the partial pair distribution function curves were plotted in Fig. 6 for the parent (x = 0) Yb21Mn4Sb18 sample. The overall PDF (G(r)) is obtained by summing all the partial PDFs (G(r)) with appropriate weighting coefficients, i.e. . The contribution of a particular atom pair depends upon the concentration of the particular atom (ci, cj) and the scattering factor (bi, bj). Because Yb and Sb make up most of the formula unit in this system (large c), and since Yb and Sb have larger scattering factors in comparison to Mn, the largest atom–atom pair contributions to G(r) are from the Yb–Yb, Yb–Sb, Sb–Sb pairs.
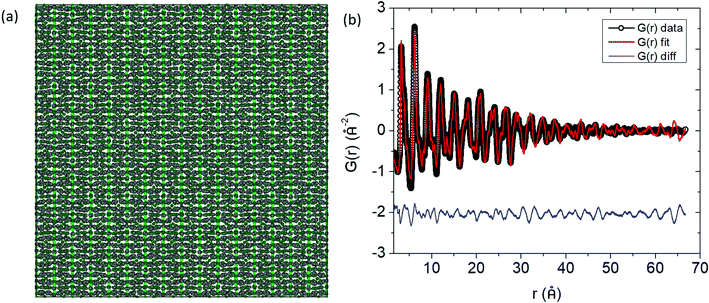
The G(r) function was modelled according to an 8 × 8 × 8 supercell for all the different compositions (Fig. 7a). For the solid solutions, the Cd and Ca atoms were randomly distributed among their respective sites for the initial configuration prior to refinement. During the refinement, the Mn and Cd atoms were allowed to swap places with equal probability for the Cd solid solutions, and similarly, the Yb and Ca atoms were allowed to swap with equal probability for the Ca solid solutions.
An excellent fit over the whole r range of the PDF is obtained (Fig. 7b) given the small supercell that was used. For visualization, the distribution of the atomic positions in the 8 × 8 × 8 supercell were superimposed onto a single unit cell (i.e. point cloud distributions, Fig. 8a) for Yb21Mn4Sb18 and the two most highly substituted samples of Cd and Ca (Fig. 8b, and c). There are two structural models for Yb21Mn4Sb18 based on single crystal data13,14 and both give rise to similar Rietveld refinements of the data, as noted above. The RMC model cannot support or discard either of these models because the aforementioned models are based on long range ordering in single crystal samples while the current analysis is looking at local ordering in powder samples.
 | ||
| Fig. 8 Point cloud distributions of (a) Yb21Mn4Sb18 (b) Yb21Mn2.5Cd1.5Sb18 (c) Yb10.5Ca10.5Mn4Sb18 showing cation site and transition metal site occupations from RMC simulations. Yb atoms are in gray, Mn atoms in light green, Sb atoms in dark green, Cd atoms in blue, and Ca atoms in red. Other point cloud distributions can be found in ESI,† Fig. S3. | ||
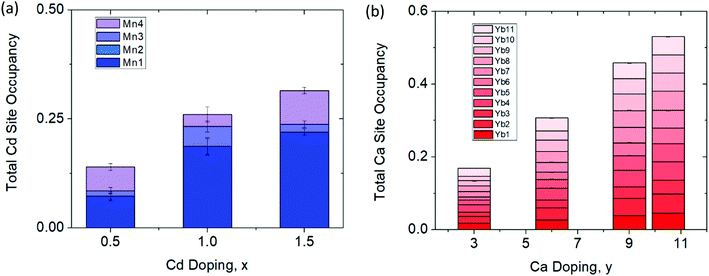
The results from the RMC modeling suggest a highly disordered structure that is unique and separate from the average model obtained through Rietveld refinement. Fig. 9 shows the site occupations of Cd and Ca substituted samples obtained from the RMC simulations. The simulations show that there is some degree of site preference for both the Ca and Cd atoms in the local structure that is distinct from the average structure.
For example, in the x = 1.5 sample, the Cd atoms populate the Mn2/Cd2 site and Mn3/Cd3 site the most, whereas in the Rietveld refinement, Cd atoms reside on the terminal Mn1/Cd1 and Mn4/Cd4 sites the most (refer back to Fig. 3). Additionally, in the Ca solid solutions, Rietveld refinement showed that the Ca atoms were roughly evenly distributed across all 11 Yb sites while the RMC simulations show some degree of site preference. To verify whether or not these results are local structural features, further simulations were performed. The final structural model for y = 10.5 was chosen as a representative sample and was allowed to randomly swap the Yb and Ca atoms with absolute probability for more than 12 h. The resultant structure (and fit) was compared to the model prior to swapping which resulted in a substantially worse agreement with the experimental data (see ESI,† Fig. S4) providing additional evidence of the local ordering. From the total scattering experiments, it is clear that there are local structural features on the nanoscale domain that are missed by the Rietveld refinement. These domains are approximately ∼70 Å long with no obvious signs of long range order that could be observed within the 8 × 8 × 8 supercell model.
Compositional analysis
All the samples after the SPS process were >95% dense. Backscattered electron images of a representative polished pellet surface of x = 0.5 is shown in Fig. 10. The compositions of all the samples were found to be within approximately 1 at% of the nominal stoichiometry (see ESI,† Table S5) according to EDS. Since the Ca K-edge (4.0381 keV) overlaps heavily with the Sb L-edges (L-I edge: 4.6983 keV, L-II edge: 4.3804 keV, L-III edge: 4.1322 keV), quantification of the Ca amount in the Ca solid solution samples was not reliable using EDS. Instead, we refer the reader to the refined compositions obtained via synchrotron powder X-ray diffraction data (see ESI,† Table S2).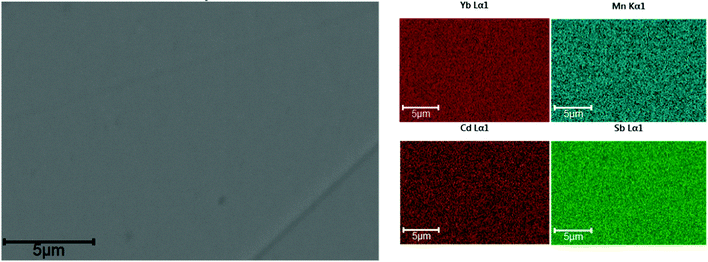 | ||
| Fig. 10 Representative backscattered electron images from a dense pellet of Yb21Mn4−xCdxSb18 (x = 0.5) collected with 20 kV electron beam (left) and elemental mapping (right). Images of other Cd solid solutions can be found in ESI† (Fig. S5 and S6). | ||
Electronic transport properties
Fig. 11a shows the temperature dependent Hall measurements for the Cd-substituted series yielding a large carrier concentration (cc) of nH > 1 × 10²⁰ h+ cm−3 for all samples. Although the isoelectronic substitution of Cd2+ with Mn2+ is not expected to change the carrier concentration from basic electron counting, the cc can be seen to steadily increase with Cd substitution. Since Cd is more electronegative than Mn, it will provide a more incomplete electron transfer to the anions to yield a higher p-type cc for the solid solutions. Stated another way, the larger electronegativity of Cd will result in lower energy atomic orbitals compared to Mn (Koopmans’ Theorem)23 providing more states for the holes to occupy, leading to a larger cc. The increase in cc with Cd content is reflected in the electrical resistivity data (Fig. 11b). All samples show metallic behaviour with increasing temperature before transitioning into semiconducting behaviour above 600 K. There is a peak in resistivity at about 600 K that shifts to higher temperatures with additional Cd content signaling an increase in the band gap. The Hall mobility is shown in Fig. 11c and stays relatively constant with the additional Cd doping. The Seebeck coefficient (Fig. 11d) steadily decreases with Cd content because of the increase in cc and is consistent with the temperature dependence of the electrical transport data.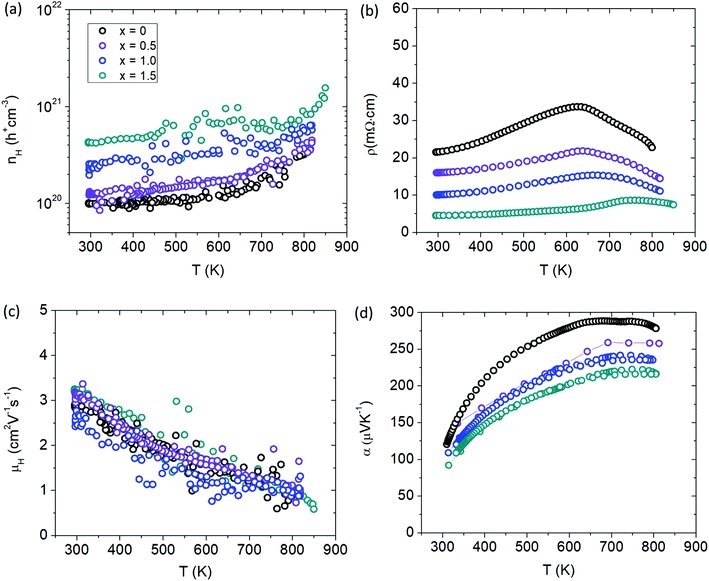 | ||
| Fig. 11 Transport properties of Yb21Mn4−xCdxSb18 (x = 0, 0.5, 1.0, 1.5). (a) Hall carrier concentration (nH), (b) resistivity (ρ), (c) Hall mobility (μH), (d) Seebeck coefficient (α). See ESI† for Pisarenko plot (Fig. S7). | ||
The thermoelectric transport properties for the Ca solid solution series are shown in Fig. 12. With additional Ca substitution, the carrier density decreases accordingly, dropping an order of magnitude from ∼1 × 10²⁰ h+ cm−3 (y = 0) to ∼2 × 10¹⁹ h+ cm−3 (y = 10.5) at room temperature. Since Ca2+ is more ionic than Yb2+ and less electronegative, samples with more Ca will donate more e− density into the system lowering the hole carrier concentration. As Ca is incorporated, Yb f states near the Fermi level are removed. The loss of these Yb states results in the observed decrease in carrier concentration as there are less places for the holes to populate the valence band. In addition to the drop in cc, the cc slope is also increased for the Ca-substituted samples compared to the parent (x = 0) sample. The electrical resistivity increases with Ca content and shows an exponential increase in the room temperature value. The high temperature slope-change of the electrical resistivity (similar to the Cd series) shifts to higher temperature with Ca content and marks the point of minority carrier activation or bipolar conduction, consistent with the temperature dependence of the cc. The carrier mobility decreases steadily with additional Ca content and decreases its temperature dependence from approximately T−1 to T−0.5. The temperature dependence of mobility is a combination of all the different scattering mechanisms at play, but is usually dominated by acoustic phonon scattering at high T which will yield T−1.5 for nondegenerate semiconductors and T−1 for degenerate systems.24 The gradual shift in temperature dependence to T−0.5 with increased Ca substitution suggests that another scattering mechanism is being introduced. As the material becomes more polar with Ca substitution, the lattice becomes more polarizable, increasing the degree of electron–phonon interaction (i.e. Fröhlich constant (α)) to make polar optical phonon scattering the dominant mechanism25 and suggests polaron formation. Compared to Yb21Mn4Sb18, the y = 3 sample experiences an initial drop in Seebeck which may be due to the loss in Yb f states, before increasing with additional Ca content.
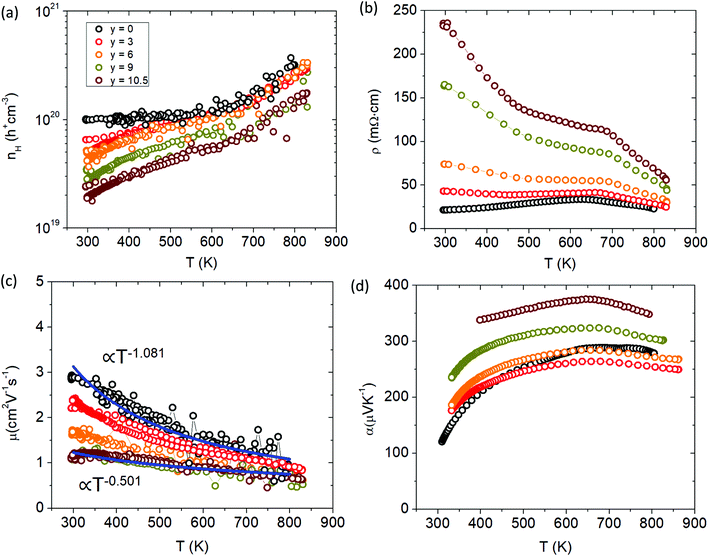 | ||
| Fig. 12 Transport properties of Yb21−yCayMn4Sb18 (a) Hall carrier concentration (nH), (b) resistivity (ρ), (c) Hall mobility (μH), (d) Seebeck coefficient (α). See ESI† for Pisarenko plot (Fig. S7). | ||
Thermal transport properties
Thermal conductivities were calculated from measurements of thermal diffusivity using eqn (1):| κ = DdCp | (1) |
With increasing Cd and Ca content, the total thermal conductivity increases slightly (see Fig. 13a and b). In general, on a large scale the thermal conductivity of all the samples are not changed drastically from Yb21Mn4Sb18, with the maximal changes amounting to approximately ∼0.2 W m−1 K−1. From the Wiedemann–Franz law, the electronic part of the thermal conductivity is given by κe = LσT, where L was approximated with an accuracy within 0.5% of a single parabolic band model calculation.26 The electronic contribution was subtracted from the total thermal conductivity to yield the lattice thermal conductivity (see ESI,† Fig. S8). The lattice thermal conductivity can be seen to slightly increase for both solid solutions and may be due to the difference in defect formation energies of the substituted elements where previously Yb defects were calculated to be more energetically favourable than Ca defects.27
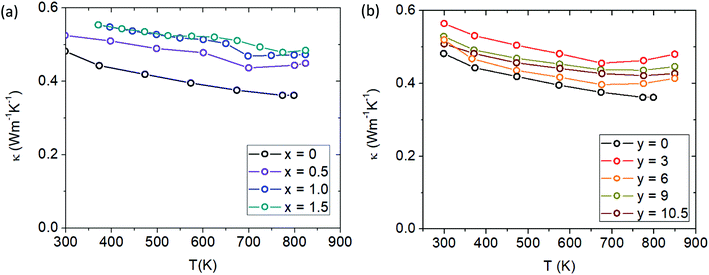 | ||
| Fig. 13 (a) Total thermal conductivity of Cd-substituted series (Yb21Mn4−xCdxSb18) and (b) total thermal conductivity of Ca-substituted series (Yb21−yCayMn4Sb18). | ||
Room temperature measurements of speed of sound yield a transverse and longitudinal value of vt = 1774 m s−1 and 3006 m s−1 respectively for the pristine sample of Yb21Mn4Sb18. A corresponding Debye temperature of θD ≈ 192 K for x = 0 sample was calculated from eqn (2) and (3) where vm is the mean speed of sound, vl and vt are the longitudinal and transverse speeds of sound respectively.
 | (2) |
 | (3) |
 | (4) |
 is the frequency cutoff for the ith polarization in units of K. The lattice thermal conductivity of the samples can be seen to drop below κmin which may be due to shortcomings of the Lorenz number calculation and the assumptions of the single parabolic band model.29
Figure of merit
The figure of merit, zT, plots are shown in Fig. 14 where we see a max zT ∼ 0.92 is achieved for the x = 1.5 (Yb21Mn2.5Cd1.5Sb18) sample. The ZTavg of this sample is 0.61 from 300 K to 800 K, calculated from the integration method, making it the highest for the 21-4-18 compositions reported to date. There is a large improvement over the whole temperature range at this Cd concentration and this result is important for practical thermoelectric device implementation. For the Ca-substituted series, the figure of merit ultimately decreases with increasing amounts of Ca mainly due to the large increase in resistivity. However, the change in scattering mechanism and the possibility of keeping the low thermal conductivity while tuning the carrier concentration via aliovalent substitution provides a new avenue towards additional zT improvements.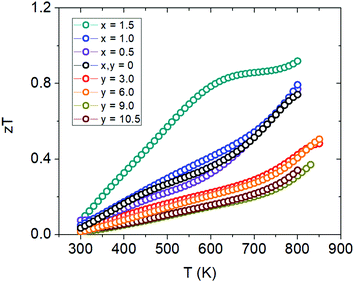 | ||
| Fig. 14 Figure of merit (zT) plots for Cd-substituted samples (Yb21Mn4−xCdxSb18) and Ca-substituted samples (Yb21−yCayMn4Sb18). | ||
Conclusion
The two solid solutions of Yb21Mn4−xCdxSb18 (x = 0, 0.5, 1.0, 1.5) and Yb21−yCayMn4Sb18 (y = 3, 6, 9, 10.5) have been successfully synthesized using high temperature annealing of the elements followed by spark plasma sintering for densification. Building upon our previous work, this study continues to show the highly disordered nature of the 21-4-18 system from total X-ray synchrotron diffraction studies (pair distribution function) and from synchrotron powder X-ray diffraction. The average structure obtained from Rietveld refinement has been observed to differ from the local structure determined from reverse Monte Carlo simulations of PDF data in terms of the site occupation of the Cd and Ca to give rise to nanodomains within the material. In general, the 21-4-18 phase becomes more metallic with Cd substitution and more insulating with Ca substitution. The highest zT ∼ 1 is achieved at 800 K by the material with stoichiometry Yb21Mn2.5Cd1.5Sb18. Even though these substitutions are in principle, isoelectronic substitutions, the systematic change in the physical properties show that one cannot solely rely on electron counting rules to rationalize these results. These studies show that the carrier scattering mechanism can be tuned through ionic substitutions to make the material more polar and in particular for the 21-4-18 system, that the correct optimization strategy is to increase the carrier concentration. Given that there are many possibilities within the 21-4-18 structures, even higher zTs are possible with further optimization and expansion of the possible solid solutions.Conflicts of interest
The authors declare no competing financial interest.Acknowledgements
The authors would like to acknowledge Dr Leighanne Gallington at Argonne National Laboratory for her help with collection of the total X-ray synchrotron diffraction data and Dr Yuanpeng Zhang from Oak Ridge National Laboratory for his helpful suggestions with the Monte Carlo simulations. This work was supported by NSF DMR-1709382, DMR-2001156. Part of this work was conducted at the Jet Propulsion Laboratory California Institute of Technology under contract with the National Aeronautics and Space Administration with funding from the Science Mission Directorate's Radioisotope Power Systems program. G. Cerretti's research at the Jet Propulsion Laboratory was supported by an appointment to the NASA Postdoctoral Program, administered by Universities Space Research Association under contract with NASA.References
- P. Fernández-Yáñez, V. Romero, O. Armas and G. Cerretti, Thermal management of thermoelectric generators for waste energy recovery, Appl. Therm. Eng., 2021, 196, 117291 CrossRef.
- D. Beretta, N. Neophytou, J. M. Hodges, M. G. Kanatzidis, D. Narducci, M. Martin-Gonzalez, M. Beekman, B. Balke, G. Cerretti, W. Tremel, A. Zevalkink, A. I. Hofmann, C. Müller, B. Dörling, M. Campoy-Quiles and M. Caironi, Thermoelectrics: From history, a window to the future, Mater. Sci. Eng., R, 2019, 138, 210–255 CrossRef.
- Y. Hu, G. Cerretti, E. L. K. Wille, S. K. Bux and S. M. Kauzlarich, The remarkable crystal chemistry of the Ca14AlSb11 structure type, magnetic and thermoelectric properties, J. Solid State Chem., 2019, 271, 88–102 CrossRef CAS.
- S. R. Brown, S. M. Kauzlarich, F. Gascoin and G. J. Snyder, Yb14MnSb11: New high efficiency thermoelectric material for power generation, Chem. Mater., 2006, 18, 1873–1877 CrossRef CAS.
- C.-W. T. Lo, B. R. Ortiz, E. S. Toberer, A. He, V. Svitlyk, D. Chernyshov, T. Kolodiazhnyi, S. Lidin and Y. Mozharivskyj, Synthesis, Structure, and Thermoelectric Properties of α-Zn3Sb2 and Comparison to β-Zn13Sb10, Chem. Mater., 2017, 29, 5249–5258 CrossRef CAS.
- A. He, V. Svitlyk, D. Chernyshov and Y. Mozharivskyj, Identification, structural characterization and transformations of the high-temperature Zn9–δSb7 phase in the Zn–Sb system, Dalton Trans., 2015, 44, 20983 RSC.
- G. J. Snyder, M. Christensen, E. Nishibori, T. Caillat and B. B. Iversen, Disordered zinc in Zn4Sb3 with phonon-glass and electron-crystal thermoelectric properties, Nat. Mater., 2004, 3, 458–463 CrossRef CAS PubMed.
- Y. Shi, A. Assoud, S. Ponou, S. Lidin and H. Kleinke, A New Material with a Composite Crystal Structure Causing Ultralow Thermal Conductivity and Outstanding Thermoelectric Properties: Tl 2 Ag 12 Te 7 + δ, J. Am. Chem. Soc., 2018, 140(27), 8578–8585, DOI:10.1021/jacs.8b04639.
- J. P. Heremans, V. Jovovic, E. S. Toberer, A. Saramet, K. Kurosaki, A. Charoenphakdee, S. Yamanaka and G. J. Snyder, Enhancement of Thermoelectric Efficiency in PbTe by Distortion of the Electronic Density of States, Science, 2008, 321, 1457–1461 CrossRef PubMed.
- A. Zevalkink, W. G. Zeier, E. Cheng, J. Snyder, J.-P. Fleurial and S. Bux, Nonstoichiometry in the Zintl phase Yb1-δZn2Sb2 as a route to thermoelectric optimization, Chem. Mater., 2014, 26, 5710–5717 CrossRef CAS.
- S. N. Girard, T. C. Chasapis, J. He, X. Zhou, E. Hatzikraniotis, C. Uher, K. M. Paraskevopoulos, V. P. Dravid and M. G. Kanatzidis, PbTe-PbSnS2 thermoelectric composites: low lattice thermal conductivity from large microstructures, Energy Environ. Sci., 2012, 5, 8716–8725 RSC.
- G. Cerretti, O. Villalpando, J.-P. Fleurial and S. K. Bux, Improving electronic properties and mechanical stability of Yb14MnSb11via W compositing, J. Appl. Phys., 2019, 126, 175102 CrossRef.
- A. He, S. K. Bux, Y. Hu, D. Uhl, L. Li, D. Donadio and S. M. Kauzlarich, Structural Complexity and High Thermoelectric Performance of the Zintl Phase: Yb21Mn4Sb18, Chem. Mater., 2019, 31, 8076–8086 CrossRef CAS.
- S. Baranets, A. Ovchinnikov and S. Bobev, Complex Structural Disorder in the Zintl Phases Yb10 MnSb9 and Yb21Mn4Sb18, Inorg. Chem., 2021, 60, 6702–6711 CrossRef CAS PubMed.
- H. S. Kim, W. Liu, G. Chen, C.-W. Chu and Z. Ren, Relationship between thermoelectric figure of merit and energy conversion efficiency, Proc. Natl. Acad. Sci. U. S. A., 2015, 112, 8205–8210 CrossRef CAS PubMed.
- B. H. Toby and R. B. Von Dreele, GSAS-II: the genesis of a modern open-source all purpose crystallography software package, J. Appl. Crystallogr., 2013, 46, 544–549 CrossRef CAS.
- P. Juhás, T. Davis, C. L. Farrow and S. J. L. Billinge, PDFgetX3: a rapid and highly automatable program for processing powder diffraction data into total scattering pair distribution functions, J. Appl. Crystallogr., 2013, 46, 560–566 CrossRef.
- C. L. Farrow, P. Juhas, J. W. Liu, D. Bryndin, E. S. Božin, J. Bloch, T. Proffen and S. J. L. Billinge, PDFfit2 and PDFgui: computer programs for studying nanostructure in crystals, J. Phys.: Condens. Matter, 2007, 19, 335219 CrossRef CAS PubMed.
- M. G. Tucker, D. A. Keen, M. T. Dove, A. L. Goodwin and Q. Hui, RMCProfile: reverse Monte Carlo for polycrystalline materials, J. Phys.: Condens. Matter, 2007, 19, 335218 CrossRef PubMed.
- C. Wood, D. Zoltan and G. Stapfer, Measurement of Seebeck coefficient using a light pulse, Rev. Sci. Instrum., 1985, 56, 719–722 CrossRef CAS.
- K. A. Borup, E. S. Toberer, L. D. Zoltan, G. Nakatsukasa, M. Errico, J.-P. Fleurial, B. B. Iversen and G. J. Snyder, Measurement of the electrical resistivity and Hall coefficient at high temperatures, Rev. Sci. Instrum., 2012, 83, 123902 CrossRef PubMed.
- C. A. Uvarov, F. Ortega-Alvarez and S. M. Kauzlarich, Enhanced High-Temperature Thermoelectric Performance of Yb14−xCaxMnSb11, Inorg. Chem., 2012, 51, 7617–7624 CrossRef CAS PubMed.
- W. G. Zeier, A. Zevalkink, Z. M. Gibbs, G. Hautier, M. G. Kanatzidis and G. J. Snyder, Thinking Like a Chemist: Intuition in Thermoelectric Materials, Angew. Chem., Int. Ed., 2016, 55, 6826–6841 CrossRef CAS PubMed.
- Y. I. Ravich, B. A. Efimova and I. A. Smirnov, Semiconducting Lead Chalcogenides, Plenum Press, 1970 Search PubMed.
- K. Koumoto and T. Mori, Thermoelectric Nanomaterials: Materials Design and Applications, 2013, vol. 182 Search PubMed.
- H. S. Kim, Z. M. Gibbs, Y. Tang, H. Wang and G. J. Snyder, Characterization of Lorenz number with Seebeck coefficient measurement, APL Mater., 2015, 3, 041506 CrossRef.
- G. S. Pomrehn, A. Zevalkink, W. G. Zeier, A. Van de Walle and G. J. Snyder, Defect-Controlled Electronic Properties in AZn2Sb2 Zintl phases, Angew. Chem., Int. Ed., 2014, 53, 3422–3426 CrossRef CAS PubMed.
- D. Cahill and R. O. Pohl, Lattice Vibrations And Heat Transport In Crystals And Glasses, Annu. Rev. Phys. Chem., 1988, 39, 93–121 CrossRef CAS.
- J. A. Cooley, P. Promkhan, S. Gangopadhyay, D. Donadio, W. E. Pickett, B. R. Ortiz, E. S. Toberer and S. M. Kauzlarich, High Seebeck Coefficient and Unusually Low Thermal Conductivity Near Ambient Temperatures in Layered Compound Yb2−xEuxCdSb2, Chem. Mater., 2018, 30, 484–493 CrossRef CAS.
Footnote |
| † Electronic supplementary information (ESI) available: Pisarenko plot of Cd and Ca substituted samples, lattice thermal conductivities, EDS elemental mapping data for Cd substituted samples, Rietveld refinement data for Cd and Ca substituted samples, total X-ray scattering refinement data using PDFgui for Cd and Ca substituted samples, point cloud distributions for Cd and Ca substituted samples, reverse Monte Carlo fit after 12 h of random atom swapping. See DOI: 10.1039/d1ma00497b |
| This journal is © The Royal Society of Chemistry 2021 |

