 Open Access Article
Laser-induced highly oriented pyrolytic graphite for high-performance screen-printed electrodes†
Alejandro Fidel
Alba
a,
Joseba
Totoricaguena-Gorriño
b,
Lia
Campos-Arias
 b,
Nikola
Peřinka
b,
Leire
Ruiz-Rubio
a,
José Luis
Vilas-Vilela
a,
Senentxu
Lanceros-Méndez
b,
Nikola
Peřinka
b,
Leire
Ruiz-Rubio
a,
José Luis
Vilas-Vilela
a,
Senentxu
Lanceros-Méndez
 bc and
Francisco Javier
del Campo
 *bc
*bc
aGrupo de Química Macromolecular, Departamento Química-Física, Universidad del País Vasco, UPV-EHU, Campus de Leioa, Vizcaya, Spain
bBCMaterials, Basque Center for Materials, Applications and Nanostructures, UPV/EHU Science Park, 48940 Leioa, Vizcaya, Spain. E-mail: Javier.delcampo@bcmaterials.net
cIKERBASQUE, Basque Foundation for Science, 48009, Bilbao, Spain
First published on 27th July 2021
Abstract
Screen-printed carbon electrodes (SPCEs) are enjoying increasing popularity in different electrochemistry areas, from electroanalysis to energy storage and power generation. Highly oriented pyrolytic graphite (HOPG), an ordered form of graphite, displays excellent electrochemical properties. However, its application in screen-printed electrodes has remained elusive. In this work, we present a straightforward laser-based process to selectively transform, in ambient conditions, the surface of conventional SPCEs into highly homogeneous HOPG. Energy densities between 6.8 and 7.7 mJ cm−2 result in a binder-free, high-purity HOPG surface with very fast electron transfer rates. The electrode transformation to HOPG has been followed by SEM, Raman spectroscopy and XPS. Cyclic voltammetry of model systems ferrocyanide, ferrocenecarboxylic acid, dopamine and hydroquinone has been used to determine variations in electrode kinetics (from 50% increase for ferrocenecarboxylic acid, up to ca. 2 orders of magnitude for ferrocyanide and dopamine) and interfacial capacitance (from 40 up to 220 μF cm−2). Finally, differential pulse voltammetry (DPV) has been used to demonstrate the ability of these electrodes to detect dopamine in the presence of an excess amount of ascorbic acid.
Introduction
The mass fabrication of electrochemical sensors and biosensors, batteries and fuel cells has benefited enormously from screen-printing technologies.1–3 Carbon-based materials, particularly graphite, have become dominant4 due to their excellent balance between suitable electrochemical properties (chemical inertness, wide accessible potential window and low background currents, among others) and affordable cost. In spite of the wealth of existing carbon allotropes, screen-printed carbon electrodes (SPCE) are mainly based on graphite1 and amorphous carbon.5 Nanocarbon-based inks containing nanotubes or graphene are less common, but they are also available.6 One important limitation of SPCE is that, due to their fabrication process, they display significantly lower electron transfer rates than their counterparts made of bulk carbon material.7 This is evidenced by the large peak-to-peak separations displayed by the cyclic voltammetry of reversible redox couples used in electrode characterization.7,8 The reason is found in the heterogeneous composition of screen-printing inks and the electrode fabrication process. In addition to graphite, these screen-printing pastes contain a dielectric polymer and a solvent, and are thermally cured. Curing temperature is critical because it affects both the conductivity and the electrochemical activity of the printed structures.7 Although high curing temperatures are preferred, only ceramic substrates withstand temperatures above 400 °C, able to eliminate both solvent and binder, leading to more conducting and electrochemically active electrodes. On the other hand, barring polyimides, polymeric substrates used in most flexible and printed electronics applications cannot cope with temperatures above 120–140 °C. As a result, electrodes printed on polymer or paper substrates seldom match their ceramic counterparts. Under these circumstances, SPCE are often modified through the addition of nanomaterials, i.e.: nanotubes,9 nanoparticles,10 or various graphene forms5 to improve their electrochemical properties. While these modifications result in better sensors5 and power sources,2 the methods are often complex and difficult to up-scale.Here, we describe a new selective method to transform the surface of graphite SPCE into a binder-free and homogeneous highly oriented pyrolytic graphite (HOPG) electrode using a CO2 laser (λ = 10.6 μm) in ambient conditions (in air). Laser has been used in the past to activate carbon electrodes,11–16 including screen-printed ones,17,18 and it has been reported to improve the crystallinity of polyacrylonitrile carbon fibers.19 However, to the best of our knowledge, this is the first report on the laser-synthesis and characterization of HOPG from a graphite SPCE.
The application of laser treatments to carbon electrodes is not new. McCreery et al. studied the laser activation of conventional glassy carbon (GC) and highly ordered pyrolytic graphite (HOPG) using a Nd:YAG laser capable of producing 20 ns and 2 mJ pulses at 532 nm,20 10 ns, 300 J pulse at 532 and 1064 nm,21 and even extremely high laser energies, in the MW cm−2 range.11–13 In contrast, Osborne et al.17 applied 1500 pulses of 200 mJ using a 193 nm excimer laser on a carbon paste electrode and observed an improvement of its electrochemical response. The heterogeneous electron transfer rate constant for the ferro/ferricyanide couple increased from 2.75 × 10⁻⁶ cm s−1 up to 2.49 × 10⁻³ cm s−1, as estimated from the corresponding peak-to-peak separation found in cyclic voltammetry experiments at 100 mV s−1. The increases in background capacitive currents reported in that work were explained on the grounds that the laser ablates the binder on the surface, leaving a larger carbon surface exposed to the solution. This work showed the changes induced by the laser on the electrode surface, including the appearance of “powdery deposits”, which they could not identify and attributed to charred binder debris. More recently, Hwang et al.18 used a CO2 laser, similar to the one used here, to create trenches on a screen-printed electrode, increasing surface area and producing capacitors with higher specific surfaces and energies. This work discussed the morphological changes induced at the micro-scale but not the laser effects on the material itself.
Thus, in the light of these and other recent reports of “laser-induced graphene”,22,23 and laser-induced graphitization,19,24 we set out to apply a CO2 laser treatment to graphite screen-printed electrodes, aiming to improve their electrochemical response. Raman spectroscopy25,26 ruled out the formation of laser induced graphene under the conditions reported here, but it strongly pointed to the formation of highly oriented pyrolytic graphite (HOPG), a very exciting electrode material.27 Moreover, the process also removes the resin binder from the electrode surface, which area is increased and results in a better electrode–solution interface.
This finding is of great significance because hitherto the fabrication of low-cost, let alone screen-printed HOPG electrodes has not been possible. The conventional means to produce HOPG involves decomposition of gaseous hydrocarbons, often acetylene, at temperatures in the range 700–2400 °C, accompanied by a hot pressing process at high pressure.28 Here we show that a mild CO2-laser irradiation can transform conventional graphite SPCEs into high-performance HOPG electrodes. This goes beyond the mere activation29–36 of a carbon screen-printed electrode as it achieves a uniform surface of highly ordered graphite, with a high potential impact in all areas of Electrochemistry.
Experimental
Reagents and materials
All chemicals and materials were used as received without further purification. Potassium hexacyanoferrate(II) trihydrate, potassium chloride, potassium nitrate, dopamine hydrochloride and L-ascorbic acid were purchased from Sigma-Aldrich (ES). RP-1 Agent (Mitsubishi Gas Company, JP) gas-barrier bags were used to preserve electrodes under dry and anoxic conditions.Melinex ST506 PET substrates were sourced from SABIC Snij-Unie (The Netherlands). GST4500 (Sun Chemical-Servilan, ES) carbon paste for working and counter electrode, C21180423D2 (Sun Chemical-Servilan, ES) silver paste for reference electrode and EDAG PF 455B (LOCTITE) dielectric polymer were used for electrode material. Note that the graphite paste composition is not known at this stage, and Sun Chemical could not provide it due to confidentiality issues. Electrodes were designed using VectorWorks 2020 Student Edition (Techlimits, ES). Film-positives and screens were outsourced to Paymser (ES). The used screens were fabricated using 90 threads per cm and 40 μm fiber diameter SEFAR 1500 fabric mounted on aluminum frames.
Instrumentation
PET substrates and electrodes were cut and treated using a 30 W CO2 Epilog Mini 18 laser engraver (Laser Project, ES). A Honle UV Technology UVACUBE 400 was used as irradiation chamber for dielectric film curing. Electrochemical measurements were performed using a SPELEC UV-vis spectroelectrochemistry instrument (Metrohm-Dropsens, ES) controlled by DropView SPELEC software (version 3.0), installed on a PC running Windows 10. The morphology of the working electrodes was assessed by scanning electron microscopy (FEG-SEM Hitachi S-4800) at 15 kV. Profilometry was performed on the working electrode for texture analysis. An Alpha-Step D100 mechanical profilometer with a strength of 1 mg was used to measure the step and the roughness of the obtained structures. Raman measurements were carried out using an InVia Raman of Renishaw equipped with a microscope Leica DMLM. A Modu-Laser brand argon ion laser with a wavelength of 514 nm was used. XPS measurements were performed with a SPECS system (Berlin, Germany) equipped with Phoibos 150 1D-DLD and monochromatic irradiation source Al Kα (1486.7 eV). DSC and TGA were carried out in a nitrogen atmosphere using a Netzsch STA 449 F3 Jupiter analyser.Electrode fabrication
The fabrication of conventional 3-electrode screen-printed electrodes has been described elsewhere,35 but a summary will be given here for convenience. First, silver tracks and pseudo-reference electrode were printed on a PET substrate. Secondly, working and auxiliary electrodes were printed, followed by a dielectric coating. Curing conditions were: 10 min at 100 °C in lab stove after silver and carbon paste printing. The dielectric film was cured by UV light for 45 seconds.Electrochemical measurements
In all cases, the open circuit potential (OCP) was determined prior to the start of any cyclic voltammetry or chronoamperometric experiments. The starting potential was then selected within 50 mV of the OCP to ensure a near zero starting current. All measurements were carried out at room temperature. Solutions. 2 mM K4Fe(CN)6 in 0.1 M KNO3, 1.3 mM dopamine in 0.1 M H2SO4, 1.4 mM hydroquinone in 0.1 M acetate buffer pH 4.3 and 0.22 mM ferrocenecarboxylic acid in 0.2 M KCl.Results and discussion
Transforming screen-printed graphite into HOPG
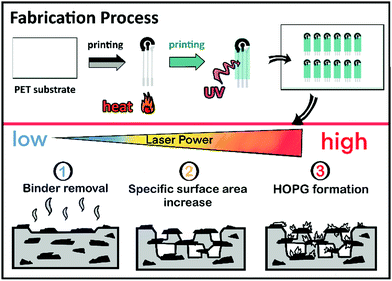
The electrodes discussed here were 2.5 mm diameter disk electrodes, screen-printed on polymeric substrates along with auxiliary and pseudo-reference electrodes in a conventional configuration to facilitate electrochemical experiments. Fig. 1 depicts the electrode fabrication process, including the laser raster treatment. Briefly, the electrodes were screen-printed in a three-layer process as described elsewhere.37 Profilometric analysis of the carbon working and auxiliary electrodes reported here yielded a thickness of 10 ± 3 μm.After printing, and before dicing, the electrodes were treated in air under ambient conditions using a 30 W Epilog Mini-18 CO2 laser engraver. The laser system has several adjustable raster parameters, including image resolution, raster velocity, and laser power. The resolution was set at 600 dpi, and the raster velocity at approximately 830 mm s−1 (50% of the instrument maximum) in all experiments. This represents a pulse duration of approximately 51 μs. Changing resolution and raster speed was ruled out to make the study more manageable.
The effect of increasing laser energies on the electrochemical properties of the electrodes was evaluated for a nominal laser power range between 1.8 W and 3.6 W. Considering the electrode size (r = 1.25 mm), it is estimated that energies of roughly 5.1 to 10.2 mJ cm−2 were applied. The minimum laser energy causing a visible effect on the electrochemical properties being 5.1 mJ cm−2. Above 10.2 mJ cm−2, on the other hand, all the printed carbon coating was ablated and there was no electrode material left. In the following, we will refer to the energy density applied to the electrodes normalized to electrode area. Thus, the figures may be considered independent of laser raster velocity or resolution and they should facilitate comparison with other reports.38 Table S1 (ESI†) provides the correspondence between laser settings and the reported energy densities.
The electrode material transformation has been evaluated as a function of applied energy, using a combination of microscopy and spectroscopy techniques including SEM, Raman and XPS. Profilometry, contact angle and four-probe sheet resistance measurements were also performed followed by a comprehensive electrochemical study.
Surface characterization
In addition to this, ca. 30 μm-thick carbon paste layers were prepared by doctor blade on PET substrates. Following the same curing treatment as the electrodes, 1 × 1 cm2 samples were prepared. The square resistance was measured using a four point probe technique. No significant changes were observed in the electrical conductivity of the printed structures, which suggests that the transformation induced by the laser on the material may have been only superficial. Indeed, the electrical resistivity of the bulk material seemed unchanged after laser treatment. Four-point probe measurements yielded very similar electrical resistivity for untreated and SPCEs exposed to different laser powers. It was concluded that film electrical resistance increased as a result of the laser ablating too deep into the original coating. As shown in Fig. S3 (ESI†), the ablated material thickness was directly proportional to laser power, at a rate between 1.9 and 2.2 μm W−1.
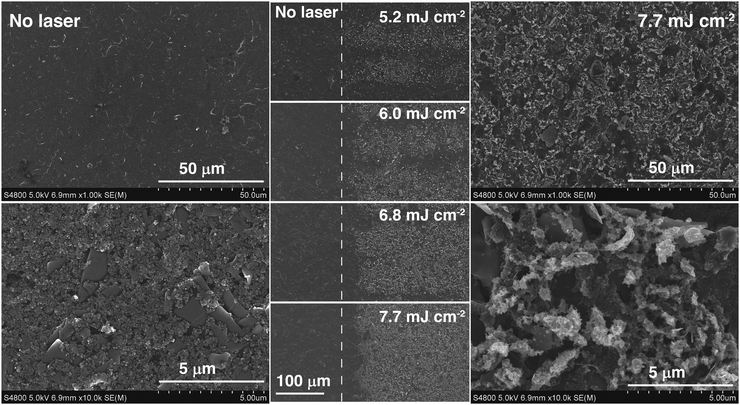
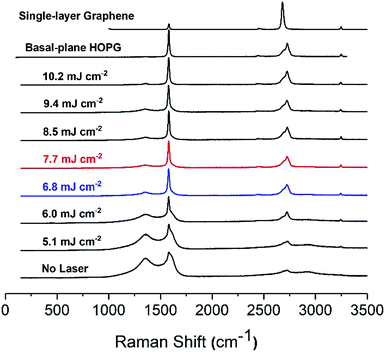
The Raman spectra of the carbon paste show the presence of the characteristic D (1360 cm−1), G (1600 cm−1) and 2D or G′ (2730 cm−1) bands, typical of graphitic materials.26 The D band is originated by the distortion of the sp2 crystal structure.41,42 It is a defect-induced Raman feature, so its removal upon laser irradiation suggests that a more ordered material has emerged. As previously shown in Fig. 2, laser treatment removes binder and brings about crystallite formation along the surface with no preferential path. The higher the laser energy applied, the larger the resulting crystallite structures. These crystals can be attributed to purification and arrangement of graphite layers by elimination of amorphous graphite and distortions in the sp2 graphitic structure. In fact, it has been reported that the intensity decrease in 1360 cm−1 band of the Raman spectrum is correlated with increasing graphite micro crystallite size and with graphitic edge plane density.43 This decrease of the 1360 cm−1 band concurs with the formation of microcrystals, as shown in SEM images of the lasered SPCE.
The G band is the graphitic band. It arises from the C–C sp2 bond and is common in sp2 carbon systems.5 It is the sharpest band in our series of spectra. In turn, the 2D (G′) band consists of two components for the bulk graphite and one sharp for graphene.44 The intensity of G and 2D bands, including the presence of two peaks at 2D evidence the presence of multi-layered graphite in the carbon inks. The untreated SPCE paste shows a high intensity for D band, indicative of distortions in the graphitic crystal structure. A wide 2D band reveals the presence of amorphous carbon. As the laser energy applied increases from 5.1 to 6.8 mJ cm−2, the D band decreases while the intensity of the G band remains stable, and the 2D becomes more defined, suggesting a higher quality graphite. Between 6.8 and 9.4 mJ cm−2, the D band is stable. The ID/IG ratio informs of the structure disorder, and lower ratios indicate less disordered structures.5,45 For an energy density of 10.2 mJ cm−2 the D band is at a minimum, and ID/IG is around 0.07. Also, the 2D band is well defined with its two components showing the presence of high-quality graphite.
Highly ordered pyrolytic graphite, HOPG, displays D and G bands at ca. 1600 cm−1 and 2650 cm−1, respectively. HOPG is turbostratic, meaning that the graphitic planes have their c-axes (perpendicular to the main plane) parallel aligned in the crystal but are rotationally disordered relative to adjacent crystals.4 Conventional HOPG is usually composed of large crystals. In contrast, the SEM images clearly show the polycrystalline nature of our printed electrodes, which nevertheless present Raman spectra consistent with basal plane HOPG.25 The intercrystallite size parameter La can be estimated from Raman spectra through eqn (1):44
 | (1) |
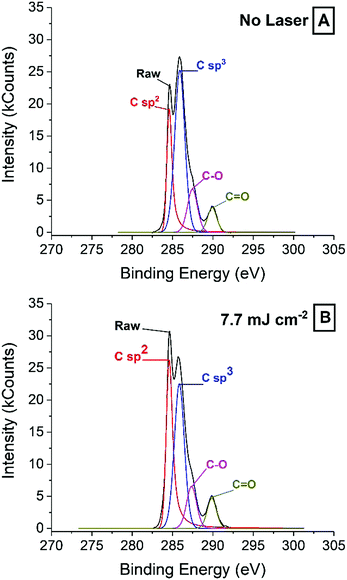 | ||
| Fig. 4 XPS spectra of a ready-printed electrode surface (A) and an electrode surface treated with 7.7 mJ cm−2 laser energy (B). | ||
While the increase in sp2 carbon found by XPS is supported by Raman spectroscopy, the significant sp3 carbon peak is harder to explain from the SEM images and the Raman spectra. The relative concentration of surface sp2 carbon increases from ca. 15% to above 26% after irradiation with laser energies 7.7 mJ cm−2 and higher, in line with Raman spectra showing a more orderly graphite structure as laser energy increases. At the same time, the sp3 content drops from about 40% down to about 35%, which is still relatively high and seemingly in contradiction with Raman spectra. The increase in graphite crystallinity may be explained on the grounds that because laser is applied in air, the high local temperatures, combined with oxygen lead to the consumption of defective graphite, which leaves behind the more thermally stable graphite. Temperatures achieved by the laser could not be accurately measured, but thermogravimetric analysis (TGA) and differential scanning calorimetry (DSC) of a carbon paste sample (Fig. S4, ESI†) revealed some interesting clues. After solvent evaporated around 200 °C, the binder decomposed between 250 °C and 400 °C. Next, graphite was decomposed in at least three distinct steps. It is likely that amorphous graphite will decomposed at lower temperatures, and more crystalline material could withstand harsher conditions. In light of this, it may be reasonable to argue that the laser can achieve temperatures above 400 °C in all cases.
Regarding the sp3 signal, on the other hand, the apparent disagreement between Raman and XPS may be due to the presence of binder polymer and ablation residues that may not give a significant Raman signal, while being clearly visible by XPS.
![[double bond, length as m-dash]](https://www.rsc.org/images/entities/char_e001.gif) O bonds on the lasered surface, which may facilitate water access into the pores.
O bonds on the lasered surface, which may facilitate water access into the pores.
Electrochemical characterization
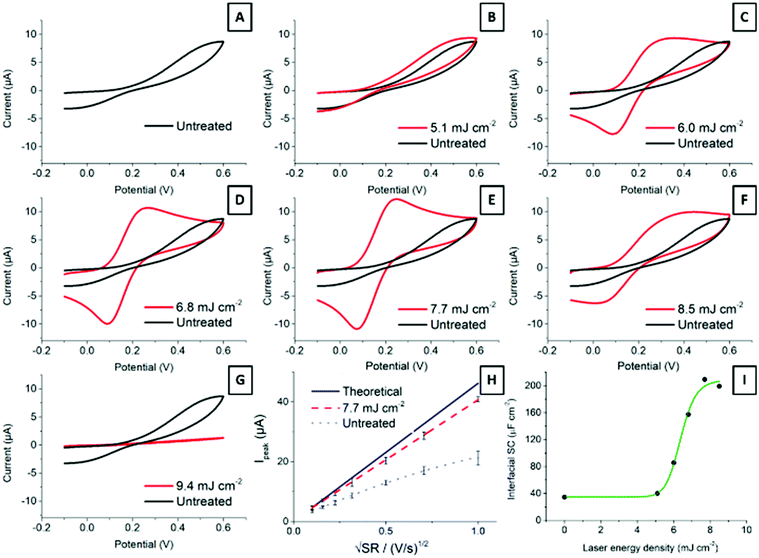
Carbon material structure determines electrochemical properties.4,28 Edge plane sites provide SPCEs with remarkable traits, as edge sites are considered to be more reactive than basal planes.27,48Fig. 5 shows cyclic voltammograms of 2.2 mM ferrocyanide in 0.1 M KNO3 at 100 mV s−1 for electrodes treated with different laser energies. The ready-printed electrode (Fig. 5A) displays peak-to-peak separation in excess of 400 mV. While this is a very large value, it is common for screen-printed electrodes cured at low temperatures.7 It is important to note how the oxidation and reduction peaks become better defined, with higher currents and narrower peak-to-peak separations, as the laser energy increases from 5.1 mJ cm−2 up to 7.7 mJ cm−2 (Fig. 5B–E). Application of higher energies has a deleterious effect on electrode performance, as shown in Fig. 5F and G. The explanation is simple: higher laser energies result in a deeper layer ablation, which increases the film resistance and precludes an effective electrode polarization.Fig. 5H shows the Randles–Ševčík representation of the oxidation peak current vs. square root of the scan rate. The plot shows the expected diffusion control for the current from the Randles–Ševčík equation substituting for the experimental conditions and electrode geometry described in the Experimental section, as well as the current from a ready-printed electrode and that of the same electrode after exposure to 7.7 mJ cm−2 laser energy. The latter dataset deviates much less from the theoretically expected behaviour than the ready-printed electrode. This is due to a more homogeneous electrode surface displaying faster electron transfer rates.
Last, Fig. 5I shows the increase in interfacial capacitance as a function of laser energy. This capacitance has been determined from charging currents measured from cyclic voltammetry at scan rates below 200 mV s−1 according to the method described before.49 In short, the potential was scanned between −0.2 and 1 V vs. Ag/AgCl, in 0.1 M H2SO4. The current at 0.5 V vs. Ag was plotted against the scan rate and the capacitance was calculated from the slope of the linear region. Note that the capacitance measured at other potentials may differ, and that we are only providing this value to show the changes that follow laser treatment. The differential capacitance measured this way increased in direct proportion to the laser energy applied, from 38 μF cm−2 at the ready-printed electrode, 45 μF cm−2 at 5.1 mJ cm−2, and up to 220 μF cm−2 following treatment with 8.5 mJ cm−2. This capacitance value is in line with previous reports by McCreery on the laser activation of glassy carbon electrodes.18
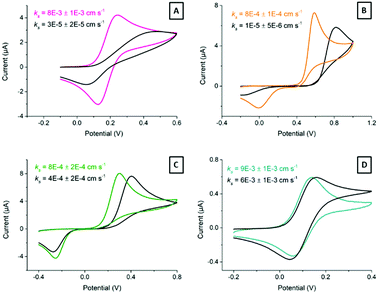
Ferrocyanide is typically used as model system due to its reversibility and wide availability. However, it is also sensitive to electrode surface quality.50 Moreover, we next explored the response of the laser-treated electrodes towards other benchmark redox pairs: dopamine, hydroquinone and ferrocenecarboxylic acid. Fig. 6 shows typical cyclic voltammograms (10 mV s−1) obtained for these pairs at ready-printed and at 7.7 mJ cm−2, which we consider close to the optimum laser treatment. Direct CO2 laser activation resulted in the greatest electron transfer enhancements for ferrocyanide (Fig. 6A) and dopamine (Fig. 6B), which became noticeably more reversible according to the lower peak-to-peak separation, lower onset potentials, and higher currents. Dopamine undergoes inner-sphere electron transfer and is affected by surface oxides, so certain interaction with the electrode surface is expected.51 While ferrocyanide, on the other hand, is not rigorously “outer-sphere”, it is much more reversible than dopamine and reportedly surface oxide independent.4
Two laser effects can be responsible for the enhancement in electron transfer. First, physi- and chemisorbed particles and impurities may be removed by laser ablation. Second, active sites may be generated throughout HOPG microcrystalline planes. In the case of HOPG, the electron transfer rates for ferrocyanide and dopamine systems increase substantially when microstructural edge plane defects are formed by laser treatment. The high temperatures brought about by the laser action likely not only consume the binder, but also any amorphous or highly defective graphite particles too, leaving only the most crystalline and hence temperature resistant graphite. The edges of these highly crystalline regions are most likely responsible for the fast electron transfer rates observed.15
However, hydroquinone (Fig. 6C) and ferrocenecarboxylic acid (Fig. 6D) did not show such significant improvement in electron transfer. Both hydroquinone and ferrocenecarboxylic acid are considered outer-sphere redox systems, relatively insensitive to electrode surface composition.
The apparent heterogeneous electron transfer rate constant, ks, for these systems, particularly dopamine and hydroquinone, was estimated through simulation using KISSA software52,53 over the scan rate range between 10 mV s−1 and 1 V s−1. Note that Nicholson's54 and related methods are valid only for systems displaying ΔEp ≤ 200 mV. On the other hand, Matsuda and Ayabe's method,55 can be applied to systems displaying wider voltammetric peak separations, but the issue here is that the voltammograms display too large ΔEp even for very slow scan-rates, making it very difficult to choose the scan-rate meeting the condition Λ = 1. Here,  , where n is the number of electrons, F is Faraday constant, D is the diffusion coefficient of the electroactive species, ν is the scan rate, R is the gas constant and T the absolute temperature. In the cases of dopamine and hydroquinone, where protons are also involved in their respective mechanisms, only simulation provides a reliable way to assess the electron transfer steps.56
Regarding the time-stability of the laser treatment, we studied the electrode behaviour over time (data not shown but available on reasonable request). Activity losses around 50% were observed through ferrocyanide voltammetry a week after laser ablation. However, these could be almost completely prevented by storing the electrodes in an inert atmosphere, which suggests that reaction with ambient oxygen is likely to be detrimental, in line with observations by other workers.28
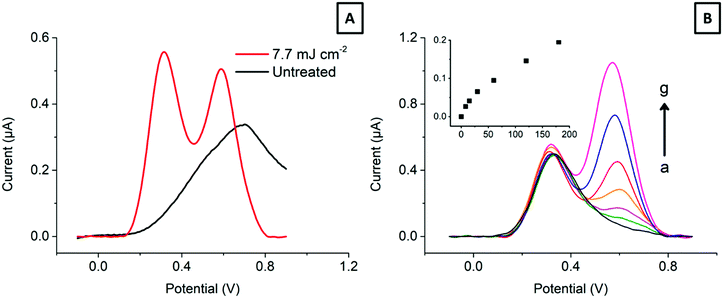
Electroanalysis of dopamine in the presence of ascorbic acid. Finally, to show the benefits of the laser treatment in an electroanalytical application, we have addressed the detection of dopamine, a neurotransmitter, in the presence of a large excess of ascorbic acid, a common interfering agent. Fig. 7 shows typical differential pulse voltammograms (DPV) of 0–180 μM dopamine in the presence of 150 μM ascorbic acid at an electrode lasered with 7.7 mJ cm−2.
The DPV parameters consider the electrode interfacial capacitance (see Fig. 5 above) and the current response. Fig. 7A clearly shows the ability of the treated HOPG-SPCE to resolve both signals, compared to the conventional SPCE. Moreover, as Fig. 7B displays, the two signals are resolved over a wide dopamine concentration range, making it possible to detect dopamine in the low μM range, with ascorbic acid present in a near 100-fold excess. This is attributed to the ability of HOPG to discriminate between electroactive species with close redox potentials based on their different surface reactivity, in line with other reports.9,57,58
Conclusions
We have shown that the application of relatively mild laser energies on graphite SPCEs, using a CO2 laser in air, can bring three important advantages, namely, (i) the removal of surface binder, (ii) an increase in surface porosity and (iii) the purification of amorphous graphite and its transformation into HOPG. The former two benefits have been demonstrated by SEM images and contact angle measurements, while Raman spectroscopy supported the latter one. Surface binder removal is of great importance in the fabrication of sensors, energy storage and generation devices, and electrode interfaces, as it prevents contamination and ensures a biocompatible and chemically homogeneous interface. The increase in surface area can be more useful in power generation devices, such as supercapacitors, but it may also be exploited in electroanalysis. Last, the HOPG produced by laser irradiation of graphite microparticles in the printed electrodes display very high electrochemical activity. This can equally benefit sensors, actuators, and energy storage devices. In all cases studied, both inner- and outer-sphere systems, we have observed higher electron transfer rates after laser irradiation of the SPCE. The higher rates of electron transfer are evident from the voltammetric peak-to-peak separations over a range of scan rates. These benefits have been demonstrated through the detection of dopamine, a neurotransmitter, in the presence of ascorbic acid.Raman and XPS analysis have shown that the described laser treatment results in a relative increase of sp2 carbon, indicating a more ordered material. Indeed, crystallite size has been calculated according to Pimenta et al.44 We have found that laser treatment increases crystallite size lattice parameter La from 20 nm for the untreated electrodes up to 240 nm for the laser-treated case (10.2 mJ cm−2). The possibility to tune the crystallite size and thus obtain graphite closer to either EPPG or BPPG reproducibly is one of the greatest advantages of the reported process.
Another significant advantage is the process selectivity, which also makes it extremely energy efficient. Because the transformation only occurs in the irradiated areas and the CO2 laser spot size is in the order of 100 μm, it is possible to treat only the desired electrode regions, leaving the rest of the surface untouched. Patterning of electrodes with areas of different reactivity can lead to the simultaneous detection of several analytes on a single electrode or the production of arrays of different electrodes in a single process. Laser processing is much more efficient in terms of time, energy and resources than other reported SPCE activation methods,30,32,33,36,59 leading to comparable if not superior results.
In summary, the process and the new electrode material reported here are of great significance. The resulting surfaces are free from binder impurities, the exposed graphite is of high purity and crystallinity, and the surface area increases compared to readily printed structures. The process allows some flexibility, as it is possible to tune the graphite form between EPPG and BPPG. The resulting electrodes display excellent electrochemical properties and can generally benefit electrochemical applications.
Author contributions
Alejandro Fidel Alba: investigation, formal analysis, visualization, writing-original draft. Joseba Totoricaguena-Gorriño: formal analysis, visualization, writing-original draft. Lia Campos-Arias: investigation. Nikola Peřinka: investigation, writing-review and editing. Leire Ruiz-Rubio: writing-review and editing. José Luis Vilas-Vilela: writing-review and editing, funding acquisition. Senentxu Lanceros-Méndez: writing-review and editing, funding acquisition. Francisco Javier del Campo: conceptualization, methodology, supervision, writing-original draft.Conflicts of interest
There are no conflicts to declare.Acknowledgements
The authors are grateful for the technical and human support provided by SGIker of UPV/EHU and European funding (ERDF and ESF). We acknowledge funding from the European Union's Horizon 2020 Programme for Research, ICT-02-2018 – Flexible and Wearable Electronics, Grant agreement no. 825339 – WEARPLEX. Lía Campos-Arias thanks the University of Basque Country (UPV/EHU) for doctoral grant PIFI20/04. Project number PID2020-113154RB-C22 from the Spanish Ministry of Science and Innovation is also gratefully acknowledged.Notes and references
- G. Hughes, K. Westmacott, K. Honeychurch, A. Crew, R. Pemberton and J. Hart, Biosensors, 2016, 6, 50 CrossRef PubMed.
- R. Gonçalves, P. Dias, L. Hilliou, P. Costa, M. M. Silva, C. M. Costa, S. Corona-Galván and S. Lanceros-Méndez, Energy Technol., 2021, 9, 1–12 Search PubMed.
- A. J. Bandodkar, J.-M. You, N.-H. Kim, Y. Gu, R. Kumar, A. M. V. Mohan, J. Kurniawan, S. Imani, T. Nakagawa, B. Parish, M. Parthasarathy, P. P. Mercier, S. Xu and J. Wang, Energy Environ. Sci., 2017, 10, 1581–1589 RSC.
- R. L. McCreery, Chem. Rev., 2008, 108, 2646–2687 CrossRef CAS PubMed.
- F. C. Vicentini, A. E. Ravanini, L. C. S. Figueiredo-Filho, J. Iniesta, C. E. Banks and O. Fatibello-Filho, Electrochim. Acta, 2015, 157, 125–133 CrossRef CAS.
- J. R. Camargo, L. O. Orzari, D. A. G. Araújo, P. R. de Oliveira, C. Kalinke, D. P. Rocha, A. Luiz dos Santos, R. M. Takeuchi, R. A. A. Munoz, J. A. Bonacin and B. C. Janegitz, Microchem. J., 2021, 164, 105998 CrossRef CAS.
- R. O. Kadara, N. Jenkinson and C. E. Banks, Sens. Actuators, B, 2009, 138, 556–562 CrossRef CAS.
- P. Fanjul-Bolado, D. Hernández-Santos, P. J. Lamas-Ardisana, A. Martín-Pernía and A. Costa-García, Electrochim. Acta, 2008, 53, 3635–3642 CrossRef CAS.
- M. Moreno, A. S. Arribas, E. Bermejo, M. Chicharro, A. Zapardiel, M. C. Rodríguez, Y. Jalit and G. A. Rivas, Talanta, 2010, 80, 2149–2156 CrossRef CAS PubMed.
- S. Jahani and H. Beitollahi, Electroanalysis, 2016, 28, 2022–2028 CrossRef CAS.
- K. D. Sternitzke and R. L. McCreery, Anal. Chem., 1990, 62, 1339–1344 CrossRef CAS.
- R. K. Jaworski and R. L. McCreery, J. Electroanal. Chem., 1994, 369, 175–181 CrossRef CAS.
- W. Huang and R. McCreery, J. Electroanal. Chem., 1992, 326, 1–12 CrossRef CAS.
- M. T. McDermott, K. Kneten and R. L. McCreery, J. Phys. Chem., 1992, 96, 3124–3130 CrossRef CAS.
- Y. W. Alsmeyer and R. L. McCreery, Langmuir, 1991, 7, 2370–2375 CrossRef CAS.
- R. S. Robinson, K. Sternitzke, M. T. McDermott and R. L. McCreery, J. Electrochem. Soc., 1991, 138, 2412–2418 CrossRef CAS.
- M. D. Osborne, B. J. Seddon, R. A. W. Dryfe, G. Lagger, U. Loyall, H. Schäfer and H. H. Girault, J. Electroanal. Chem., 1996, 417, 5–15 CrossRef CAS.
- J. Y. Hwang, M. Li, M. F. El-Kady and R. B. Kaner, Adv. Funct. Mater., 2017, 27, 1605745 CrossRef.
- Y. Sha, W. Yang, S. Li, L. Yao, H. Li, L. Cheng, H. Yan, W. Cao and J. Tan, RSC Adv., 2018, 8, 11543–11550 RSC.
- E. Hershenhart, R. L. McCreery and R. D. Knight, Anal. Chem., 1984, 56, 2256–2257 CrossRef CAS.
- M. Poon and R. L. McCreery, Anal. Chem., 1986, 58, 2745–2750 CrossRef CAS.
- Y. Li, D. X. Luong, J. Zhang, Y. R. Tarkunde, C. Kittrell, F. Sargunaraj, Y. Ji, C. J. Arnusch and J. M. Tour, Adv. Mater., 2017, 29, 1700496 CrossRef PubMed.
- R. Ye, D. K. James and J. M. Tour, Acc. Chem. Res., 2018, 51, 1609–1620 CrossRef CAS PubMed.
- S. Lee and S. Jeon, ACS Sustainable Chem. Eng., 2019, 7, 2270–2275 CrossRef CAS.
- G. Katagiri, H. Ishida and A. Ishitani, Carbon, 1988, 26, 565–571 CrossRef CAS.
- Y. Wang, D. C. Alsmeyer and R. L. McCreery, Chem. Mater., 1990, 2, 557–563 CrossRef CAS.
- C. E. Banks, T. J. Davies, G. G. Wildgoose and R. G. Compton, Chem. Commun., 2005, 829–841 RSC.
- R. C. Alkire, P. N. Bartlett and J. Lipkowski, Electrochemistry of Carbon Electrodes, Wiley-VCH, Weinheim, Germany, 2015 Search PubMed.
- J. Wang, M. Pedrero, H. Sakslund, O. Hammerich and J. Pingarrón, Analyst, 1996, 121, 345–350 RSC.
- C. Churinsky and C. Grgicak, ECS Trans., 2014, 61, 1–8 CAS.
- C. X. Du, L. Han, S. L. Dong, L. H. Li and Y. Wei, IOP Conf. Ser.: Mater. Sci. Eng., 2016, 137, 012060 Search PubMed.
- M. I. González-Sánchez, B. Gómez-Monedero, J. Agrisuelas, J. Iniesta and E. Valero, Electrochem. Commun., 2018, 91, 36–40 CrossRef.
- M. I. González-Sánchez, M. I. Romero-Llapa, B. Gómez-Monedero, R. Jiménez-Pérez, J. Iniesta and E. Valero, Electroanalysis, 2019, 31, 2437–2445 CrossRef.
- L. R. Cumba, C. W. Foster, D. A. C. Brownson, J. P. Smith, J. Iniesta, B. Thakur, D. R. Do Carmo and C. E. Banks, Analyst, 2016, 141, 2791–2799 RSC.
- J. Wang, Z. Xu, L. Wang, J. Liu and M. Zhang, J. Electrochem. Soc., 2018, 165, E674–E678 CrossRef CAS.
- X. Yuan, L. Ma, J. Zhang and Y. Zheng, Appl. Surf. Sci., 2021, 544, 148760 CrossRef CAS.
- N. Uria, E. Fiset, M. A. Pellitero, F. X. Muñoz, K. Rabaey and F. J. del Campo, Environ. Sci. Ecotechnol., 2020, 3, 100053 CrossRef.
- F. Wang, K. Wang, B. Zheng, X. Dong, X. Mei, J. Lv, W. Duan and W. Wang, Mater. Technol., 2018, 33, 340–356 CrossRef CAS.
- J. Schindelin, I. Arganda-Carreras, E. Frise, V. Kaynig, M. Longair, T. Pietzsch, S. Preibisch, C. Rueden, S. Saalfeld, B. Schmid, J.-Y. Tinevez, D. J. White, V. Hartenstein, K. Eliceiri, P. Tomancak and A. Cardona, Nat. Methods, 2012, 9, 676–682 CrossRef CAS PubMed.
- G. G. Hoffmann, G. de With and J. Loos, Macromol. Symp., 2008, 265, 1–11 CrossRef CAS.
- Y. Wang, D. C. Alsmeyer and R. L. McCreery, Chem. Mater., 1990, 2, 557–563 CrossRef CAS.
- A. C. Ferrari, Solid State Commun., 2007, 143, 47–57 CrossRef CAS.
- R. Bowling, R. T. Packard and R. L. McCreery, Langmuir, 1989, 5, 683–688 CrossRef CAS.
- M. A. Pimenta, G. Dresselhaus, M. S. Dresselhaus, L. G. Cançado, A. Jorio and R. Saito, Phys. Chem. Chem. Phys., 2007, 9, 1276–1290 RSC.
- N. Festinger, K. Morawska, V. Ivanovski, M. Ziabką, K. Jedlińska, W. Ciesielski and S. Smarzewska, Sensors, 2020, 20, 1684 CrossRef CAS PubMed.
- R. Blume, D. Rosenthal, J. P. Tessonnier, H. Li, A. Knop-Gericke and R. Schlögl, ChemCatChem, 2015, 7, 2871–2881 CrossRef CAS.
- C. Dorrer and J. Rühe, Soft Matter, 2009, 5, 51–61 RSC.
- C. E. Banks and R. G. Compton, Analyst, 2005, 130, 1232–1239 RSC.
- L. Da Silva, L. De Faria and J. F. Boodts, Electrochim. Acta, 2001, 47, 395–403 CrossRef CAS.
- L. Xiong, C. Batchelor-McAuley, K. R. Ward, C. Downing, R. S. Hartshorne, N. S. Lawrence and R. G. Compton, J. Electroanal. Chem., 2011, 661, 144–149 CrossRef CAS.
- A. J. Bard, J. Am. Chem. Soc., 2010, 132, 7559–7567 CrossRef CAS PubMed.
- C. Amatore, O. Klymenko and I. Svir, Electrochem. Commun., 2010, 12, 1165–1169 CrossRef CAS.
- C. Amatore, O. Klymenko and I. Svir, Electrochem. Commun. DOI:10.1016/j.elecom.2010.06.009.
- R. S. Nicholson, Anal. Chem., 1965, 37, 1351–1355 CrossRef CAS.
- R. G. Compton and C. E. Banks, Understanding Voltammetry, World Scientific, Singapore, 3rd edn, 2007, p. 439 Search PubMed.
- X. Ji, C. E. Banks, D. S. Silvester, A. J. Wain and R. G. Compton, J. Phys. Chem. C, 2007, 111, 1496–1504 CrossRef CAS.
- A. N. Patel, S. Tan, T. S. Miller, J. V. Macpherson and P. R. Unwin, Anal. Chem., 2013, 85, 11755–11764 CrossRef CAS PubMed.
- M. Hadi and A. Rouhollahi, Anal. Chim. Acta, 2012, 721, 55–60 CrossRef CAS PubMed.
- L. R. Cumba, C. W. Foster, D. A. C. Brownson, J. P. Smith, J. Iniesta, B. Thakur, D. R. do Carmo and C. E. Banks, Analyst, 2016, 141, 2791–2799 RSC.
Footnote |
| † Electronic supplementary information (ESI) available. See DOI: 10.1039/d1ma00582k |
| This journal is © The Royal Society of Chemistry 2021 |

