A detailed computational study on binding of kinase inhibitors into β-cyclodextrin: inclusion complex formation†
Maryam
Faraj Pour Mojdehi
,
Mokhtar
Ganjali Koli
,
Mahsa
Dolatkhah Ouch Bolagh
,
Mina
Ghane Gardeh
and
Seyed Majid
Hashemianzadeh
 *
*
Molecular Simulation Research Laboratory, Department of Chemistry, Iran University of Science and Technology, P.O. Box16846-13114, Tehran, Iran. E-mail: hashemianzadeh@iust.ac.ir
First published on 8th December 2020
Abstract
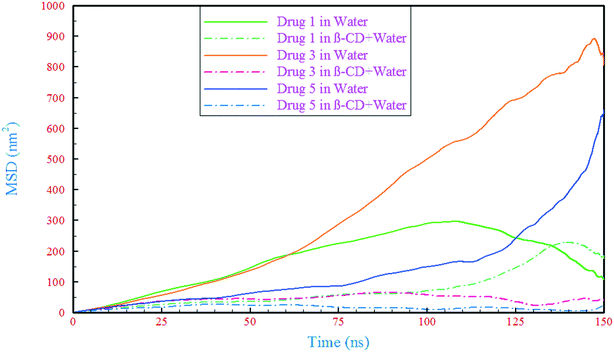
It is well known that the limited aqueous solubility of some drugs often reduces their bioavailability to targets. Inclusion complex formation of drugs with β-cyclodextrin is one of the best approaches for drug delivery improvement. Extensive microscopic molecular dynamics simulations were performed to study the interactions between β-cyclodextrin and a class of kinase inhibitor drugs. Solvation free energy calculations demonstrated that these drugs are insoluble in water and reinforced the need for a carrier to increase the solubility. The binding of these drugs into β-cyclodextrin was assessed by calculating the binding free energy, and it was found that all drugs tended to be bound thermodynamically. Examination of the dynamic properties showed that the drugs were loaded into β-cyclodextrin, so due to the loading of drugs into the β-cyclodextrin, the mean square displacement (MSD) of all the drugs drastically decreased. The loading of drugs was accompanied by pushing of water out of the center of the β-cyclodextrin cavity. The drugs showed different orientations and mechanisms for loading into β-cyclodextrin. By studying the root mean square fluctuation (RMSF), it was revealed that the drugs were flexible in interaction with β-cyclodextrin; in contrast, β-cyclodextrin retained its rigidity in all simulated systems.
Design, System, ApplicationIn this work, the potential of theoretical approaches to study, build, and design a new inclusion complex based on β-cyclodextrin as a carrier and kinase inhibitors (three anti-cancer drugs as a guest) was investigated. This study introduces β-CD as an adequate carrier in the design of drug-delivery systems for these new kinase inhibitors, and examples can be found in the main text of the article. A new drug-delivery system is designed for this class of drugs, and dynamic and thermodynamic studies justify its efficacy and effectiveness. In brief, using theoretical tools, new “host–guest” supramolecular complexes were built and studied. This new design consists of an integrated system of drugs (guest) and a carrier (host) that can be used for drug-delivery of this category of drugs. |
1. Introduction
The natural α-, β- and γ-cyclodextrins (CDs) are cyclic oligosaccharides that attracted considerable scientific attention because of their potential to improve the physicochemical stability, solubility, dissolution rate, and bioavailability of drugs. Because of the presence of CH2 groups, there is a unique hydrophobic cavity in the core of their structures while the outer layer is mostly hydrophilic due to the primary and secondary hydroxyl groups.1 Hence, CDs have a well-proven ability to trap or encapsulate other molecules which makes them a great choice to form “host–guest” supramolecular complexes.2,3 CDs have been widely used to enhance the aqueous solubility of drugs, and ensure higher bioavailability and shelf-life of drugs as well as protecting susceptible drugs against hydrolysis, oxidation, and photodecomposition.4–6 A drug delivery system is expected to deliver the required amount of drug to the targeted site for the necessary period of time, both efficiently and precisely. Different carrier materials are being constantly developed to overcome the undesirable properties of drug molecules. In this regard, CDs have been found as potential candidates because of the mentioned abilities.7 For example, it is well known that 18β-glycyrrhetinic acid (derived from licorice) has anti-inflammatory effects. The use of a complex of 18β-glycyrrhetinic acid and hydroxypropyl γ-cyclodextrin, to improve oral bioavailability, significantly increased the 18β-glycyrrhetinic acid concentration in the plasma of indomethacin treated mice, which in turn ameliorated the small intestinal injury caused by indomethacin administration.8Various factors such as the chemical structures as well as physicochemical properties of both the drug and the CD, solvents, thermodynamic interactions between the CD, guest molecule and solvent, method of preparation, additives, temperature, etc. affected the inclusion complex formation. It has been proven that the structure of drug moieties has a key role in the formation of drug–CD complexes and should have certain characteristics such as a skeleton with more than 5 atoms (C, P, S, N) and less than 5 condensed rings, a melting point <250 °C and a structure with a key functional group (hydrophilic moiety) that causes drugs to be placed in the hydrophobic CD cavity.9,10 Among the CDs, the extended use of β-CD and its derivatives as drug carriers is due to its cavity size and relative ease of chemical modification. β-CD has a relatively low solubility in water, compared with α- and γ-CDs that are nine and eleven times more soluble, respectively.11,12
Over the past few years, structural and thermodynamics considering of drug–CD interactions in both experimental and theoretical studies have grown.13–18 One of the most important classes of drugs are kinase inhibitors.19,20 Kinases are enzymes that add phosphate groups (PO43−) to other molecules. A large protein complex mediates the phosphorylation of the inhibitor of kB (IκB), which results in the activation of nuclear factor κB (NF-κB). Two subunits of this complex, IκB kinase alpha (IKKα) and IκB kinase beta (IKKβ) that are serine kinases, are required for NF-κB activation.21 In addition, two protein kinases that exhibit structural similarity to IKKα and IKKβ are IKKε and TBK1 (TANK-binding kinase), which activate the critical interferon response factor 3 (IRF3) and IRF7.22,23 There are multiple disease states that are mediated by IKKε, TBK1, and/or SIK2 mechanisms, and inhibition of these may have an impact on the treatment of various diseases like breast cancer, ovarian cancer, obesity, asthma, psoriasis, Crohn's disease, and septic shock.
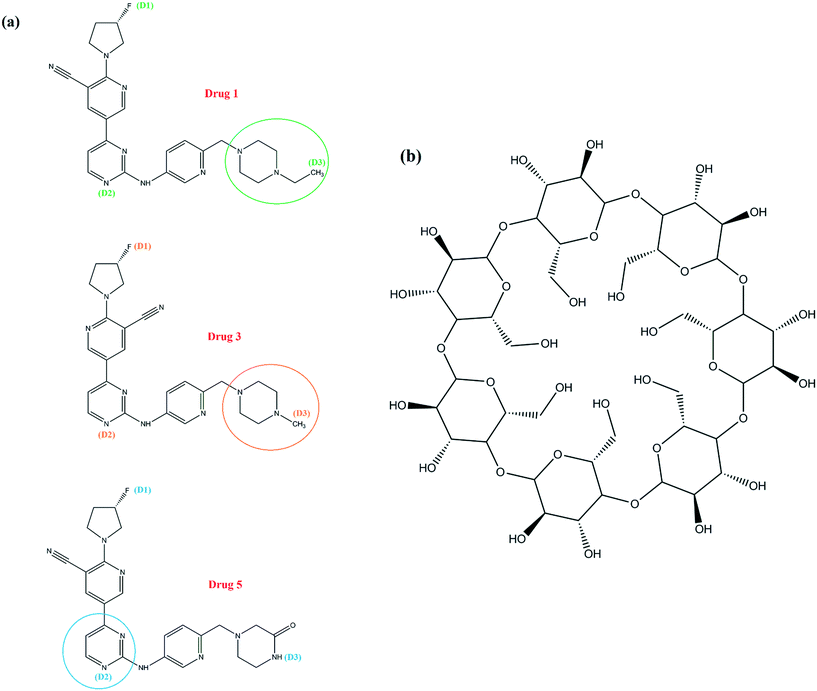
Kinase inhibitors can be important treatments for human diseases and the field of kinase inhibitor chemistry is swiftly expanding, with the increase of innovation in preclinical target validation and medicinal chemistry, and supporting experimental and computational technologies emerging.24 Kargbo25 introduced six prominent compounds based on the 5-(pyrimidin-4-yl)-2-(pyrrolidin-1-yl)nicotinonitrile structure as inhibitors, which can affect IKKε, TBK1, and/or SIK2 activity and lead to the mentioned disease process, and reported their impact on the enzyme potency of the IKKε, TBK1 and/or SIK2 kinases including inhibition values, volume of distribution (VD), and biological half-life (t1/2). The results showed that these compounds can play a role in inhibition of the IKKε, TBK1 and SIK2 kinases.
Molecular dynamics (MD) simulations enable us to get a very detailed picture of molecular events and are powerful and precise tools that provide valuable complementary information about details of interactions between drug molecules and membranes, proteins, and CDs for experimental studies.26–30 In this research, to get a detailed understanding based on molecular mechanisms, a theoretical study of the interactions between β-CD (as a carrier) and Kargbo's kinase inhibitors has been done.
2. Computational details
2.1 Molecular dynamics simulations
2.2 Quantum details
All geometries were optimized using density functional theory (DFT) based on B3LYP and the standard 6-31+G(d) basis set.45–47 The conductor-like polarizable continuum model (CPCM) was used to apply solvent effects of water.48,49 To investigate the reactive sites of the structures for electrophilic and nucleophilic reactions, the molecular electrostatic potential (MEP) was studied using 6-31+G (d).50,51 All calculations were performed using the Gaussian 03 program package.523. Results and discussion
3.1 Inclusion complex formation: dynamic properties
| Drugs | Drug 1 | Drug 3 | Drug 5 |
|---|---|---|---|
| Systems | |||
| Drug + β-CD + water | 53.36° (±0.65) | 65.53° (±1.89) | 86.93° (±3.49) |
| Drug + water | 60.44° (±1.16) | 67.14° (±1.16) | 65.64° (±0.92) |
| Systems | Number of H-bonds between β-CD and drug | Number of H-bonds between water and special part of drug | Number of H-bonds between water and drug |
|---|---|---|---|
| β-CD + drug 1 + water | 0.390 (±0.030) | 0.014 (±0.005) | 1.990 (±0.028) |
| Drug 1 + water | — | 0.081 (±0.006) | 2.361 (±0.029) |
| β-CD + drug 3 + water | 0.460 (±0.030) | 0.021 (±0.003) | 1.970 (±0.132) |
| Drug 3 + water | — | 0.093 (±0.007) | 1.226 (±0.018) |
| β-CD + drug 5 + water | 0.847 (±0.090) | 0.540 (±0.007) | 2.660 (±0.029) |
| Drug 5 + water | — | 0.917 (±0.019) | 3.860 (±0.035) |
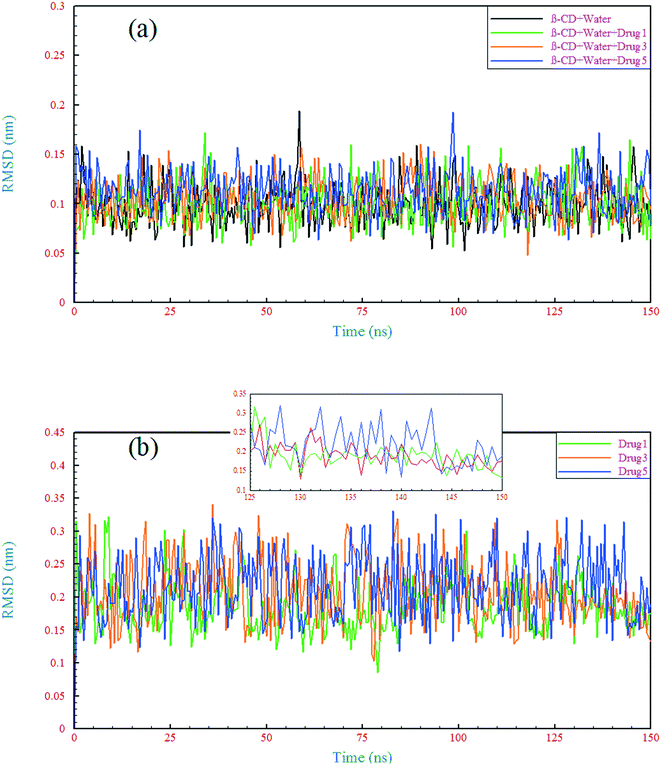 | ||
| Fig. 5 Root mean square deviation of the β-CD structure (a) and drugs (b) in different simulated systems as a function of time. | ||
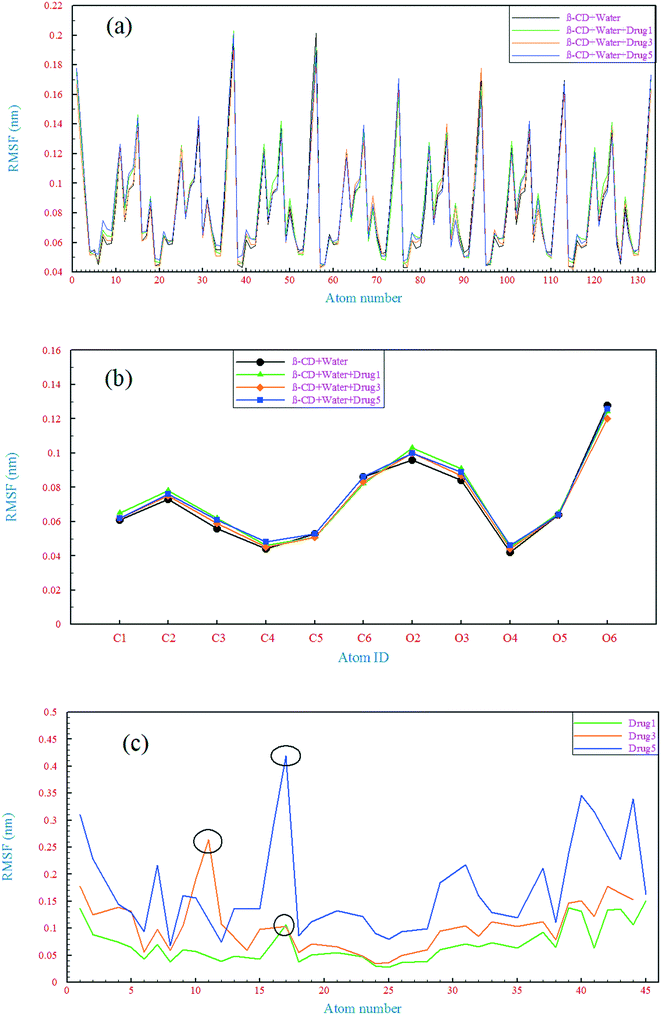 | ||
| Fig. 6 Root mean square fluctuation of all the β-CD atoms (a), heavy atoms of β-CD (b), and heavy atoms of the drugs (c). | ||
The RMSD behavior of the drugs, however, is somewhat different; all the drugs have a relatively high RMSD until near the end of simulation (especially drug 5). As seen in Fig. 5b, in the last 6 ns of each simulation, the dynamic behavior of the drugs has stabilized and shows a small fluctuation around 0.18 nm, which can be regarded as a reason for the appropriate and final loading of the drug. Analyzing the RMSF of heavy atoms of the drugs showed that the highest RMSF, and therefore the highest flexibility among the drugs, is ascribed to drug 5. The highest RMSFs are seen in the atoms at the last two ends of the molecular structures. In the case of drug 5, these two ends have high values, which is in agreement with the results obtained from examining the internal angle of this drug in section 3.1.1, and evidence for this claim was discussed. Interestingly, the highest peak in the RMSF for drugs 3 and 5 is ascribed to nitrogen with a triple bond and of course one of the highest peaks for drug 1 belongs to this atom, as shown by the circles in Fig. 6c.
3.2 Inclusion complex formation: thermodynamic properties
| Distance | 0–0.5 nm | 0.5–0.8 nm | .8–0.9 nm | 0.9–1.0 nm | 0–1.0 nm (total) |
|---|---|---|---|---|---|
| Systems | |||||
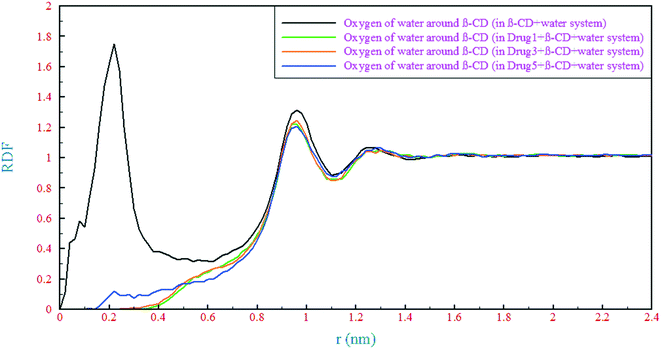
| β-CD + water (reference) | 9.75 (±0.06) | 20.59 (±0.07) | 22.85 (±0.09) | 46.84 (±0.11) | 100.03 (±0.12) |
| β-CD + Drug 1 + water | 0.77 (±0.03) | 16.90 (±0.09) | 21.17 (±0.10) | 43.61 (±0.14) | 82.45 (±0.15) |
| β-CD + Drug 3 + water | 1.02 (±0.08) | 16.55 (±1.08) | 21.49 (±1.54) | 44.43 (±1.33) | 83.48 (±1.34) |
| β-CD + Drug 5 + water | 1.97 (±0.05) | 14.60 (±0.11) | 21.04 (±0.10) | 43.32 (±0.16) | 80.93 (±0.17) |
| Energies (kJ mol−1) | Coulombic between water and drug | vdW between water and drug | Coulombic between water and β-CD | vdW between water and β-CD | Coulombic between drug and β-CD | vdW between drug and β-CD | Free energy of solvation | Free energy of binding |
|---|---|---|---|---|---|---|---|---|
| Systems | ||||||||
| β-CD + drug 1 + water | −35.57 (±0.22) | −107.07 (±0.13) | −204.18 (±1.50) | −211.89 (±0.25) | −9.18 (±0.25) | −136.52 (±0.58) | — | −72.10 (±1.12) |
| Drug 1 + water | −48.52 (±0.44) | −162.32 (±2.30) | — | — | — | — | 42.64 (±0.56) | — |
| β-CD + drug 3 + water | −35.70 (±0.89) | −103.59 (±1.90) | −204.41 (±1.30) | −217.31 (±0.45) | −7.83 (±0.26) | −128.46 (±1.10) | — | −62.41 (±1.56) |
| Drug 3 + water | −29.00 (±0.12) | −141.12 (±0.83) | — | — | — | — | 43.05 (±0.99) | — |
| β-CD + drug 5 + water | −52.58 (±0.57) | −100.00 (±0.66) | −204.63 (±1.10) | −220.69 (±0.59) | −9.53 (±0.17) | −120.34 (±0.61) | — | −49.08 (±1.69) |
| Drug 5 + water | −76.50 (±0.41) | −153.24 (±1.10) | — | — | — | — | 20.04 (±0.34) | — |
| β-CD + water | — | — | −253.17 (±1.20) | −292.04 (±0.45) | — | — | — | — |
Moreover, the findings about the solvation free energies in water are in good agreement with the experimental observations related to the VD and t1/2 of the drugs, so it is determined that among the three drugs, the highest VD and t1/2 are ascribed to drug 3 and the lowest ones are ascribed to drug 5.25 In fact, drug 3 tends to dissolve in fat more than the other two drugs. The study of free energy can be an approach to assess the metabolism and excretion of these drugs, so a suitable carrier can increase or decrease their dissolution in adipose tissue. From the results of this section, it can be seen that the formation of drug/β-CD complexes is highly thermodynamically desirable and therefore the formation of these complexes can increase the concentration of these drugs in plasma and reduce their metabolism and excretion.
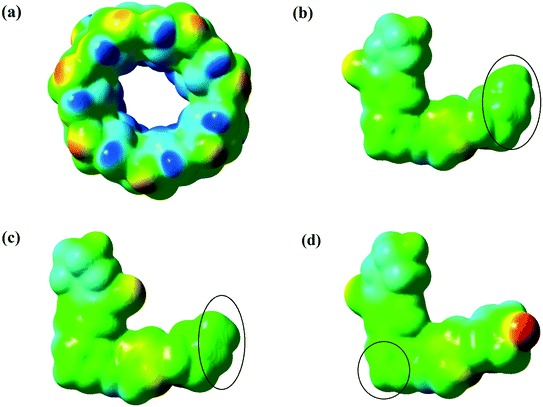
The ability of a drug molecule to bind into β-CD in aqueous solution is expected to be related to its binding free energy (ΔGbind). Results show that the ΔGbind for drug 1 (∼−72.10 kJ mol−1) is more negative than those for drugs 3 and 5 (∼−62.41 and −49.08 kJ mol−1, respectively). As discussed before, all the drugs are hydrophobic and the same goes for the cavity of β-CD. Thus, all three drugs tend to be loaded inside the cavity. Compared to drugs 3 and 5, drug 1 has an ethyl chain in its structure which makes it more favorable for inclusion into the β-CD cavity. Drug 3 has a methyl group that makes it less polar than drug 5. Finally, the most positive value of ΔGbind is associated with drug 5, which has higher polarity resulting from the oxygen atom in its structure. Another important parameter that affected the loading of drugs is the total interaction energy between drug 5 and β-CD, as seen in Table 4. Thermodynamically, the greatest tendency to bind to β-CD is ascribed to drug 1 and the total interaction energy value between drug 1 and β-CD (∼−145.7 kJ mol−1) is higher than those for drugs 3 and 5 (∼−136.29 and −129.87 kJ mol−1, respectively). Finally, a supplementary discussion based on molecular structure and charge distributions from a quantum point of view is presented to describe the free energy behavior of the simulated systems (section 6 in the ESI†).
4. Conclusion
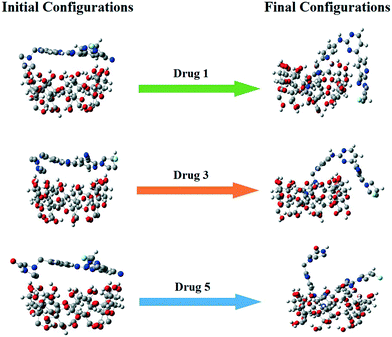
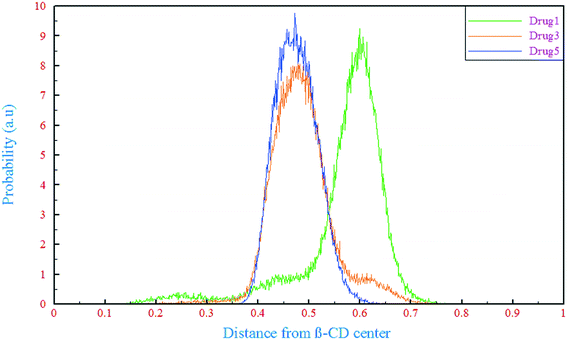
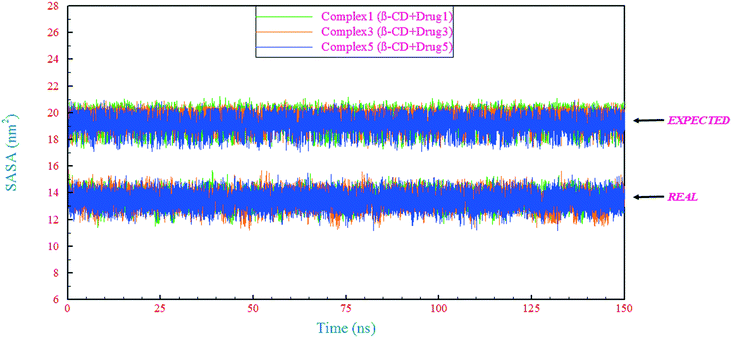
A theoretical study of inclusion complexes of β-cyclodextrin with kinase inhibitors was done. According to the results, the drugs showed different mechanisms of loading into β-cyclodextrin, in which drugs 1 and 3 were loaded from the end of the opposite side of the fluorine, while drug 5 was loaded from the middle of the molecular structure. The outflow of water molecules from the center of the β-CD cavity was proportional to the amount of penetration of each drug. In comparison to those in the drug-only containing systems, the drugs' RMSDs in all of the complex containing systems were reduced and these reductions in mobility of the drugs are related to the formation of H-bonds between the drugs and β-CD, and also between the drugs and water molecules in the β-CD cavity. Considering the RMSDs as well as RMSFs for the β-CD structure in the different simulated systems revealed that the β-CD structure was almost inflexible in interaction with the drugs. Analyzing the RMSF of heavy atoms of the drugs showed that the highest flexibility was ascribed to drug 5, and in all drugs, the nitrogen atom with a triple bond had great flexibility. By calculation of SASA, it was found that the vdW repulsions between water/drug and water/β-CD in the different kinds of systems can cause a reduction in SASA of the complex.Solvation free energy analysis showed that all three drugs were hydrophobic and they need a carrier, with drug 3 (43.05 kJ mol−1) being the most hydrophobic, and drug 5 (20.04 kJ mol−1) having the greatest tendency to dissolve in water. However, due to the presence of an ethyl group at the end of the molecular structure of drug 1 and an oxygen atom at the end of drug 5's molecular structure, drug 1 and drug 5 showed the most negative (−72.10 kJ mol−1) and the least negative (−49.08 kJ mol−1) binding free energy, respectively. These results are supported by the same trend in total interaction energies.
5. Conflicts of interest
There are no conflicts to declare.References
- M. I. Sancho, S. Andujar, R. D. Porasso and R. D. Enriz, Theoretical and experimental study of inclusion complexes of β-cyclodextrins with chalcone and 2′, 4′-dihydroxychalcone, J. Phys. Chem. B, 2016, 120, 3000–3011 CrossRef CAS.
- G. Crini, A history of cyclodextrins, Chem. Rev., 2014, 114, 10940–10975 CrossRef CAS.
- H. Shelley and R. J. Babu, Role of cyclodextrins in nanoparticle-based drug delivery systems, J. Pharm. Sci., 2018, 107, 1741–1753 CrossRef CAS.
- F. Hirayama and K. Uekama, Cyclodextrin-based controlled drug release system, Adv. Drug Delivery Rev., 1999, 36, 125–141 CrossRef CAS.
- A. L. Laza-Knoerr, R. Gref and P. Couvreur, Cyclodextrins for drug delivery, J. Drug Targeting, 2010, 18, 645–656 CrossRef CAS.
- V. J. Stella and R. A. Rajewski, Cyclodextrins: their future in drug formulation and delivery, Pharm. Res., 1997, 14, 556–567 CrossRef CAS.
- G. Tiwari, R. Tiwari and A. K. Rai, Cyclodextrins in delivery systems: Applications, J. Pharm. BioAllied Sci., 2010, 2, 72 CrossRef CAS.
- T. Ishida, I. Miki, T. Tanahashi, S. Yagi, Y. Kondo, J. Inoue, S. Kawauchi, S. Nishiumi, M. Yoshida and H. Maeda, Effect of 18β-glycyrrhetinic acid and hydroxypropyl γcyclodextrin complex on indomethacin-induced small intestinal injury in mice, Eur. J. Pharmacol., 2013, 714, 125–131 CrossRef CAS.
- T. Loftsson, H. H. Sigurđsson, M. Másson and N. Schipper, Preparation of solid drug/cyclodextrin complexes of acidic and basic drugs, Die Pharmazie - An International Journal of Pharmaceutical Sciences, 2004, 59, 25–29 CAS.
- S. Jacob and A. B. Nair, Cyclodextrin complexes: Perspective from drug delivery and formulation, Drug Dev. Res., 2018, 79, 201–217 CrossRef CAS.
- R. Estrada III and G. Vigh, Comparison of charge state distribution in commercially available sulfated cyclodextrins used as chiral resolving agents in capillary electrophoresis, J. Chromatogr. A, 2012, 1226, 24–30 CrossRef.
- K. J. Naidoo, J. Y.-J. Chen, J. L. M. Jansson, G. Widmalm and A. Maliniak, Molecular properties related to the anomalous solubility of β-cyclodextrin, J. Phys. Chem. B, 2004, 108, 4236–4238 CrossRef CAS.
- M. R. Caira, S. A. Bourne, H. Samsodien and V. J. Smith, Inclusion complexes of 2-methoxyestradiol with dimethylated and permethylated β-cyclodextrins: models for cyclodextrin–steroid interaction, Beilstein J. Org. Chem., 2015, 11, 2616–2630 CrossRef CAS.
- A. Semalty, Y. S. Tanwar and M. Semalty, Preparation and characterization of cyclodextrin inclusion complex of naringenin and critical comparison with phospholipid complexation for improving solubility and dissolution, J. Therm. Anal. Calorim., 2014, 115, 2471–2478 CrossRef CAS.
- S. K. Upadhyay and S. M. Ali, Solution structure of loperamide and β-cyclodextrin inclusion complexes using NMR spectroscopy, J. Chem. Sci., 2009, 121, 521–527 CrossRef CAS.
- W. Sangpheak, W. Khuntawee, P. Wolschann, P. Pongsawasdi and T. Rungrotmongkol, Enhanced stability of a naringenin/2, 6-dimethyl β-cyclodextrin inclusion complex: Molecular dynamics and free energy calculations based on MM-and QM-PBSA/GBSA, J. Mol. Graphics Modell., 2014, 50, 10–15 CrossRef CAS.
- B. Nutho, W. Khuntawee, C. Rungnim, P. Pongsawasdi, P. Wolschann, A. Karpfen, N. Kungwan and T. Rungrotmongkol, Binding mode and free energy prediction of fisetin/β-cyclodextrin inclusion complexes, Beilstein J. Org. Chem., 2014, 10, 2789–2799 CrossRef.
- C. Rungnim, S. Phunpee, M. Kunaseth, S. Namuangruk, K. Rungsardthong, T. Rungrotmongkol and U. Ruktanonchai, Co-solvation effect on the binding mode of the α-mangostin/β-cyclodextrin inclusion complex, Beilstein J. Org. Chem., 2015, 11, 2306–2317 CrossRef CAS.
- W. W. Feng and M. Kurokawa, Lipid metabolic reprogramming as an emerging mechanism of resistance to kinase inhibitors in breast cancer, Cancer Drug Resist., 2019, 1–17 Search PubMed.
- P. Wu, T. E. Nielsen and M. H. Clausen, Small-molecule kinase inhibitors: an analysis of FDA-approved drugs, Drug Discovery Today, 2016, 21, 5–10 CrossRef CAS.
- M. J. Bloom, S. D. Saksena, G. P. Swain, M. S. Behar, T. E. Yankeelov and A. G. Sorace, The effects of IKK-beta inhibition on early NF-kappa-B activation and transcription of downstream genes, Cell. Signalling, 2019, 55, 17–25 CrossRef CAS.
- K.-J. Han, X. Su, L.-G. Xu, L.-H. Bin, J. Zhang and H.-B. Shu, Mechanisms of the TRIF-induced interferon-stimulated response element and NF-κB activation and apoptosis pathways, J. Biol. Chem., 2004, 279, 15652–15661 CrossRef CAS.
- S. Ning, J. S. Pagano and G. N. Barber, IRF7: activation, regulation, modification and function, Genes Immun., 2011, 12, 399–414 CrossRef CAS.
- F. M. Ferguson and N. S. Gray, Kinase inhibitors: the road ahead, Nat. Rev. Drug Discovery, 2018, 17, 353 CrossRef CAS.
- R. B. Kargbo, Kinase Inhibitors for Treatment of Cancer and Inflammation, 2018 Search PubMed.
- M. Fermeglia, M. Ferrone, A. Lodi and S. Pricl, Host–guest inclusion complexes between anticancer drugs and β-cyclodextrin: computational studies, Carbohydr. Polym., 2003, 53, 15–44 CrossRef CAS.
- K. Azizi and M. Ganjali Koli, Molecular dynamics simulations of Oxprenolol and Propranolol in a DPPC lipid bilayer, J. Mol. Graphics Modell., 2016, 64, 153–164 CrossRef CAS.
- M. Ganjali Koli and K. Azizi, The partition and transport behavior of cytotoxic ionic liquids (ILs) through the DPPC bilayer: insights from molecular dynamics simulation, Mol. Membr. Biol., 2017, 33, 64–75, DOI:10.1080/09687688.2017.1384859.
- M. G. Koli and K. Azizi, Investigation of benzodiazepines (BZDs) in a DPPC lipid bilayer: Insights from molecular dynamics simulation and DFT calculations, J. Mol. Graphics Modell., 2019, 90, 171–179 CrossRef.
- H. Aghazadeh, M. Ganjali Koli, R. Ranjbar and K. Pooshang Bagheri, Interactions of GF-17 derived from LL-37 antimicrobial peptide with bacterial membranes: a molecular dynamics simulation study, J. Comput.-Aided Mol. Des., 2020, 34, 1261–1273 CrossRef CAS.
- M. J. Abraham, T. Murtola, R. Schulz, S. Páll, J. C. Smith, B. Hess and E. Lindahl, GROMACS: High performance molecular simulations through multi-level parallelism from laptops to supercomputers, SoftwareX, 2015, 1, 19–25 CrossRef.
- A. K. Malde, L. Zuo, M. Breeze, M. Stroet, D. Poger, P. C. Nair, C. Oostenbrink and A. E. Mark, An automated force field topology builder (ATB) and repository: version 1.0, J. Chem. Theory Comput., 2011, 7, 4026–4037 CrossRef CAS.
- M. Stroet, B. Caron, K. M. Visscher, D. P. Geerke, A. K. Malde and A. E. Mark, Automated topology builder version 3.0: prediction of solvation free enthalpies in water and hexane, J. Chem. Theory Comput., 2018, 14, 5834–5845 CrossRef CAS.
- H. J. C. Berendsen, J. R. Grigera and T. P. Straatsma, The missing term in effective pair potentials, J. Phys. Chem., 1987, 91, 6269–6271 CrossRef CAS.
- J. Snyman, Practical mathematical optimization: an introduction to basic optimization theory and classical and new gradient-based algorithms, Springer Science & Business Media, 2005 Search PubMed.
- B. Hess, H. Bekker, H. J. C. Berendsen and J. G. E. M. Fraaije, LINCS: a linear constraint solver for molecular simulations, J. Comput. Chem., 1997, 18, 1463–1472 CrossRef CAS.
- A. Baumketner, Removing systematic errors in interionic potentials of mean force computed in molecular simulations using reaction-field-based electrostatics, J. Chem. Phys., 2009, 130, 104106 CrossRef.
- G. Bussi, D. Donadio and M. Parrinello, Canonical sampling through velocity rescaling, J. Chem. Phys., 2007, 126, 14101 CrossRef.
- M. Parrinello and A. Rahman, Crystal structure and pair potentials: A molecular-dynamics study, Phys. Rev. Lett., 1980, 45, 1196 CrossRef CAS.
- R. W. Hockney, S. P. Goel and J. W. Eastwood, Quiet high-resolution computer models of a plasma, J. Comput. Phys., 1974, 14, 148–158 CrossRef.
- T. Darden, D. York and L. Pedersen, Particle mesh Ewald: An N· log (N) method for Ewald sums in large systems, J. Chem. Phys., 1993, 98, 10089–10092 CrossRef CAS.
- C. H. Bennett, Efficient estimation of free energy differences from Monte Carlo data, J. Comput. Phys., 1976, 22, 245–268 CrossRef.
- D. L. Mobley, J. D. Chodera and K. A. Dill, On the use of orientational restraints and symmetry corrections in alchemical free energy calculations, J. Chem. Phys., 2006, 125, 84902 CrossRef.
- A. Rizzi, T. Jensen, D. R. Slochower, M. Aldeghi, V. Gapsys, D. Ntekoumes, S. Bosisio, M. Papadourakis, N. M. Henriksen and B. L. De Groot, The SAMPL6 SAMPLing challenge: Assessing the reliability and efficiency of binding free energy calculations, J. Comput.-Aided Mol. Des., 2020, 1–33 Search PubMed.
- P. Hohenberg and W. Kohn, Inhomogeneous electron gas, Phys. Rev., 1964, 136, B864 CrossRef.
- B. Miehlich, A. Savin, H. Stoll and H. Preuss, Results obtained with the correlation energy density functionals of Becke and Lee, Yang and Parr, Chem. Phys. Lett., 1989, 157, 200–206 CrossRef CAS.
- R. G. Parr and W. Yang, Density-Functional Theory of Atoms and Molecules, Oxford Univ Press, New York, 1989 Search PubMed.
- M. Cossi, V. Barone, B. Mennucci and J. Tomasi, Ab initio study of ionic solutions by a polarizable continuum dielectric model, Chem. Phys. Lett., 1998, 286, 253–260 CrossRef CAS.
- M. Cossi, N. Rega, G. Scalmani and V. Barone, Energies, structures, and electronic properties of molecules in solution with the C-PCM solvation model, J. Comput. Chem., 2003, 24, 669–681 CrossRef CAS.
- T. Lu, Multiwfn. Version 3.2.1, A multifunctional wavefunction analyzer, 2013, (n.d.) Search PubMed.
- T. Lu and F. Chen, Multiwfn: a multifunctional wavefunction analyzer, J. Comput. Chem., 2012, 33, 580–592 CrossRef CAS.
- M. J. Frisch and A. B. Nielsen, Gaussian 03 Programmer's Reference, Gaussian, 2003 Search PubMed.
- A. C. F. Ribeiro, D. G. Leaist, M. A. Esteso, V. M. M. Lobo, A. J. M. Valente, C. I. A. V. Santos, A. M. Cabral and F. J. B. Veiga, Binary mutual diffusion coefficients of aqueous solutions of β-cyclodextrin at temperatures from 298.15 to 312.15 K, J. Chem. Eng. Data, 2006, 51, 1368–1371 CrossRef CAS.
- W. Khuntawee, P. Wolschann, T. Rungrotmongkol, J. Wong-Ekkabut and S. Hannongbua, Molecular dynamics simulations of the interaction of beta cyclodextrin with a lipid bilayer, J. Chem. Inf. Model., 2015, 55, 1894–1902 CrossRef CAS.
- C. Cézard, X. Trivelli, F. Aubry, F. Djedaïni-Pilard and F.-Y. Dupradeau, Molecular dynamics studies of native and substituted cyclodextrins in different media: 1. Charge derivation and force field performances, Phys. Chem. Chem. Phys., 2011, 13, 15103–15121 RSC.
- J. E. H. Koehler, W. Saenger and W. F. Van Gunsteren, Molecular dynamics simulation of crystalline β-cyclodextrin dodecahydrate at 293 K and 120 K, Eur. Biophys. J., 1987, 15, 211–224 CrossRef CAS.
- T. Ooi, M. Oobatake, G. Nemethy and H. A. Scheraga, Accessible surface areas as a measure of the thermodynamic parameters of hydration of peptides, Proc. Natl. Acad. Sci. U. S. A., 1987, 84, 3086–3090 CrossRef CAS.
- D. van der Spoel, P. J. van Maaren, P. Larsson and N. Timneanu, Thermodynamics of hydrogen bonding in hydrophilic and hydrophobic media, J. Phys. Chem. B, 2006, 110, 4393–4398 CrossRef CAS.
- G. Crini, S. Fourmentinn and E. Lichtfouse, Cyclodextrin Fundamentals, Reactivity and Analysis, 2018, p. 262, DOI:10.1007/978-3-319-76159-6.
- E. Mixcoha, J. Campos-Terán and A. Piñeiro, Surface adsorption and bulk aggregation of cyclodextrins by computational molecular dynamics simulations as a function of temperature: α-CD vs β-CD, J. Phys. Chem. B, 2014, 118, 6999–7011 CrossRef CAS.
- E. Khan, A. Shukla, A. Srivastava and P. Tandon, Molecular structure, spectral analysis and hydrogen bonding analysis of ampicillin trihydrate: a combined DFT and AIM approach, New J. Chem., 2015, 39, 9800–9812 RSC.
- S. Shahab, M. Sheikhi, L. Filippovich, R. Alnajjar, Z. Ihnatovich, K. Laznev, A. Strogova, M. Atroshko and M. Drachilovskaya, Quantum-chemical modeling, spectroscopic (FT-IR, excited states, UV/Vis, polarization, and Dichroism) studies of two new benzo [d] oxazole derivatives, J. Mol. Struct., 2020, 1202, 127352 CrossRef CAS.
- D. A. Smith, K. Beaumont, T. S. Maurer and L. Di, Volume of distribution in drug design: Miniperspective, J. Med. Chem., 2015, 58, 5691–5698 CrossRef CAS.
- J. E. Hall, Guyton and Hall textbook of medical physiology e-Book, Elsevier Health Sciences, 2015 Search PubMed.
- R. G. Pearson, Absolute electronegativity and hardness correlated with molecular orbital theory, Proc. Natl. Acad. Sci. U. S. A., 1986, 83, 8440–8441 CrossRef CAS.
- S. Kirshblum and V. W. Lin, Spinal cord medicine, Springer Publishing Company, 2018 Search PubMed.
Footnote |
| † Electronic supplementary information (ESI) available. See DOI: 10.1039/d0me00140f |
| This journal is © The Royal Society of Chemistry 2021 |

