 Open Access Article
The development of a magnetic iron/nitrogen-doped graphitized carbon composite with boosted microwave attenuation ability as the wideband microwave absorber†
Cong
Chen
 *ab,
Wen
Chen
a,
Bing
Zong
ab,
Xiaohai
Ding
ab and
Haitao
Dong
ab
aSchool of Physics and Electronic Information Engineering, Qinghai Nationalities University, Xining 810007, PR China. E-mail: 2016016@qhmu.edu.cn
bAsia Silicon (Qinghai) Co., Ltd, Xining, Qinghai 810007, China
First published on 11th March 2021
Abstract
Magnetic carbon-based composites have been attractive candidates for electromagnetic (EM) absorption due to their dual magnetic and dielectric loss ability. In this study, a novel magnetic carbon consisting of N-doped graphitized carbon and magnetic Fe nanoparticles was produced. First, the graphitized carbon doped with N has been demonstrated to be an efficient way to strengthen the conductivity loss ability. Based on the N-doped graphitized carbon (NGC), the magnetic Fe nanoparticles were further decorated on the NGC, which was not only favored the dielectric loss ability but also introduced the magnetic loss ability. The electromagnetic absorbing properties of the NGC–Fe nanoparticles were evaluated in the frequency range of 2–18 GHz, and as expected, the sample exhibited the excellent wideband EM absorbing ability, with an effective absorption region of 5.2 GHz under a thickness of 1.2 mm. Ulilization of element doping method consisted to modify magnetic carbon material can be a candidate for producing wideband EM absorbers but showing thin thickness.
1. Introduction
Recently, the rapid development of electronic technology allows human beings to have a fast and convenient lifestyle. However, the harmful effect, mainly resulting from electromagnetic (EM) radiation is ever-increasing.1–3 Now, the EM radiation pollution has been regarded as the fourth pollution, following air, noise, and water pollution.4–6 This serious EM issue has forced researchers to develop EM materials that can dissipate the EM waves thermally by their magnetic or dielectric loss capability.7–10 To be a high performing EM absorbing material, the absorption intensity, termed as reflection loss value (RL), needs to be as low as possible.11,12 In general, an RL value of −10 dB has been the qualified value, corresponding to 90% of the absorption coefficient.13–15 The frequency band with RL < −10 dB is a crucial factor to estimate the EM absorption performance.16,17 To meet the requirements of practical application, the thickness of EM absorbers should be as thin as possible.18–20 Based on the above-mentioned demands, these selected EM absorbers are better off to possess a lightweight feature.21,22 Concerning this feature, the carbon material, particularly graphitized carbon, has been regarded as a promising candidate material, which is not only due to the ultralight density but also due to the high chemical stability, ease of production, etc.23–25 At the initial stage, direct investigation of the graphitized carbon material has received extreme interest. For example, Zhang et al. reported a mesoporous hollow shaped graphitized carbon, and the results indicated that the unique structure would increase the performance a lot.26 Specifically, a minimum reflection loss value of −39.4 dB was achieved under a thickness of 3.6 mm. Sun et al. reported a graphitized carbon derived from carbonized waxberry, with an RLmin value of ∼−15 dB under a thickness of ∼3.0 mm.27 Yang et al. produced a pore-controllable hollow carbon, which showed an RLmin value of ∼−9.0 dB, under a thickness of 3.5 mm.28 These cases also tried to improve the EM absorption performance via structural design. However, a wideband EM absorption was obtained under a relatively thick thickness. According to Yin's explanation, the loss mechanism of graphitized carbon has mainly resulted from the dielectric loss.29 As two main parts of dielectric loss, both polarization relaxation and conductive loss ability are not enough to produce a wideband EM absorption under a thin thickness, simultaneously.30–32To strengthen the loss ability, the most efficient method is to decorate the graphitized material with a magnetic material to reach the dual magnetic and dielectric loss ability. For example, Lu et al. synthesized a NiCo/C absorber by an in situ pyrolysis method, with an effective absorption region of 4.5 GHz under a thickness of 1.5 mm.33 Other similar magnetic decorated C, such as Fe/C and FeCo/C, have been prepared, and all exhibited a wideband EM absorption ability under a thickness of <2.0 mm.34,35 It is observed that a broad EM absorption is easier to obtain under a thin thickness. Nevertheless, excessive amount of magnetic components still would increase the density. If the content of the magnetic faction is reduced, the performance will increase significantly.
To maintain a strong EM loss ability but with a moderate amount of magnetic material, herein, an element doing method has been utilized. First, the graphitized carbon was doped with an N element, which has been demonstrated to increase the dielectric loss ability. Afterwards, the N-doped graphitized carbon was decorated with a moderate amount of magnetic Fe, which is used for the purpose of enhancing the magnetic loss ability. Due to the synergistic effect of dual loss ability, the as-prepared N-doped carbon/Fe sample exhibited a broad EM absorption ability under a thickness of <2.0 mm.
2. Experiment section
2.1. Synthesis of N doped carbon
The N doped graphitized carbon (GC) was prepared by a solvothermal method. In a typical synthesis of N-doped graphitized carbon (NGC), 0.3 g of resorcinol was added into a solution containing 10 mL of H2O, 30 mL ethanol and 1.5 mL aqueous ammonia solution (NH3·H2O). After stirring for 20 min, 0.25 mL of formaldehyde and 100 mg of (NH4)2CO3 were co-added into the above solution mixture and stirred for another 10 min. Next, the solution was transferred into a Teflon-lined stainless steel autoclave and heated at 160 °C for 8 h. After cooling down, the resultant precipitation was washed with ethanol 3–5 times. The GC was made by a similar procedure, without adding (NH4)2CO3 and ammonia aqueous solution.2.2. Synthesis of the N-doped carbon/Fe sample
Typically, 100 mg of the above precipitate was added into a flask with 75 mL glycol, followed by ultrasonication for 30 min. Then, 100 mg of Fe(acac)3 was added to the mixture and dissolved with stirring for 20 min. Next, this mixture solution was transferred to a Teflon-lined stainless-steel autoclave and heated at 200 °C for 12 h. When the temperature cooled to room temperature, the precipitation was obtained by centrifugation and washed with alcohol and distilled water. The as-prepared precipitate was carbonized at 800 °C, under an N2 atmosphere for 6 h at a heating rate of 2.0 °C min−1. Finally, the N-doped graphitized carbon/Fe was obtained. For comparison, the graphitized carbon without N doping was prepared.2.3. Characterization
The morphology structure and elemental composition of these carbon materials were characterized by a field-emission scanning electron microscope (FE-SEM, FEI, 200S). The phase composition and covalent/chemical bonds of NGC–Fe were recorded via an X-ray photoelectron spectroscopy (XPS, PHI 5000 VersaProbe systems), X-ray diffractometer (Bruker D8 ADVANCE X-ray diffractometer) and Raman spectrometer (Jobin Yvon HR 800 confocal Raman system), respectively. An Agilent E5071C was used to determine the relative permittivity and permittivity in the frequency region of 2–18 GHz. A sample containing 50 wt% of the as-prepared was pressed into a ring with an outer diameter of 7.0 mm and an inner diameter of 3.04 mm.3. Results and discussion
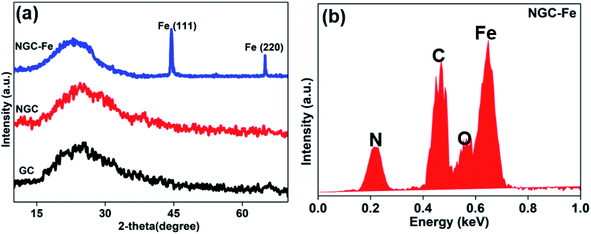
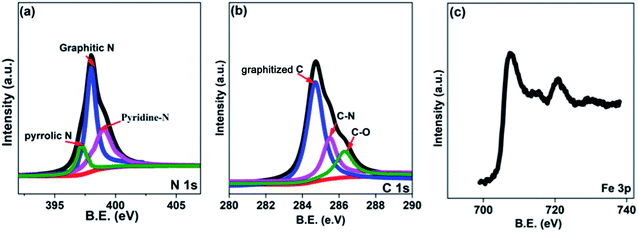
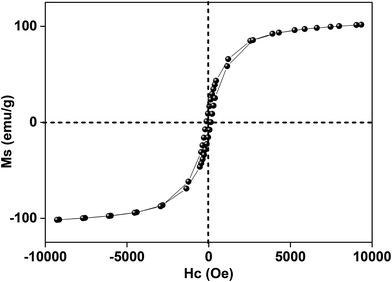
In this research, the N-doped graphitized carbon/Fe sample (NGC–Fe) was synthesized via a three-step method. First, the N-doped graphitized carbon precursor was prepared by a general in situ polymerization process.36 Second, an organic-liquid reaction was employed to form the N-doped carbon sphere/Fe-precursor sample. Lastly, the as-prepared N-doped carbon sphere/Fe-precursor was carbonized at a high temperature (800 °C) under N2 flow. During the carbonized procedure, the N-doped carbon precursor was converted to graphitized carbon. Simultaneously, the exhibited Fe-precursor was undergoing pyrolysis and was simultaneously reduced by the graphitized carbon. For complete reduction, the carbonized time was set as 6 h. As a result, metallic Fe nanoparticles were formed and loaded on the surface of the graphitized carbon. For comparison, the graphitized carbon (GC) and N-doped GC were simultaneously prepared. Fig. 1a shows the XRD patterns of these samples. Clearly, both GC and NGC have an approximate diffraction peak at 2θ = 22.4°, which are assigned to the (002) crystal plane of carbon. The typical characteristic peaks are located at 44.4 and 65.1° for NGC–Fe, which correspond to the (111) and (200) crystal planes of α-Fe (JCPDS-06-0696). Besides, the diffraction peaks of iron oxide were not found here, revealing the high purity of the sample. The types of elements were further detected by the EDS map. As observed in Fig. 1b, N, O, C and Fe elements co-existed in the NGC–Fe sample, and this result matched well with mappings (Fig. S1†). The doped amount of N was nearly 11.2 wt%. Moreover, the amount of Fe was closer to 45.6 wt%.The bonding state of NGC–Fe was further characterized by X-ray photoelectron energy spectra (XPS). As shown in Fig. 2a, N 1s spectra had three distinct peaks at 397.2, 398 and 389.8 eV, which are attributed to pyrrolic N, graphitic N and pyridine N, respectively.37 However, for C 1s, it had three types of chemical bonds, namely graphitized C, C–N and C–O bonds with the binding energies of 284.6, 285.5 and 286.3 eV, respectively, as plotted in Fig. 2b.38 In Fig. 2c, the measured binding energies of 707.7 and 716.2 eV were observed for Fe, which are attributed to the Fe (metallic Fe) 1/2 and 3/2 p, respectively.39 Based on the results of XPS, it was found that the N element was successfully doped into the carbon. Moreover, the as-obtained Fe refers to the metallic Fe and without other Fe oxides. These results matched well with the XRD results. The ferromagnetic hysteresis loops at room temperature of NGC–Fe are provided in Fig. 3. The saturation magnetization (Ms) of the sample was about 101.3 emu g−1, which is clearly higher than that of the current ferrites (∼70–90 emu g−1), such as ZnFe2O4, CoFe2O4, and Fe3O4.40 In general, a larger Ms value would make contribution to the permeability value, as expressed by the following equations:41,42
| μ′ = 1 + (M/H)cosσ | (1) |
| μ′′ = (M/H)sinσ | (2) |
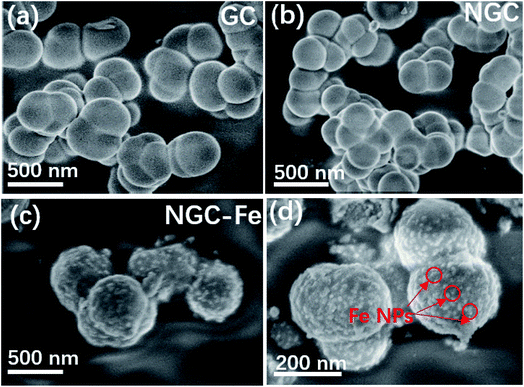
The morphology and structural information of these samples were observed by a field-emission scanning electron microscope (FE-SEM). The as-synthesized GC possessed a nanospherical structure with an average diameter of ∼210 nm. These GCs displayed poor dispersive and linked with each other, as shown in Fig. 4a. N-doped GCs have similar structure as compared to GC. The size was also the same and does not have distinct changes (Fig. 4b). The typically FE-SEM images of NGC–Fe are presented in Fig. 4c and d, which shows the nanospherical structure. Nevertheless, it is clearly seen that the surface of GNC–Fe turned rough, which was due to the exhibited Fe nanoparticles (NPs). Overall, the sizes and structures can be maintained and are the same as GCs and NGC (Fig. 5).
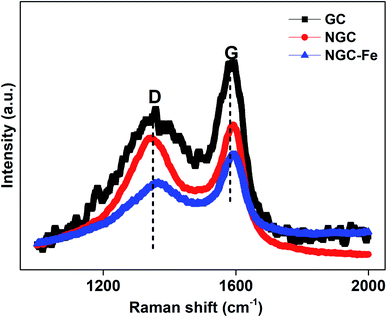
To have insight into the carbon component, these samples were further detected by the Raman spectra. It was found that all of these samples have two distinguishable peaks. The two peaks at 1350 and 1590 cm−1 can be assigned to the D-band from defects and the G-band from the graphited carbon.43–45 Usually, the ratio of D and G bands stands for the graphitization level. Herein, the D/G ratios of GC, NGC, NS–SCS and NGC–Fe were estimated to 0.86, 0.93 and 0.90, respectively. When compared to GC, NGC has a higher ID/IG ratio, which is attributed to the reduced graphitized carbon atoms.46,47 However, for NGC–Fe, the ratio reduced significantly, which may be due to the Fe-catalytic behavior.48 Regarding the Fe-catalytic behavior, more non-graphitized carbon could be turned to sp2 of carbon and resulted in the enhancement of the graphitized level. To the best of our knowledge, the graphitized level is highly associated with the permittivity value, which indirectly influenced the microwave absorption intensity.49
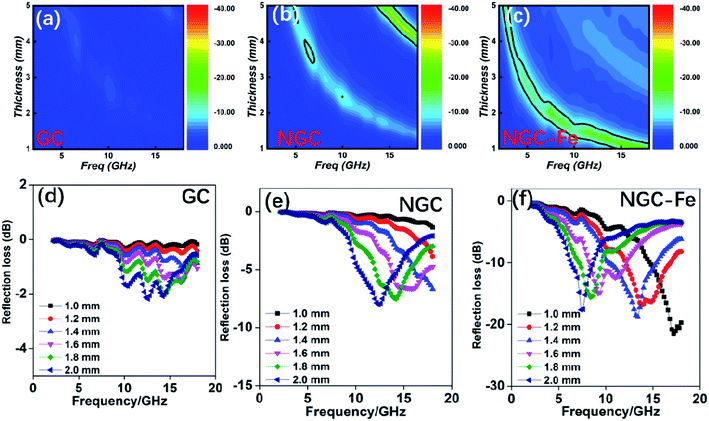
In order to investigate the microwave absorption ability, the reflection loss value was calculated according to the transmission-line rule:50–53
| Zin = Zo(μr/εr)1/2tanh[j(2πfd(μrεr)1/2/c)] | (3) |
| RL (dB) = 20log|(Zin − Zo)/(Zin + Zo)| | (4) |
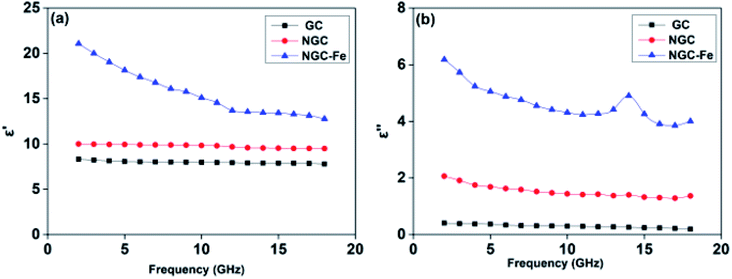
To reveal the contribution of N and magnetic Fe on the performance, the electromagnetic parameters of these samples were analyzed. First, the frequency dependence of permittivity values, which included real and imaginary parts (ε′, ε′′), is plotted in Fig. 7. In general, ε′ is the storage of the electrical field ability, while dissipated ability is represented by ε′′.54 In Fig. 6a, the ε′ value of NGC is about 10–9.5, which is higher than that of GC (8.1–7.6) but much lower than that of NGC–Fe (21–12.7). Similarly, GC has the lowest ε′′ value (0.34–0.20), suggesting the poor dielectric loss ability. The ε′′ value of NGC was higher than that of GC, which may due to the improved dielectric loss ability. The enhanced ε′′ value resulted from the enhanced conductivity and ultimately resulted in the boosted dielectric loss ability.55 In this case, it can be deduced that the GC doped by N promotes the conductivity, which may due to the increased carriers and mobility of electrons. These results were consistent with recent findings. For NGC–Fe, its ε′′ value further increased up to ∼3 times, which is not only due to N doping but also due to the presence of metallic Fe. In this case, it can be concluded that NGC–Fe has the strongest conductive loss ability. Besides, a dielectric resonance peak was observed at ∼14.0 GHz. Such a dielectric resonance peak would originate from the interfacial polarization behavior between NGC and Fe nanoparticles. In general, the polarization effect can be seen by the Cole–Cole semicircle. It is known that the relative complex permittivity can be described by the following equations:56–60
 | (5) |
Here, the εs, ε∞, and τ stand for static permittivity, relative dielectric permittivity at a high-frequency limit, and polarization relaxation time, respectively. In this case, ε′ and ε′′ can be calculated according to the following equations:61,62
 | (6) |
 | (7) |
Based on the eqn (6) and (7), ε′–ε′′ can be expressed as above:63–65
 | (8) |
If the plot of ε′–ε′′ is a semicircle, it is generally called the Cole–Cole semicircle. Each Cole–Cole semicircle means one Debye relaxation process, which is caused by the polarization effect. It can be seen in Fig. 8 that only NGC–Fe appears in one Cole–Cole semicircle, which indicates the existent of the polarization effect.
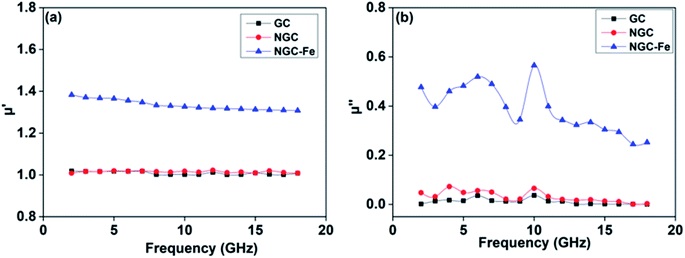
In addition to dielectric loss, the excellent EM absorbing performance of NGC–Fe is also attributed to the improved permeability value. Fig. 9a plots the real part of the permeability value (μ′) as a function of frequency. Clearly, the μ′ values of GC and NGC are about 1.0 owing to the nonmagnetic feature.61 The μ′ of NGC–Fe is about 1.4–1.3 owing to the exhibited magnetic Fe. The magnetic loss value (μ′′) is shown in Fig. 9b. We observed that μ′′ of NGC and GC was closer to 0. The μ′′ of NGC–Fe was greater than 0.3, suggesting the magnetic loss ability. From the analysis of permittivity and permeability, the best EM absorbing ability of the NGC–Fe sample is attributed to three factors:
(1) The doped N element increases the conductive loss ability.
(2) After decorating with metallic Fe, the dielectric loss ability was furthered increased, which was due to the boosted conductive loss and interfacial polarization.
(3) Concerning the magnetic loss, the exhibited Fe also contributes to the magnetic loss.
In this case, the superior EM absorbing performance of NGC–Fe can be fully understood.
4. Conclusions
To summarize, an N-doped graphitized/Fe absorber was developed by a simple hydrothermal route and was used to deal with EM pollution. The graphitized carbon doped by the N element showed boosted dielectric loss ability. Based on NGC, magnetic Fe nanoparticles have been used to further modify and induce magnetic loss. The results revealed that after decorating with magnetic Fe, the dielectric loss ability can be further strengthened and exhibited improved conductivity loss ability and interfacial polarization behavior. Meanwhile, the magnetic Fe nanoparticles can induce magnetic loss ability. Owing to the dual magnetic and dielectric loss ability, the sample shows the largest effective absorption region of 5.2 GHz under a thickness of 1.2 mm only. Employing the synergistic strategy is an attractive method for developing high-performance carbon-based EM absorbing materials.Conflicts of interest
There are no conflicts to declare.Acknowledgements
The authors are grateful for the financial aids from the Natural Science Foundation of Qinghai Nationalities University (No. 2019XJZ07). At the same time, the authors would like to thank the Key Laboratory of Silicon Materials of Qinghai Province for providing financial support for this experiment.References
- T. Q. Hou, Z. R. Jia, A. L. Feng, Z. H. Zhou and X. H. Liu, J. Mater. Sci. Technol., 2021, 68, 61–69 CrossRef.
- H. Lv, Z. Yang, S. J. H. Ong, C. Wei, H. B. Liao, S. B. Xi, Y. Du, G. B. Ji and Z. C. J. Xu, Adv. Funct. Mater., 2019, 29, 1900163 Search PubMed.
- Z. G. Gao, Z. R. Jia, K. K. Wang, X. H. Liu, L. Bi and G. Wu, Chem. Eng. J., 2020, 402, 125951 CrossRef.
- J. Qiao, X. Zhang, D. M. Xu, L. X. Kong, L. F. Lv, F. Yang, F. L. Wang, W. Liu and J. R. Liu, Chem. Eng. J., 2020, 380, 122591 CrossRef.
- G. Wu, Z. R. Jia, X. F. Zhou and G. Z. Nie, Composites, Part A, 2020, 128, 105687 CrossRef.
- H. Lv, Z. Yang, B. Liu, G. Wu, Z. Lou, B. Fei and R. Wu, Nat. Commun., 2021, 12, 834 CrossRef PubMed.
- Z. Lou, Q. Wang, Y. Zhang, X. Zhou, R. Li and Y. Li, Composites, Part B, 2021, 214, 108744 CrossRef CAS.
- L. Yang, T. Deng, Z. Jia and X. Zhou, J. Mater. Sci. Technol., 2021, 83, 239–247 CrossRef.
- R. L. Wang, M. He, Y. M. Zhou, S. X. Nie, Y. J. Wang, W. Q. Liu, Q. He, W. T. Wu, X. H. Bu and X. M. Yang, Carbon, 2020, 156, 378–388 CrossRef CAS.
- L. J. Yang, X. D. Zhou, Z. Jia and Y. T. Zhu, Carbon, 2020, 167, 843–851 CrossRef CAS.
- Y. Q. Wang, H. G. Wang, J. H. Ye, L. Y. Shi and X. Feng, Chem. Eng. J., 2020, 383, 123096 CrossRef.
- P. Miao, R. Zhou, K. J. Chen, J. Liang, Q. F. Ban and J. Kong, Adv. Mater. Interfaces, 2020, 7, 1901820 CrossRef.
- X. Liang and Y. Cheng, RSC Adv., 2015, 33, 25936 Search PubMed.
- B. Zhao, S. P. Zeng, X. P. Li, X. Q. Guo, B. B. Fan and R. Zhang, J. Mater. Chem. C, 2020, 8, 500–509 RSC.
- Z. R. Jia, K. C. Kou, S. Yin, A. Feng, C. H. Zhang, X. H. Liu, H. J. Cao and G. L. Wu, Composites, Part B, 2020, 189, 107895 CrossRef.
- Y. L. Yu, M. Wang, Y. Q. Bai, B. Zhang, L. L. An, J. Y. Zhang and B. Zhang, Chem. Eng. J., 2019, 375, 121914 CrossRef.
- Z. C. Lou, R. Li, Q. Y. Wang, Y. Zhang and Y. J. Li, J. Alloys Compd., 2021, 854, 157286 CrossRef.
- X. Zhou, B. Wang, Z. Jia, X. Zhang, X. Liu, K. Wang, B. Xu and G. Wu, J. Colloid Interface Sci., 2021, 582, 515–525 CrossRef.
- H. L. Lv, Z. Yang, H. B. Xu, L. Y. Wang and R. B. Wu, Adv. Funct. Mater., 2020, 30, 1907251 CrossRef.
- X. Liang, H. Zhang and Y. Du, ACS Appl. Mater. Interfaces, 2015, 18, 9776–9783 Search PubMed.
- Y. Yang, M. Li, Y. Zhang, J. C. Liu and Z. H. Yang, Chem. Eng. J., 2020, 392, 123666 CrossRef.
- Y. H. Guo, G. Wu, G. Ji, Y. Zhao and Z. C. J. Xu, ACS Appl. Mater. Interfaces, 2017, 9, 5660–5668 CrossRef.
- T. Q. Hou, Z. Jia, S. Q. He, Y. Su, X. D. Zhang, B. H. Xu, X. H. Liu and G. L. Wu, J. Colloid Interface Sci., 2021, 583, 321–330 CrossRef.
- M. Kong, Z. R. Jia, B. Wang, J. L. Dou, X. H. Li, Y. H. Dong and B. B. Xu, Sustainable Mater. Technol., 2020, 26, e00219 CrossRef.
- X. Liang, Y. Cheng, H. Zhang, D. M. Tang and B. Zhang, ACS Appl. Mater. Interfaces, 2015, 7, 4744 CrossRef.
- H. X. Zhang, B. B. Wang, A. L. Feng, N. Zhang, Z. R. Jia, Z. Y. Huang, X. H. Liu and G. L. Wu, Composites, Part B, 2019, 167, 690–699 CrossRef.
- X. X. Sun, M. L. Yang, S. Yang, S. S. Wang, W. L. Yin, R. C. Che and Y. B. Li, Small, 2019, 15, 1902974 CrossRef.
- L. J. Yang, H. Lv, M. Li, Y. Zhang, J. C. Liu and Z. H. Yang, Chem. Eng. J., 2020, 392, 123666 CrossRef.
- H. L. Xu, X. W. Yin, M. Zhu, M. H. Li, H. Zhang, H. J. Wei, L. T. Zhang and L. F. Cheng, Carbon, 2019, 142, 346–353 CrossRef.
- H.Q. Zhang and B. Zhang, J. Mater. Chem. C, 2016, 4, 5476–5482 RSC.
- X. Li, L. M. Yu, W. K. Zhao, Y. Y. Shi, L. J. Yu, Y. B. Dong, Y. F. Zhi, Y. Q. Fu, X. D. Liu and F. Y. Fu, Chem. Eng. J., 2020, 379, 122393 CrossRef.
- H. Lv, Z. Yang, P. L. Y. Wang, G. Ji, J. Song, L. R. Zheng, H. B. Zeng and Z. C. J. Xu, Adv. Mater., 2018, 30, 1706343 CrossRef.
- J. Xiong, Z. Xiang, J. Zhao, L. Z. Yu, E. B. Cui, B. W. Deng, Z. C. Liu, R. Liu and W. Lu, Carbon, 2019, 154, 391–401 CrossRef CAS.
- T. Hou, B. Wang, Z. Jia, H. J. Wu, D. Lan, Z. Y. Huang, A. Feng, M. L. Ma and G. L. Wu, J. Mater. Sci.: Mater. Electron., 2019, 30, 10961–10984 CrossRef CAS.
- H. Huang, C. G. Chen, Z. J. Li, Y. P. Zhang, H. Zhang, J. G. Lu, S. C. Ruan and Y. J. Zeng, Nanotechnology, 2020, 31, 160021 Search PubMed.
- T. K. Zhao, C. L. Hou, H. Y. Zhang, R. X. Zhu, S. F. She, J. G. Wang, T. H. Li and B. Q. Wei, Sci. Rep., 2015, 4, 5619 CrossRef PubMed.
- (a) S. A. Chernyak, A. S. Ivanov, D. N. Stolbov, T. B. Egorova, K. I. Maslakov, Z. Shen, V. V. Lunin and S. V. Savilov, Appl. Surf. Sci., 2019, 488, 51–60 CrossRef CAS; (b) M. Mirzaeian, Q. Abbas, D. Gibson and M. Mazur, Energy, 2019, 175, 809–819 CrossRef.
- X. P. Li, Z. M. Deng, Y. Li, H. B. Zhang, S. Zhao, Y. Zhang, X. Y. Wu and Z. Z. Yu, Carbon, 2019, 147, 172–181 CrossRef CAS.
- Q. M. Hu, R. L. Yang, Z. C. Mo, D. W. Lu, L. L. Yang, Z. F. He, H. Zhu, Z. K. Tang and X. C. Gui, Carbon, 2019, 153, 737–744 CrossRef CAS.
- X. G. Huang, Y. S. Qin, Y. B. Ma and Y. Y. Chen, Ceram. Int., 2019, 45, 18389–18397 CrossRef CAS.
- M. T. Qiao, X. F. Lei, Y. Ma, L. D. Tian, X. W. He, K. H. Su and Q. Y. Zhang, Carbon, 2018, 11, 1500–1519 CAS.
- X. Jian, X. Y. Xiao, L. J. Deng, X. Wang, N. Mahmood and S. X. Dou, ACS Appl. Mater. Interfaces, 2018, 10, 9369–9378 CrossRef CAS.
- N. Zhang, H. Ying, P. B. Liu, X. Ding, M. Zong and M. Y. Wang, J. Alloys Compd., 2017, 692, 639–646 CrossRef CAS.
- Z. M. Song, X. F. Liu, X. Sun, Y. Li, X. Y. Nie, W. K. Tang, R. H. Yu and J. L. Shui, Carbon, 2019, 151, 36–45 CrossRef CAS.
- Z. C. Lou, R. Li, P. Wang, Y. Zhang, B. Chen, C. X. Huang, C. C. Wang, H. Han and Y. J. Li, Chem. Eng. J., 2020, 391, 123571 CrossRef CAS.
- N. Yang, Z. X. Luo, G. R. Zhu, S. C. Chen, X. L. Wang, G. Wu and Y. Z. Wang, ACS Appl. Mater. Interfaces, 2019, 11, 35987–35998 CrossRef CAS.
- Q. M. Hu, R. L. Yang, Z. C. Mo, D. W. Lu, L. L. Yang, Z. F. Hu, H. Zhu, Z. K. Tang and X. C. Gui, Carbon, 2019, 153, 737–744 CrossRef CAS.
- Y. H. Guo, Z. H. Yang, Y. Cheng, L. Y. P. Wang, B. Zhang, Y. Zhao and Z. C. J. Xu, J. Mater. Chem. C, 2017, 5, 491–512 RSC.
- X. L. Chen, Z. R. Jia, A. L. Feng, B. B. Wang, X. H. Tong, C. H. Zhang and G. L. Wu, J. Colloid Interface Sci., 2019, 553, 465–474 CrossRef CAS.
- M. Tang, J. Y. Zhang, S. Bi, Z. L. Hou, X. H. Shao, K. T. Zhan and M. S. Cao, ACS Appl. Mater. Interfaces, 2019, 11, 33285 CrossRef CAS.
- Z. C. Lou, C. L. Yuan, Y. Zhang, Y. J. Li, J. B. Cai, L. T. Yang, W. K. Wang, H. Han and J. Zou, J. Alloys Compd., 2019, 775, 800–809 CrossRef CAS.
- H. Zhang, J. Zhao and Y. Du, Nano Res., 2016, 9, 1813 CrossRef.
- Y. Li, Z. R. Jia, L. Wang, X. Q. Guo, B. Zhao and R. Zhang, Composites, Part B, 2020, 196, 108122 CrossRef.
- Z. C. Lou, T. Yuan, Q. Wang, X. W. Wu, S. H. Hu, X. M. Liu and Y. J. Li, J. Renewable Mater., 2021, 9, 959 Search PubMed.
- H. Lv, X. Liang, H. Zhang and Y. Du, J. Mater. Chem. C, 2015, 3, 5056–5064 RSC.
- G. L. Wu, H. X. Zhang, X. X. Luo and L. J. Yang, J. Colloid Interface Sci., 2019, 536, 548–555 CrossRef CAS.
- D. J. Wang, J. Y. Zhang, P. He and Z. L. Hou, Ceram. Int., 2019, 45, 23043 CrossRef CAS.
- F. Zhang, W. D. Zhang, W. F. Zhu, B. Cheng, H. Qiu and S. H. Qi, Appl. Surf. Sci., 2019, 463, 182–189 CrossRef CAS.
- W. Liu, H. Zhang and Y. Du, J. Mater. Chem. C, 2015, 39, 10232–10241 Search PubMed.
- H. Lv and H. Zhang, ACS Appl. Mater. Interfaces, 2016, 8, 6529–6538 CrossRef CAS.
- G. Wu, Y. Cheng, Z. Yang, Z. Jia, H. Wu, L. Yang, H. L. Li and P. Guo, Chem. Eng. J., 2018, 333, 519–528 CrossRef CAS.
- Y. Guo, Z. Yang, T. C. Guo, H. Wu, G. Liu, L. Y. Wang and R. Wu, ACS Sustainable Chem. Eng., 2018, 6, 1539 CrossRef.
- W. Y. Bai, F. Chen, H. Luo, Y. Xiong, X. Wang, Y. Z. Cheng and R. Z. Gong, J. Alloys Compd., 2020, 812, 152083 CrossRef.
- Y. Xiong, H. Luo, Y. Nie, F. Chen, W. Y. Dai, X. Wang, Y. Z. Cheng and R. Z. Gong, J. Alloys Compd., 2019, 802, 364 CrossRef CAS.
- F. Chen, H. Luo, Y. Z. Cheng, J. L. Liu, X. Wang and R. Z. Gong, ACS Appl. Nano Mater., 2019, 2, 7266 CrossRef CAS.
Footnote |
| † Electronic supplementary information (ESI) available. See DOI: 10.1039/d0na00548g |
| This journal is © The Royal Society of Chemistry 2021 |

