 Open Access Article
Photoelectrochemical performance of facet-controlled TiO2 nanosheets grown hydrothermally on FTO†
Fahimeh
Shahvardanfard‡
a,
Gihoon
Cha‡
a,
Nikita
Denisov‡
a,
Benedict
Osuagwu
a and
Patrik
Schmuki
 *abc
*abc
aInstitute for Surface Science and Corrosion WW4-LKO, Department of Materials Science and Engineering, University of Erlangen-Nuremberg, Martensstrasse 7, 91058 Erlangen, Germany. E-mail: schmuki@ww.uni-erlangen.de
bChemistry Department, Faculty of Sciences, King Abdulaziz University, 80203 Jeddah, Kingdom of Saudi Arabia
cRegional Centre of Advanced Technologies and Materials, Palacky University Olomouc, 17. listopadu 50A, 772 07 Olomouc, Czech Republic
First published on 21st December 2020
Abstract
Single crystal anatase TiO2 nanosheets (TiO2-NSs) are grown hydrothermally on fluorine-doped tin oxide (FTO). By systematically changing the hydrothermal conditions such as reaction time, initial concentration of Ti precursor, F precursor, and HCl as an additive, a wide variety of TiO2-NSs, with different morphologies and faceting have been synthesized. For the different morphologies and different facet ratios (anatase S001/S001+101), the photoelectrochemical response is characterized and compared. We find that for photoanodes in neutral electrolytes, the magnitude of the photocurrent depends strongly on the growth parameters, that is, peak IPCEs can vary from 11.7% to 61%. For a wide range of parameters, the key parameter deciding on the photocurrent is the effective electrochemically active area of the electrode. Only for very high facet ratios >91%, the photoresponse can be strongly influenced by faceting – for samples with a S001/S001+101 of 91%, IPCE value of ≈84% is obtained. This work defines not only optimized synthesis conditions for a most effective growth of these single crystalline electrode, but also represents fundamental data for further applications of such electrodes.
Introduction
TiO2 in various geometries and polymorphs has over decades attracted strong scientific and technological interest, due to its large variety of functional features.1–6 Among others, its semiconductive nature made the oxide a versatile part of solar cells, photoanodes or photocatalysts. In general, among the different titania polymorphs, it is conceived that anatase is the most reactive compound, due to a favorable energetics relative to the red-ox potential of water.7–10Even more, for various photocatalytic reactions it has been shown that the different facets of anatase play a crucial role for electron and hole transfer. On an anatase single crystal that exposes the major (101) and (001) planes, typically light-generated electrons exit from the (101) plane while holes exit from the (001) plane, if in contact with an aqueous environment – this due to the intrinsic electronic junction established by the different surface energies of the two facets.11,12 Well defined growth of anatase crystallites with a controllable facet ratio was only established convincingly in 2008, when Yang et al. reported synthesis of nanoscale single crystal anatase TiO2-nanosheets (NSs).13 The authors showed that crystallites with dominant (001) facets could be fabricated by using hydrothermal synthesis in solutions containing fluorine ions (F−). Fluoride termination of anatase can decrease the surface energy of the (001) facets to a value lower than that of (101) facets, and thus single crystal anatase TiO2-NSs with a high percentage of (001) facets could be produced.13–16 Meanwhile these sheets have been widely investigated not only in photocatalysis but also for many other applications.17–19
However, in order to use faceted powders (nanosheets) in photoelectrochemical applications, the sheets need to be immobilized on a conductive substrate. Most elegantly this can be achieved by growing faceted nanosheets directly via a hydrothermal process on an FTO-substrate.20,21
Here, we grow these shape-controlled anatase single crystals on FTO under different hydrothermal parameters to attain directly photoelectrodes consisting of a layer of anatase single crystals with a range of individual crystallite morphology and faceting. We then study the photoelectrochemical performance of the different electrodes and evaluate particularly the effect of the electrochemically active surface area and the ratio of facets ratios (S001/S001+101) on the magnitude of the photocurrent.
Experimental section
Preparation of anatase TiO2 nanosheets
FTO substrates (7 Ω m−2, Solaronix) were cleaned by ultrasonication in acetone and ethanol, and then dried with nitrogen. TiO2-NSs were grown through a hydrothermal process directly on the FTO surfaces. For the basic recipe synthesis, 1.5 mL of titanium isopropoxide (Sigma Aldrich) was dropped into an equal volume (30 mL![[thin space (1/6-em)]](https://www.rsc.org/images/entities/char_2009.gif) :
:![[thin space (1/6-em)]](https://www.rsc.org/images/entities/char_2009.gif) 30 mL) of a mixture of HCl (37%, Sigma Aldrich) and DI water in a Teflon-lined stainless steel autoclave with a capacity of 250 mL. After stirring for 15 minutes, 0.5 g ammonium hexafluorotitanate (Sigma Aldrich) was added to the solution and further stirred for 15 minutes. Then, the pre-cleaned FTO was inserted in the solution facing down. The hydrothermal synthesis was conducted at 150 °C for 8–20 hours. Finally, the as-prepared layers were washed with DI water and annealed at 450 °C for 1 hour in air to remove residual fluoride.
30 mL) of a mixture of HCl (37%, Sigma Aldrich) and DI water in a Teflon-lined stainless steel autoclave with a capacity of 250 mL. After stirring for 15 minutes, 0.5 g ammonium hexafluorotitanate (Sigma Aldrich) was added to the solution and further stirred for 15 minutes. Then, the pre-cleaned FTO was inserted in the solution facing down. The hydrothermal synthesis was conducted at 150 °C for 8–20 hours. Finally, the as-prepared layers were washed with DI water and annealed at 450 °C for 1 hour in air to remove residual fluoride.
XPS results for the samples fabricated with the basic recipe and higher concentration of HCl (HCl/DI: 33/27) are shown in Fig. S1.† In general, the data confirm the as grow structures to be terminated by F. The role of HCl is mainly to alter the H+ concentration (see ref. 21).
Characterization
A field-emission scanning electron microscope (FE-SEM, S4800, Hitachi), X-ray diffraction (XRD, X'pert Philips MPD diffractometer, using a Panalytical X'celerator detector and graphite monochromized Cu Kα radiation, λ = 1.54056 Å), high resolution transmission electron microscopy (HR-TEM, Philips CM30), and a selected area electron diffraction (SAED) analysis were used to study the morphology and crystalline structure of the nanostructured TiO2. X-ray photoelectron spectroscopy (XPS, PHI 5600, US) was performed to study the chemical composition of the samples. The density of the nanosheets (number of NSs per μm2) was measured by counting the number of nanosheets in one square micrometer via SEM images of 20k magnification. The facet ratio of S001/S001+101 was evaluated via SEM images by calculating the ratio of surface area of (001) to the total surface area of facets.Photocurrent spectra were measured in 0.1 M Na2SO4 in presence and absence of MeOH at an applied potential of 500 mV (vs. Ag/AgCl) in a three-electrode setup using 150 W Xe-lamp (Oriel 6365) and Oriel Cornerstone 7400 1/8 m monochromator.
Electrochemical impedance spectra (EIS) were measured in a 3-electrode cell, in 0.1 M Na2SO4 at voltages of −0.2 to −0.8 V in a frequency range of 0.1 Hz to 1 MHz. The curves were fitted with a Randles circuit using the Zahner IM5d software. The surface area was extracted from the double-layer capacitance (Cdl), as C is a function of A (A = electrochemically active surface area).
Results and discussion
In a first set of experiments, various growth parameters for the faceted crystallites were varied, as described in the experimental section. In line with literature, the morphology and faceting of the NS, grown on FTO, could be greatly influenced by the hydrothermal synthesis conditions, that is specifically: the concentration of the titania and fluoride precursor as well as reaction time and additions of DI water and HCl.22–24 This is illustrated step-by-step below.The SEM images in Fig. 1a shows flakes that are grown for 15 h in a solution containing 0.024 g mL−1 titanium isopropoxide with a variation in the concentration of ammonium hexafluorotitanate (F− ions) from 0.004, 0.008, 0.0125 to 0.016 g mL−1. Fig. S2† shows a TEM image and SAED pattern for the TiO2 nanosheets synthesized with the above recipe using a fluoride concentration of 0.008 g mL−1 (basic recipe). The nanosheets show crystalline lattice fringes with a spacing of 3.5 Å and 2.4 Å (Fig. S2a†), which correspond to (101) and (004) crystallographic planes of anatase, respectively. These planes have also been identified from the SAED patterns (Fig. S2b†) along with other characteristic anatase planes. The flakes in Fig. 1b show the same basic recipe using a fluoride concentration of 0.008 g mL−1 but with a change in the concentration of titanium isopropoxide (Ti4+ ions) from 0.016, 0.024 to 0.032 g mL−1. The results in Fig. 1a and b illustrate that by increasing the F precursor from 0.004 g mL−1 to 0.0125 g mL−1, the nanosheets become increasingly preferentially faceted towards (001). Also the flakes become larger and thus the entire layer on FTO thicker. The layer thickness of the sheets typically increased from 0.6 μm to 2.1 μm. At the same time, the flakes are initiated at a lower density on the FTO substrate. Roughly the density of the nanosheets decreases from ≈16.8 NSs/μm2 for the 0.004 g F mL−1 to ≈5.3 NSs/μm2 and ≈2.3 NSs/μm2 for 0.008 and 0.012 g F mL−1, respectively. At a F precursor concentration of 0.016 g mL−1, the thinnest nanosheets (73 nm) are obtained but they are very sparsely grown on the FTO substrate (≈3.2 NSs/μm2). From SEM images of Fig. 1b, it can be seen that according to the change in Ti to F ratio, the layer thickness and density of grown nanosheets on FTO increases with an increasing amount of Ti precursor from 0.016 g mL−1 to 0.032 g mL−1. For 0.016 g mL−1 Ti precursor, the nanosheets grow in a dispersed manner, with a high ratio of (001) to (101) facets (S001/S001+101 ≈ 93%).
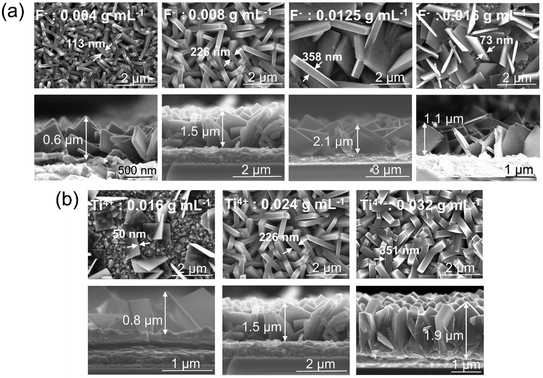 | ||
| Fig. 1 Top view and cross-sectional SEM images of TiO2 nanosheets grown on FTO using (a) different concentrations of F precursor, (b) different concentrations of Ti precursor. | ||
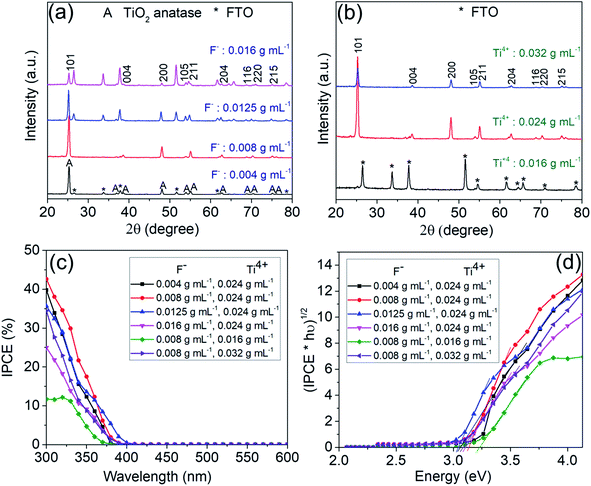
Fig. 2a and b show XRD spectra corresponding to the TiO2-NSs shown in Fig. 1a and b. Overall, the diffraction peaks that originate from titania (i.e. the oxide peaks) fit well to the TiO2 tetragonal anatase phase.25 All other XRD peaks can be assigned to the FTO substrate. The XRD spectra in Fig. 2b shows hardly any anatase peak for low concentration of Ti precursor (0.016 g mL−1), due to the low density of sheets under these synthesis conditions (Fig. 1b).
The different morphologies of Fig. 1a and b then were characterized by photocurrent spectra that were measured in 0.1 M Na2SO4 at 500 mV (vs. Ag/AgCl). The photocurrent spectra for the different samples (Fig. 2c) show the photon to current conversion efficiency (IPCE) peaks at ≈40% and 42.6%, respectively, for the sample produced with 0.004 g mL−1 and 0.008 g mL−1 of F precursor. Although a higher photocurrent value is obtained at wavelengths higher than ≈340 nm for nanosheets synthesized with 0.0125 g mL−1 F precursor, the samples synthesized with a lower concentration of F show a higher magnitude of the maximum photocurrent. In general, the results show that the coverage (as expected) is a first dominant factor that determines the overall photoresponse of the photoanodes. The low density of nanosheets (≈1.1 NSs/μm2) obtained with lower concentration of Ti (0.016 g mL−1) shows a maximum IPCE of only ≈11.7%.
Fig. 2d shows the band gap evaluation of different layers of Fig. 1a and b. All evaluations show a value of ≈3.1 eV, i.e. consistent with literature data for anatase,26,27 except the sample synthesized with a concentration of Ti precursor of 0.016 g mL−1. This sample shows a seemingly higher band gap (>3.2 eV) – this result is however due FTO that is exposed to the electrolyte.
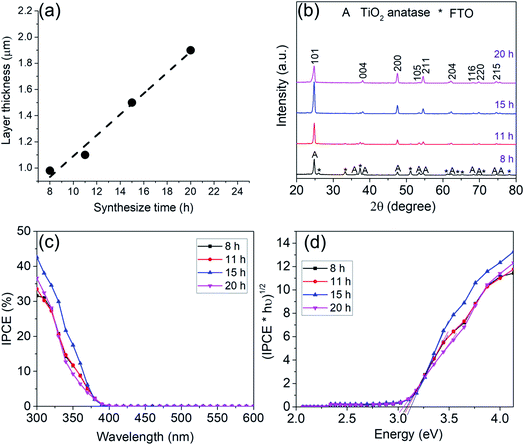
In order to systematically change the coverage and layer thickness of the nanosheets, we prepared a series of flake electrodes grown for different times. I.e. we kept the precursor composition of the best performing sample in Fig. 1 but changed the hydrothermal treatment time. The effect of reaction time on the morphology of the resulting TiO2-NSs is shown in Fig. 3. It is apparent that an increase in treatment time yields an increase in TiO2-NSs growth density (coverage) as well as the thickness of the TiO2-NS-layer. The cross sectional SEM images (Fig. 3) show that the layer thickness gradually increases from 0.98 μm obtained for a reaction time of 8 h to 1.1 μm, 1.5 μm and 1.9 μm for reaction times of 11 h, 15 h and 20 h, respectively. Fig. 4a shows the layer thickness of the nanosheets as a function of the synthesis time, suggesting that the growth rate of nanosheets is approximately linear throughout hydrothermal synthesis time, until the whole precursor is consumed.20 Thus, the hydrothermal reaction time can be used to adjust the thickness of the synthesized layers.
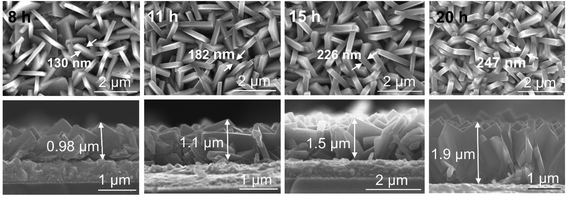 | ||
| Fig. 3 Top view and cross-sectional SEM images of TiO2 nanosheets grown on FTO for different synthesis times. | ||
Fig. 4b shows XRD patterns of the samples obtained for different hydrothermal treatment time. The data all confirm the formation of anatase. The disappearance of the FTO peaks for samples exposed for 8 h up to 20 h is in line with a growth of the layer thickness from ≈1 μm to 2 μm for the longest exposition time.
Photocurrent spectra in Fig. 4c show that with an increase in reaction time and layer thickness, the IPCE first increases and then decreased with further treatment time. A maximum IPCE of ≈32, 34, 42.6 and 37% is obtained for samples grown for 8, 11, 15 and 20 h respectively – i.e. the TiO2-NS arrays grown by 15 h reaction to a thickness of 1.5 μm show the highest photoelectrochemical performance.
The band gap evaluation in Fig. 4d for all samples show a value of ≈3.1 eV which again confirms anatase.
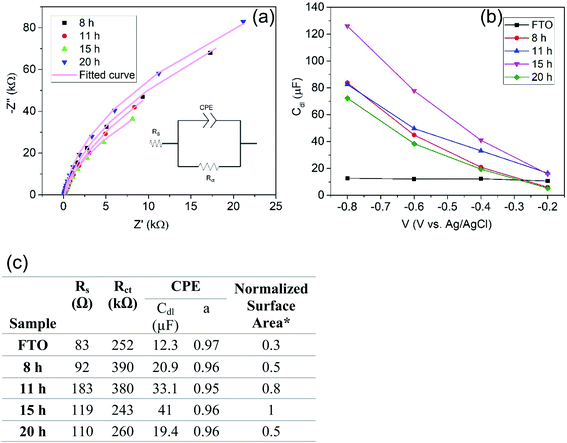
To assess the influence of the exposed surface area to the electrolyte we characterized the samples formed for the different reaction times with electrochemical impedance spectroscopy (EIS). Here the electrochemically active surface area of the TiO2-NSs samples can be derived from the double layer capacitance.28 In brief, if a semiconductor is forward biased, that is, for an n-type material it is held at potentials negative to the flat band potential (Ufb), it behaves like a metal and this allows us to obtain the double layer capacitance from the capacitance data (for titania in a neutral solution Ufb is at approximately −0.2 to 0.4 V (vs. Ag/AgCl)).29,31Fig. 5a shows examples of Nyquist plots for the different samples at a potential of −0.4 V Ag/AgCl. The data are fitted with a classic Randall's circuit consisting of a constant phase element (CPE) parallel to the charge transfer resistance (Rct) and in series with the ohmic resistance (Rs). The capacitance extracted is then taken as the double layer capacitance. Fig. 5b shows the double layer capacitance (Cdl) as a function of voltage obtained from a series of EIS measurements. Cdl then is related to the surface area by Cdl ∝ A. The evaluation of capacitance yields for a TiO2-NS layer grown for 8 h a capacitance of 20.9 μF. For a higher reaction time, 15 h, Cdl increases up to 41 μF. Further increase of reaction time to 20 h then yield a reduced Cdl of 19.4 μF (A/A0 = C/C0, where A0 and C0 are the active surface area and capacitance of the sample synthesized with the basic recipe: 1.5 mL Ti precursor, 0.5 g F precursor, HCl/DI: 30/30 for 15 h). This reflects first an increase of the electrochemically active surface area followed by a decrease that can be attributed to the fact that the thicker layers become also increasingly intergrown. In other words, the data obtained from Cdl measurements (active area) correlates well with differences observed in photoelectrochemical activities of TiO2-NSs in Fig. 4c. Hence, variations in the photoresponse can be ascribed mainly to the influence of the electrochemically active surface area.
We then evaluate the variation in the surface area of the samples in Fig. 1 as well. Fig. S3† indicates the double layer capacitance as a function of voltage for samples in Fig. 1 which are synthesized with different concentrations of Ti and F precursors. As one can see, a coherent trend is observed for all samples between the photoelectrochemical activity and extracted surface area from EIS.
In other words, the parameters investigated up to here show that all variations in the IPCE can be explained by the active surface area. The different faceting seems not to majorly affect the photoresponse.
However, another tool reported in literature used to tune crystal growth to achieve even more pronounced faceting is the addition of HCl (H+ ions) to the hydrothermal synthesis solution. Therefore, in an additional set of experiments we used different volume ratios of HCl to DI water of 33![[thin space (1/6-em)]](https://www.rsc.org/images/entities/char_2009.gif) :
:![[thin space (1/6-em)]](https://www.rsc.org/images/entities/char_2009.gif) 27, 30
27, 30![[thin space (1/6-em)]](https://www.rsc.org/images/entities/char_2009.gif) :
:![[thin space (1/6-em)]](https://www.rsc.org/images/entities/char_2009.gif) 30 and 20
30 and 20![[thin space (1/6-em)]](https://www.rsc.org/images/entities/char_2009.gif) :
:![[thin space (1/6-em)]](https://www.rsc.org/images/entities/char_2009.gif) 40 (in a total volume of 60 mL) as an addition to the base recipe of 0.024 g mL−1 titanium isopropoxide and 0.008 g mL−1 ammonium hexafluorotitanate and a synthesis time of 15 h. The SEM images in Fig. 6a shows that HCl addition has a great effect on the morphology and the facet ratio of the final layer. For a high amount of HCl (H+ ions) and low amount of DI water (HCl to DI of 40
40 (in a total volume of 60 mL) as an addition to the base recipe of 0.024 g mL−1 titanium isopropoxide and 0.008 g mL−1 ammonium hexafluorotitanate and a synthesis time of 15 h. The SEM images in Fig. 6a shows that HCl addition has a great effect on the morphology and the facet ratio of the final layer. For a high amount of HCl (H+ ions) and low amount of DI water (HCl to DI of 40![[thin space (1/6-em)]](https://www.rsc.org/images/entities/char_2009.gif) :
:![[thin space (1/6-em)]](https://www.rsc.org/images/entities/char_2009.gif) 20), no nanosheets grew on the surface of FTO (Fig. S4†). By using a HCl to DI water ratio of 33
20), no nanosheets grew on the surface of FTO (Fig. S4†). By using a HCl to DI water ratio of 33![[thin space (1/6-em)]](https://www.rsc.org/images/entities/char_2009.gif) :
:![[thin space (1/6-em)]](https://www.rsc.org/images/entities/char_2009.gif) 27, very thin nanosheets with the thickness of ≈49 nm with (001)-dominant facet (S001/S001+101 ≈ 91%) could be grown on the FTO substrate (Fig. 6a). On the other hand, by decreasing the amount of HCl, very thick nanosheets with a thickness of ≈760 nm with (101)-dominant facet (S001/S001+101 ≈ 50%) could be grown. From cross sectional SEM images (Fig. 6b) one can see that by decreasing the amount of HCl, the layer thickness increases from 0.9 μm obtained for HCl to DI water ratio of 33
27, very thin nanosheets with the thickness of ≈49 nm with (001)-dominant facet (S001/S001+101 ≈ 91%) could be grown on the FTO substrate (Fig. 6a). On the other hand, by decreasing the amount of HCl, very thick nanosheets with a thickness of ≈760 nm with (101)-dominant facet (S001/S001+101 ≈ 50%) could be grown. From cross sectional SEM images (Fig. 6b) one can see that by decreasing the amount of HCl, the layer thickness increases from 0.9 μm obtained for HCl to DI water ratio of 33![[thin space (1/6-em)]](https://www.rsc.org/images/entities/char_2009.gif) :
:![[thin space (1/6-em)]](https://www.rsc.org/images/entities/char_2009.gif) 27 to 1.8 μm for an HCl to DI water ratio of 20
27 to 1.8 μm for an HCl to DI water ratio of 20![[thin space (1/6-em)]](https://www.rsc.org/images/entities/char_2009.gif) :
:![[thin space (1/6-em)]](https://www.rsc.org/images/entities/char_2009.gif) 40. This example shows that in order to fully design TiO2 nanosheets on FTO, adjusting the aqueous phase by HCl is very effective.
40. This example shows that in order to fully design TiO2 nanosheets on FTO, adjusting the aqueous phase by HCl is very effective.
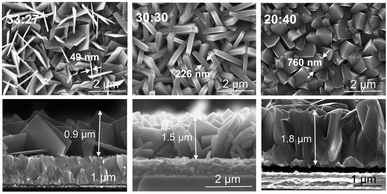 | ||
| Fig. 6 Top view and cross-sectional SEM images of TiO2 nanosheets grown on FTO with different ratios of HCl to DI water. | ||
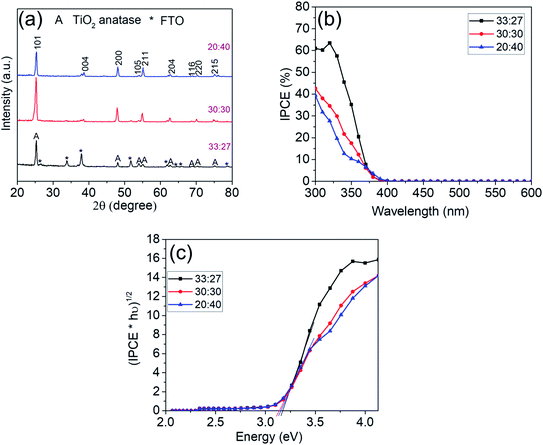
Fig. 7a shows the XRD pattern for these TiO2 nanosheets that all confirm the formation of TiO2 anatase.
Photocurrent spectra of the nanosheet layers in Fig. 7b show a similar bandgap (Fig. 7c) of 3.1 eV as obtained previously with all synthesized samples. The highest IPCE value (∼61%) is observed for the sample synthesized with a volume ratio of HCl to DI water of 33![[thin space (1/6-em)]](https://www.rsc.org/images/entities/char_2009.gif) :
:![[thin space (1/6-em)]](https://www.rsc.org/images/entities/char_2009.gif) 27. The capacitance data for the best performing strongly faceted sample in Fig. S3a† of 38–41 μF is virtually the same as for the best performing basic sample (Fig. 5) – reflecting a similar electrochemical area. However, the highly preferentially (001) faceted sample in Fig. 6 yields an IPCE of ∼61% while at the “regular” facet ratio only an IPCE of approximately 40% is reached.
27. The capacitance data for the best performing strongly faceted sample in Fig. S3a† of 38–41 μF is virtually the same as for the best performing basic sample (Fig. 5) – reflecting a similar electrochemical area. However, the highly preferentially (001) faceted sample in Fig. 6 yields an IPCE of ∼61% while at the “regular” facet ratio only an IPCE of approximately 40% is reached.
An evaluation of the facet ratio (S001/S001+101) yields ≈ 91% for highly faceted sample in Fig. 6 and ≈67% for the regularly faceted sample in Fig. 6. The higher IPCE thus may be associated with higher percentage of (001) facets that are reported to be favorable for oxidative reactions.18,30 Similarly, samples with (101)-dominant facet (S001/S001+101 ≈ 50%), despite their high active surface area (Fig. S5†), show even lower IPCE values (≈40%) when compared with the other two samples, due to the lower percentage of (001) facets which retards the oxidative reactions.21,30,31
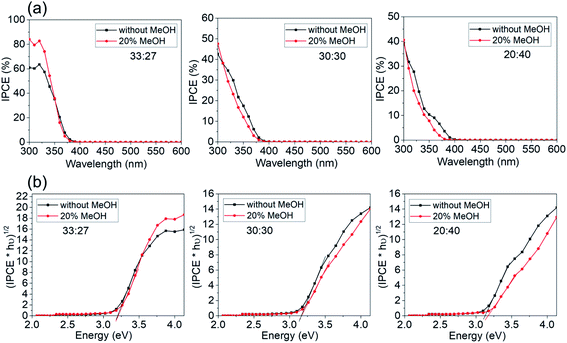
To further elucidate the effects of faceting on electrochemical reaction, photocurrent spectra of a series of samples in Fig. 6 were measured in presence of a hole capture agent (20% methanol).32,33 The results are shown in Fig. 8a. Only for the highest faceting ratio (91%), the hole transfer rate to the electrolyte becomes rate determining. For lower facet ratio samples, the photocurrent data are hardly at all affected by the presence of hole capture agent. As a note, the band gap evaluation in Fig. 8b shows that the band gap values are similar in presence and absence of MeOH.
Overall, this shows that for photoelectrochemical applications of this type of facet controlled anatase layers, first of all the effective electrochemical area is dominating as a critical factor for the photoresponse. The gain additional benefit from faceting, a high preferential faceting (S001/S001+101 > 90%) is needed. Such layers than can reach IPCE maxima for >80% under ideal conditions.
Conclusion
The present work systematically investigates the synthesis conditions on the morphology and structure of hydrothermally grown TiO2-NSs on FTO and their subsequent photoelectrochemical activity. The morphology and structure of TiO2-NSs can be largely affected by hydrothermal conditions, such as reaction time and reactant concentrations. We further explored the effects of morphology and structure of the synthesized nanosheets on their photoelectrochemical activity. We find that optimizing of the morphology and faceting of the nanosheet layers can strongly improve the photoelectrochemical performance of the layer. Performance improvement arises firstly from the beneficial effect of the larger electrochemically active surface area and secondly from a high percentage of (001) crystallographic facets. However, facet effects become only apparent, if the electrode has a very high ratio of 001/101 facets. Under optimized conditions, these electrodes provide a remarkable IPCE of >80%. These electrodes therefore represent a highly valuable nanostructure for wide applications in photoelectrohemistry.Conflicts of interest
There are no conflicts to declare.Acknowledgements
The authors would like to acknowledge the DFG and the Operational Research Program, Development and Education (European Regional Development Fund, Project No. CZ.02.1.01/0.0/0.0/15_003/0000416 of the Ministry of Education, Youth and Sports of the Czech Republic) for financial support.References
- P. Roy, S. Berger and P. Schmuki, Angew. Chem., Int. Ed., 2011, 50, 2904–2939 CrossRef CAS.
- M. Pelaez, N. T. Nolan, S. C. Pillai, M. K. Seery, P. Falaras, A. G. Kontos, P. S. M. Dunlop, J. W. J. Hamilton, J. A. Byrne, K. O'Shea, M. H. Entezari and D. D. Dionysiou, Appl. Catal., B, 2012, 125, 331–349 CrossRef CAS.
- I. Paramasivam, H. Jha, N. Liu and P. Schmuki, Small, 2012, 8, 3073–3103 CrossRef CAS.
- J. Schneider, M. Matsuoka, M. Takeuchi, J. Zhang, Y. Horiuchi, M. Anpo and D. W. Bahnemann, Chem. Rev., 2014, 114, 9919–9986 CrossRef CAS.
- K. Lee, A. Mazare and P. Schmuki, Chem. Rev., 2014, 114, 9385–9454 CrossRef CAS.
- H. Tsuchiya and P. Schmuki, Nanoscale, 2020, 12, 8119–8132 RSC.
- T. Luttrell, S. Halpegamage, J. Tao, A. Kramer, E. Sutter and M. Batzill, Sci. Rep., 2015, 4, 4043 CrossRef.
- N. Strataki, V. Bekiari, D. I. Kondarides and P. Lianos, Appl. Catal., B, 2007, 77, 184–189 CrossRef CAS.
- M. Ni, M. K. H. Leung, D. Y. C. Leung and K. Sumathy, Renewable Sustainable Energy Rev., 2007, 11, 401–425 CrossRef CAS.
- K. Hashimoto, H. Irie and A. Fujishima, Jpn. J. Appl. Phys., 2005, 44, 8269–8285 CrossRef CAS.
- K. Lv, B. Cheng, J. Yu and G. Liu, Phys. Chem. Chem. Phys., 2012, 14, 5349 RSC.
- T. Ohno, K. Sarukawa and M. Matsumura, New J. Chem., 2002, 26, 1167–1170 RSC.
- H. G. Yang, C. H. Sun, S. Z. Qiao, J. Zou, G. Liu, S. C. Smith, H. M. Cheng and G. Q. Lu, Nature, 2008, 453, 638–641 CrossRef CAS.
- W. Q. Fang, J. Z. Zhou, J. Liu, Z. G. Chen, C. Yang, C. H. Sun, G. R. Qian, J. Zou, S. Z. Qiao and H. G. Yang, Chem.–Eur. J., 2011, 17, 1423–1427 CrossRef CAS.
- M. Dozzi and E. Selli, Catalysts, 2013, 3, 455–485 CrossRef CAS.
- Q. Wu, M. Liu, Z. Wu, Y. Li and L. Piao, J. Phys. Chem. C, 2012, 116, 26800–26804 CrossRef CAS.
- Z. Xiong, Z. Lei, Y. Li, L. Dong, Y. Zhao and J. Zhang, J. Photochem. Photobiol., C, 2018, 36, 24–47 CrossRef CAS.
- A. Meng, J. Zhang, D. Xu, B. Cheng and J. Yu, Appl. Catal., B, 2016, 198, 286–294 CrossRef CAS.
- P. Liu, X. Huo, Y. Tang, J. Xu, X. Liu and D. K. Y. Wong, Anal. Chim. Acta, 2017, 984, 86–95 CrossRef CAS.
- D. Zhong, Q. Jiang, B. Huang, W.-H. Zhang and C. Li, J. Energy Chem., 2015, 24, 626–631 CrossRef.
- T. Butburee, P. Kotchasarn, P. Hirunsit, Z. Sun, Q. Tang, P. Khemthong, W. Sangkhun, W. Thongsuwan, P. Kumnorkaew, H. Wang and K. Faungnawakij, J. Mater. Chem. A, 2019, 7, 8156–8166 RSC.
- J. Li, Y. Yu, Q. Chen, J. Li and D. Xu, Cryst. Growth Des., 2010, 10, 2111–2115 CrossRef CAS.
- J. Yang, W. Li, J. Li, D. Sun and Q. Chen, J. Mater. Chem., 2012, 22, 17744 RSC.
- C. Canevali, S. Polizzi, A. Testino, I. R. Bellobono and V. Buscaglia, J. Am. Chem. Soc., 2017, 129, 3564–3575 Search PubMed.
- S. Feng, J. Yang, H. Zhu, M. Liu, J. Zhang, J. Wu and J. Wan, J. Am. Ceram. Soc., 2011, 94, 310–315 CrossRef CAS.
- S. Tanemura, L. Miao, W. Wunderlich, M. Tanemura, Y. Mori, S. Toh and K. Kaneko, Sci. Technol. Adv. Mater., 2005, 6, 11–17 CrossRef CAS.
- A. D. Paola, M. Bellardita and L. Palmisano, Catalysts, 2013, 3, 36–73 CrossRef.
- M.-L. Tremblay, M. H. Martin, C. Lebouin, A. Lasia and D. Guay, Electrochim. Acta, 2010, 55, 6283–6291 CrossRef CAS.
- A. Adán-Más, T. M. Silva, L. Guerlou-Demourgues and M. F. Montemor, Electrochim. Acta, 2018, 289, 47–55 CrossRef.
- X. Hu, S. Lu, J. Tian, N. Wei, X. Song, X. Wang and H. Cui, Appl. Catal., B, 2019, 241, 329–337 CrossRef CAS.
- L. Ruan, X. Wang, T. Wang, Z. Ren, Y. Chen, R. Zhao, D. Zhou, G. Fu, S. Li, L. Gao, Y. Lu, Z. Wang, H. Tian, X. Kong and G. Han, ACS Appl. Mater. Interfaces, 2019, 11, 37256–37262 CrossRef CAS.
- D. Dong, C. Yan, J. Huang, N. Lu, P. Wu, J. Wang and Z. Zhang, J. Mater. Chem. A, 2019, 7, 24180–24185 RSC.
- M. Shen and M. A. Henderson, J. Phys. Chem. Lett., 2011, 2, 2707–2710 CrossRef CAS.
Footnotes |
| † Electronic supplementary information (ESI) available. See DOI: 10.1039/d0na01017k |
| ‡ These authors contributed equally to this work. |
| This journal is © The Royal Society of Chemistry 2021 |

