 Open Access Article
A flexible and conductive connection introduced by cross-linked CNTs between submicron Si@C particles for better performance LIB anode†
Qiqi
Zhou
abc,
Junhao
Liu
 *ab,
Xuzhong
Gong
abc and
Zhi
Wang
*abc
aKey Laboratory of Green Process and Engineering, National Engineering Laboratory for Hydrometallurgical Cleaner Production Technology, Institute of Process Engineering, Chinese Academy of Sciences, Beijing 100190, P. R. China. E-mail: jhliu@ipe.ac.cn
bInnovation Academy for Green Manufacture, Chinese Academy of Sciences, Beijing 100190, P. R. China. E-mail: zwang@ipe.ac.cn
cSchool of Chemical Engineering, University of Chinese Academy of Sciences, Beijing 100049, P. R. China
First published on 19th February 2021
Abstract
To improve the inevitable capacity fading issues faced by traditional submicron Si@C electrodes used as anode materials in LIBs, a flexible and conductive connection design is proposed and realized by a solid-state growth approach. In this construction, Si@C is entangled into in situ synthesized carbon nanotube-based network to form a highly connective Si@C/CNTs composite. The interwoven carbon-nanotubes having tight linkages with Si@C contribute to ensure the charge transfer pathway within Si@C particles and accommodate the volume expansion during cycling. The Co/N co-doping further facilitates the transportation of Li ions. As expected, the Si@C/CNT electrode shows improved conductivity and long-term cyclic stability with a high-capacity retention ratio of 80.7% after 500 cycles at 0.5 A g−1. In this study, the flexible and conductive connection design realized by the in situ synthesis of CNTs can provide some reference to the improvement of alloy-type anode materials and not just Si-based anode materials for LIBs.
1. Introduction
Requirement for high energy density and stable lithium-ion batteries (LIBs) have been increase by the flourishing of portable electronic products and the new energy industry.1,2 It is most effective to obtain LIBs with high density by utilizing advanced anode materials. Si delivers a high theoretical capacity (3579 mA h g−1 for Li15Si4), which makes it the “shining star” among the anode materials.3 Moreover, Si shows much more advantages, such as low potential (under 0.5 V vs. Li+/Li) and abundant reserves in the earth (26.3% in the earth's crust).4 Nevertheless, Si particles suffer from volume change (∼300%) during the lithiation/delithiation process, leading to cyclic capacity deterioration and worse contact with the current collector. In addition, the low intrinsic electrical conductivity of Si leads to bigger electrochemical impedance and causes poor rate performance consequently.5Numerous promising strategies have been reported to tackle such intrinsic issues.6–8 It is known that coating Si core with a carbon outer shell is an effective method. Such a core–shell Si@C design not only can improve electric conductivity but also alleviate the volume expansion to some extent. Unfortunately, a carbon layer on the Si core surface is not robust enough to tolerate the repeated volume stress and solve problems during (de)lithiation.9 Moreover, the disconnected Si@C particles lead to the increment of impendence. It is requisite to strengthen the mechanical and conductive properties of Si@C anode.
Nowadays, different dimensional carbon additives have been introduced to integrate with Si in order to improve the mechanical stability and conductivity of silicon anodes. One-dimensional carbon nanotubes (CNTs) exhibit superb electronic conductivity and good mechanical properties. Combining Si@C structures with CNTs can make full use of the advantages of the two components. CNTs can provide an ion/electron transportation highway between Si@C particles and maintain structural stability. During cycling, flexible CNTs could also alleviate the expansion pressure. It is believed that the flexible and highly connective design realized by the introduction of CNTs could contribute to excellent cycling stability and rate performance.
To obtain the designed “flexible and conductive connection” between Si@C particles experimentally, the chemical vapor deposition (CVD) method is usually adopted to synthesize CNT outer Si particles.10–14 However, the CVD method is still limited on account of involving intricate processes, flammable or nocuous carbon sources, and tedious post-treatment. In this respect, the solid-state growth approach is a better candidate to grow bamboo-like CNTs from the surface of Si@C particles. This simple synthetic method only involves high temperature pyrolysis of the mixture of metal catalyst and N-containing carbon source.15 Considering such a facile process is suitable for modifying the Si@C composite, a highly connective submicron Si@C/CNT construction was prepared.
Here, we report a novel and facile strategy to construct a submicron Si@C/CNT configuration where CNTs are in situ grown to form flexible and interconnected linkages between submicron Si@C particles via a high temperature pyrolysis process. In the preparation, low-cost submicron Si recovered from photovoltaic waste Si was selected as the starting material. Urea was chosen to be the carbon source, and metallic cobalt reduced from Co2+ was the catalyst. As expected, CNTs grew from the surface of Si@C and connected with each other through conductive and flexible CNTs networks. Owing to the synergistic effects of the co-doping of Co/N and the flexible and conductive connection realized by cross-linked CNTs, the as-obtained Si@C/CNT composite shows excellent electrochemical performance during the long-time cycling when evaluated as an anode material of LIB, delivering a capacity of 1007.2 mA h g−1 at 0.5 A g−1 after 500 cycles with a capacity retention of 80.7%.
2. Experimental
2.1. Post treatment of waste silicon
The raw materials used in this configuration were received from the process of high-purity (>5 N) silicon wafers diamond wire cutting for photovoltaic applications, which are provided by Pingdingshan Yicheng New Materials Co., Ltd. According to Fig. S1a,† the raw materials consist of irregular micro-plates with a length in the range of 100 nm to 3 μm. First, the raw materials were ball-milled. Then, the materials were washed with acetone and hydrochloric acid (0.1 mol L−1) to remove the coolant and metal fragments. Finally, the materials were put into dilute hydrofluoric acid (0.05 mol L−1) to dissolve superficial silicon oxide. After the purification treatment, the Si content of the raw materials is about 99.8% according to the ICP-OES analysis. The purified materials consist of irregular spheres with a diameter of 100–500 nm (Fig. S1b†).2.2. Preparation of the Si@C composite electrode
Typically, 0.3 g purified silicon, 0.1 g CTAB (hexadecyl trimethyl ammonium bromide, Aldrich), 0.1 g resorcinol (Aldrich), and 1 mL ammonium hydroxide (25% NH3·H2O aqueous solution) were dispersed into a 500 mL solution (100 mL ethanol and 400 mL deionized water) and treated by ultrasonic dispersion for 1 h.16 After stirring for 15 min, 0.4 mL formaldehyde (38% aqueous solution) was added to the suspension, followed by stirring for 20 h. The as-obtained Si@RF intermediate was collected via extraction filtration and washed with ethanol and deionized water. After carbonization at 900 °C for 3 h under the N2 atmosphere, the product was denoted as Si@C.2.3. Preparation of the Si@C/CNT composite electrode
To load the Co catalyst precursor on the surface of Si@RF, 0.1 g urea, 0.1 gas-obtained Si@RF intermediate, and 0.05 g Co(No3)2·6H2O were dispersed into 60 mL deionized water by stirring and ultrasonication. After introducing into the water bath at 80 °C for 2 h, some cobalt oxide or hydroxide adhered to the surface of Si@RF owing to electrostatic attraction. The intermediate was collected and washed several times, which was denoted as Si@RF@Co(OH)2. Certain amounts of urea and Si@RF@Co(OH)2 were immersed into 100 mL deionized water and evaporated at 70 °C under continuous stirring. Finally, the obtained mixture was annealed at 900 °C for 3 h under N2 atmosphere and the obtained product denoted as Si@C/CNTs.2.4. Material characterization
The metallic elemental content was determined by inductively coupled plasma (ICP) optical emission spectroscopy (Thermo Scientific iCAP 7000, series ICP-OES). The morphology and elemental distribution were obtained via scanning electron microscopy (Hitachi S4800) and transmission electron microscopy, which was recorded in an FEI Tecnai F20 at the accelerating voltage of 200 kV. The phase structure was analyzed via X-ray powder diffraction (XRD) measurements using an AXS D8 Advance Diffractometer (Cu-Kα radiation) from Bruker, Inc. Raman spectroscopy was performed by a Renishaw inVia Reflex Raman spectrometer with a 532 nm wavelength laser. Thermal gravimetric analysis (TGA) (Pyris Diamond, PerkinElmer, USA) was conducted at a heating rate of 10 °C min−1 in air. X-ray photoelectron spectroscopy (XPS) (Thermo Scientific K-Alpha, USA) was used to determine the elemental chemical composition of Si@C/CNTs.2.5. Electrochemical measurements
Coin-cells were prepared to conduct electrochemical tests. 70 wt% anode materials, 20 wt% carbon black, and 10 wt% PVDF are dispersed into N-methyl-2-pyrrolidone to form a homogeneous mixture, and then the mixture was pasted onto a copper foil and dried at 120 °C for 12 h. A lithium foil was selected as the counter electrode. A Celgard 2400 membrane was used as the separator, and 1 M LiPF6 was dissolved into the solvent of ethylene carbonate (EC), ethyl methyl carbonate (EMC), and dimethyl carbonate (DEC) (in 1![[thin space (1/6-em)]](https://www.rsc.org/images/entities/char_2009.gif) :
:![[thin space (1/6-em)]](https://www.rsc.org/images/entities/char_2009.gif) 1
1![[thin space (1/6-em)]](https://www.rsc.org/images/entities/char_2009.gif) :
:![[thin space (1/6-em)]](https://www.rsc.org/images/entities/char_2009.gif) 1 volume ratio) to obtain the electrolyte. The diameter of the electrode was 0.8 cm, and the mass loading of Si@C/CNTs was about 1.6 mg cm−2. Energy density was calculated based on the mass of the active material. The assembling of coin-cells was operated in an Ar-filled glove box.
1 volume ratio) to obtain the electrolyte. The diameter of the electrode was 0.8 cm, and the mass loading of Si@C/CNTs was about 1.6 mg cm−2. Energy density was calculated based on the mass of the active material. The assembling of coin-cells was operated in an Ar-filled glove box.
The galvanostatic discharge/charge cycling was tested on a LAND-CT2001A battery test system (Jinnuo Wuhan Corp., China) at different current densities in the voltage range from 0.01 V to 3.0 V (vs. Li/Li+). Cyclic voltammetry (CV) tests were conducted on an electrochemistry workstation at a scan rate of 0.1 mV s−1.
3. Results and discussion
3.1. Structural characterization
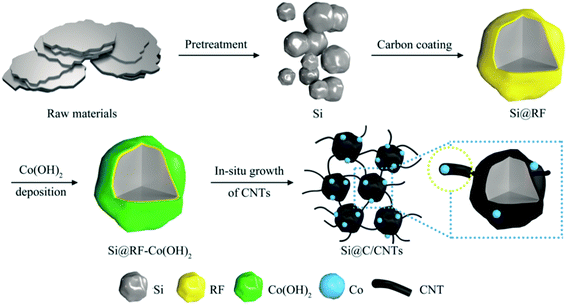
The synthesis processes of Si@RF and Si@C/CNTs are illustrated in Scheme 1. First, resorcinol and formaldehyde condensed on the surface of purified silicon particles to obtain Si@RF (Fig. S2a†). Then, Si@RF materials were evenly coated within cobalt hydroxide or oxide shells through the solution method (Fig. S2b†). Finally, the as-obtained Si@RF@Co(OH)2 was mixed with urea, followed by a self-catalyzed solid-state growth method. During the annealing process, Si@RF acted as the feedstock, urea served as the carbon source, and in situ reduced metallic Co acted as a catalyst for the generation of CNTs according to the bottom-up method.17 Commercially available and cheap urea decomposed into CN gas18 and reduced Co2+ to metallic Co. The CN gas tended to form CNTs on the surface of Si@C with the help of the Co catalyst. Due to the grafting affinity of urea with the surface oxygenic functional groups of Si@RF, the nitridation of carbon was also achieved.19The XRD pattern in Fig. 1a displays that the Si@C/CNT composite is composed of crystalline Si (JCPDS card, no. 27-1402) and metallic Co (JCDS card, no. 89-4307). Raman spectroscopy is further employed to characterize the graphitic degree through the intensity ratio of the D band and G band (ID/IG). The D band (located at 1356 cm−1) and G band (located at 1592 cm−1) derived from the carbon shell and CNTs correspond to amorphous carbon and graphitic carbon of the Si@C/CNT material (Fig. 1b). A lower ratio of graphitic carbon (ID/IG = 0.91) contributes to better electrical conductivity.19 The TG pattern in Fig. 1d exhibits that the carbon content in Si@C/CNTs is almost 53.9%. According to the EDX spectra in Fig. S3,† the Si, Co, and N contents are estimated to be 34.2%, 5.7%, and 5.3%, respectively.
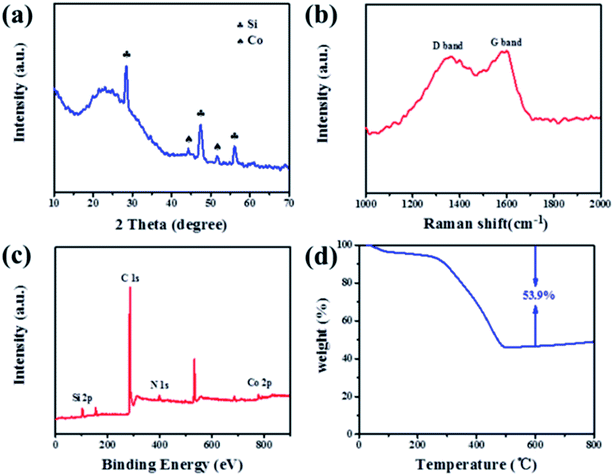 | ||
| Fig. 1 (a) XRD pattern, (b) Raman spectrum, (c) full XPS spectra, and (d) TG curve of Si@C/CNTs composite. | ||
Fig. 2a displays the overall morphology of Si@C/CNTs. CNTs act as a linkage between Si@C particles. Such an interconnected hybrid structure establishes an additional transportation pathway for electrons and ions and CNT-based buffering matrix. According to the EDX mapping in Fig. 2b, cobalt particles evenly distributed on the surface of Si@C are conducive to improving the conductivity of this configuration.
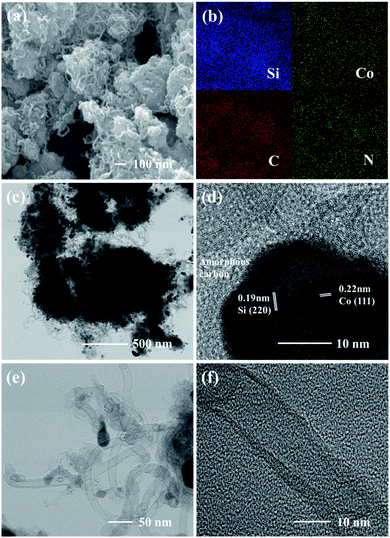 | ||
| Fig. 2 (a) SEM images of Si@C/CNTs and (b) EDX mapping images for (a). (c) TEM image and (d) HRTEM image of Si@C/CNTs. (e) TEM image and (f) HRTEM image of CNTs. | ||
To characterize the connection between Si@C and CNTs, TEM images were observed after powerful sonication for 2 h in ethanol. As displayed in Fig. 2c, CNTs are adhered tightly to the surface of Si@C, suggesting a strong coupling between Si@C and CNTs instead of physisorption. The TEM images also confirm that Si@C particles are interconnected by CNTs to construct an interacted conductive structure. Fig. S6† shows the typical connection between Si@C and CNTs. As supported by EDX mapping in Fig. S7,† curly CNTs grew from the surface of Si@C and intertwined with other Si@C particles. It is obvious that outer amorphous carbon tightly connected CNTs with the inner Si core. The tight connection between Si and CNTs through the carbon boundary can not only enhance the mechanical stability of the active material but also ensure the transportation pathway of Li-ion from CNTs to Si. From the HRTEM image in Fig. 2d, Co particles are dispersed on the surface of Si@C. The HRTEM analysis further depicts the phase composition of Si@C/CNTs, which corresponds to the XRD pattern. It can be observed from Fig. 2e and f that CNTs are hundreds of nanometer long and nanometer wide with typical bamboo-shaped structures.20 The walls of CNTs are not parallel, indicating that there are numerous defect sites in CNTs, which can provide more lithium storage active sites and reduce the diffusion resistance of the electrolyte.21
By means of N2 absorption, the specific surface area of the Si@C/CNT composite is 104.94 m2 g−1 according to the N2 adsorption desorption isotherm shown in Fig. S4a.† Based on the pore size distribution curves in Fig. S4b,† pores in Si@C/CNTs are mesopores around 3 nm and 10 nm. It can be deduced that the pores centered at ∼3 nm result from the pyrolysis of urea and phenolic resin, while the pores around 10 nm are coincident with the inner diameter of CNTs as mentioned above for the TEM image analysis. These mesopores get access to lithium ions and electrons easier.
XPS measurement was conducted to clarify the elemental composition and chemical state of the Si@C/CNT composite. The full spectrum in Fig. 1c confirms the co-existence of Si, Co, C, and N in the Si@C/CNT composite, which is consistent with the EDX mapping in Fig. 2b. Fig. S5† displays the high-resolution XPS spectrum of Si 2p, C 1s, Co 2p, and N 1s. The Si 2p spectrum is deconvoluted into three peaks: 99.8, 102.4, 103.3, and 104.0 eV, corresponding to Si0, Si2+, Si3+, and Si4+. The presence of silicon oxide can be attributed to native oxidation in air.22 The fitted C 1s spectrum in Fig. S5b† displays three peaks located at 284.8, 285.5, and 289.1 eV, referring to C–C, C–O, and C–N bonds, respectively.23 The formation of the C–N bond verifies N-doping into this connective construction. N-doping can enhance lithium storage kinetics because of the higher electronegativity and smaller diameter of nitrogen than carbon.24 In the Co 2p spectrum, peaks at 778.6 and 793.7 eV can be ascribed to Co 2p3/2 and Co 2p1/2 states, and peaks at 782.3 and 799.6 eV are their satellite peaks, respectively, which are coincident with zero-valent cobalt, while the peak at 799.63 eV is assigned to Co2+.25 The high-resolution spectra of N 1s in Fig. S5d† indicates the existence of pyridinic N (398.2 eV), pyrrolic N (399.4 eV), and graphitic N (401.2 eV).26 The weight percentage of different N types is presented in Table S1.† The higher ratio of graphitic N contributes to the enhancement of electrical conductivity.27 Metallic Co-doping along with N-doping are favorable for the improvement of Li+ storage kinetics.
3.2. Electrochemical properties
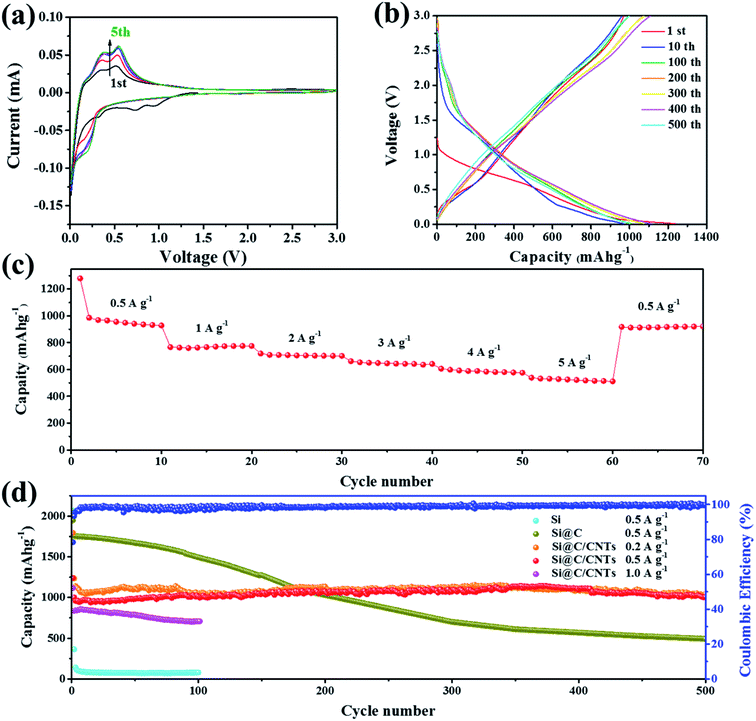
To investigate the electrochemical performance of the Si@C/CNT composite, typical electrochemical tests were performed. Fig. 3a shows the CV curves of the Si@C/CNT composite electrode with a voltage range from 0.01 to 3.00 V (relative to Li+/Li). In the first cathodic scan, the sharp peaks below 0.1 V can be attributed to the lithiation of crystalline silicon.28 Moreover, a small peak appearing at 0.92 V is ascribed to the presence of CoO in Si@C/CNTs.29 To some extent, during the first cycling, CoO can provide some lithium storage capacity, while this peak disappears in the next circulation. It can be deduced that CoO has trapped some lithium ions, which result in some irreversible capacity loss. The two obvious peaks at 0.35 and 0.52 V in the anodic scan imply the dealloying of Li–Si alloy.30 Another peak at 0.20 V denotes the insertion of lithium ions into amorphous carbon. In the second cycling, a peak appearing at about 0.22 V can be assigned to the lithiation of amorphous Si originating from crystalline silicon during the lithiation/delithiation process.31 Moreover, the peak located at 0.7 V disappears, which may be attributed to the irreversible formation of the solid electrolyte interface (SEI) layer. In addition, after three cycles of activation, CV curves for the 3D Si@C/CNT electrode particularly overlap, revealing its good cycling durability. Fig. 3b displays the specific charge/discharge profiles during galvanostatic cycling. Plateaus at 0.35 and 0.52 V correspond to the above-mentioned CV curves. During the first circulation, the discharge capacity of the Si@C/CNT electrode is 1239 mA h g−1 with an initial coulombic efficiency (CE) of 80.8%. Subsequently, the CE increased to 99.2% in the 10th cycle. With continuous cycling, the CEs of the 100th, 200th, 300th, 400th, and 500th circulations are 99.1%, 99.3%, 99.7%, 99.6%, and 99.7%, respectively. The value of CE nearly to 100% confirms the excellent reversibility.The Si@C/CNT electrode shows overwhelming advantages over the Si@C electrode in long-time cyclic stability (shown in Fig. 3d). The Si@C/CNT electrode shows a particularly slight decay in the first 20 cycles on account of the formation of SEI film, reconstruction of active materials, and the presence of CoO.32 In the next cycling, the capacity shows a general trend of increasing slightly. That phenomenon can be ascribed to the activation of the inner wrapped active materials.33 Even with cycling at 0.5 A g−1 after 500 cycles, as displayed in Fig. 3d, a reversible capacity of 1000.7 mA h g−1 was obtained with a high-capacity retention ratio of 80.7% (relative to the first cycling). However, as for the results in Fig. 3d, the capacity retention ratio of Si@C after 500 cycles is only 25.2% (relative to the first cycling), and it may be assigned to the structural collapse of the Si@C electrode, which lacks a powerful enough buffer matrix to sustain the volume expansion of submicron Si. The Si electrode exhibits fast decay behavior in initial cycles, which can be attributed to the enormous volume expansion. The huge difference, as shown above, confirms the unique capacity retention advantage Si@C/CNT electrode firmly. Compared to the Si@C electrode, the flexible CNT network endows the Si@C/CNT electrode with outstanding cycling stability. A comparison of the electrochemical performance of the photovoltaic waste Si-based electrode for lithium-ion batteries is presented in Table S2.† Compared with other electrodes derived from photovoltaic waste silicon, the Si@C/CNT electrode reported in this study exhibits superiority in long-cycling stability.
The Si@C/CNT electrode underwent specific high current densities to test rate performance. In Fig. 3c, capacities of 928.1, 775.1, 701.4, and 641.4 mA h g−1 were obtained at current densities of 0.5, 1, 2, 3, and 4 A g−1, respectively. Even if a current of 5 A g−1 was applied, a specific capacitance of 575.5 mA h g−1 was observed. When the current density returned to 0.5 A g−1, the electrode can again deliver 920.9 mA h g−1 and recovers 99.2% of the initial capacity at 0.5 A g−1, which suggests good capacity retention.
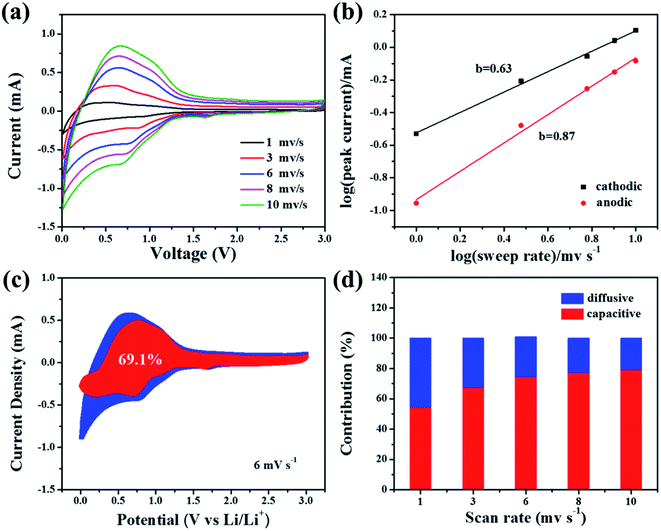
The total lithium-storage capacitance is controlled by the surface capacitive storage process and lithiation/delithiation process (diffusion process).34 A kinetic study starting from the obtained CV curves at various scan rates was conducted to demonstrate the percentage of capacitive-controlled contribution to overall capacity.27 As displayed in Fig. 4a, the similar shape of CV curves at different scan rates exhibit good electrochemical response. According to a previous study,31 the peak current (denoted as i) obeys the following relationship with scan rate (denoted as v):
| i = avb |
The b values can be determined from the slope of fitted lines, namely the slope of log![[thin space (1/6-em)]](https://www.rsc.org/images/entities/char_2009.gif) v against log
v against log![[thin space (1/6-em)]](https://www.rsc.org/images/entities/char_2009.gif) i. The b values for the Si@C/CNT electrode are displayed in Fig. 4b. The b values from 0.5 to 1.0 represent the co-existence of the above two processes. The precise value of the capacitive-controlled contribution ratio can be calculated by:
i. The b values for the Si@C/CNT electrode are displayed in Fig. 4b. The b values from 0.5 to 1.0 represent the co-existence of the above two processes. The precise value of the capacitive-controlled contribution ratio can be calculated by:
| i(v) = k1v + k2v1/2 |
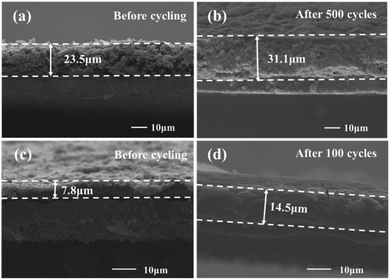
The SEM technique was conducted to verify the superior structural stability of the Si@C/CNT electrode. As shown in Fig. 5b, there are evident and compact SEI films formed on the surface of the Si@C/CNT electrode. In striking contrast, the SEI films formed on the surface of the Si@C electrode are cracked, as displayed in Fig. 5d, which would lead to huge irreversible consumption of electrolyte and lithium ions. Compared with the volume expansion ratio of the Si@C/CNT electrode (32.3%, calculated from Fig. 5a and b) after 500 cycles, the thickness of the Si@C electrode reached up to 1.86 times than that of the fresh electrode only after 100 cycles. That tremendous difference affirms that the Si@C/CNT electrode owns the strong ability to alleviate the volume expansion during repeated circulation. Apparently, it is the additionally flexible and conductive connection introduced by the in situ synthesis of interlinked CNTs that offer Si@C/CNT electrode the preferable performance.
4. Conclusions
A flexible and conductive connection design realized by interlinked CNTs is proposed to improve capacity fading and poor conductivity issues of the Si@C anode material. The CNT cross-linked submicron Si@C/CNT composite was successfully synthesized by the thermal pyrolysis method, and its superior performance than traditional Si@C composites used as an anode in LIBs has been demonstrated. Owing to the flexible and conductive connection design and Co/N co-doping, the Si@C/CNT construction can buffer the volume expansion effectively and provide an interconnected electron/ion transportation highway. The Si@C/CNT composite shows a reversible capacity of 1000.7 mA h g−1 after 500 cycles with a high-capacity retention ratio of 80.7% (relative to the first cycling) when tested as the LIB anode at 0.5 A g−1.Conflicts of interest
There are no conflicts to declare.Acknowledgements
This work was financially supported by the National Key R&D Program of China (2018YFC1901801) and the National Natural Science Foundation of China (52074255, 51704271, and U1702251).References
- D. Bresser, S. Passerini and B. Scrosati, Energy Environ. Sci., 2016, 9, 3348–3367 RSC.
- B. Scrosati and J. Garche, J. Power Sources, 2010, 195, 2419–2430 CrossRef CAS.
- W. J. Zhang, J. Power Sources, 2011, 196, 13–24 CrossRef CAS.
- W. Luo, X. Q. Chen, Y. Xia, M. Chen, L. J. Wang, Q. Q. Wang, W. Li and J. P. Yang, Adv. Energy Mater., 2017, 7, 1701083 CrossRef.
- X. L. Wang and W. Q. Han, ACS Appl. Mater. Interfaces, 2010, 2, 3709–3713 CrossRef CAS PubMed.
- J. L. Wu, J. H. Liu, Z. Wang, X. Z. Gong and Y. Wang, Chem. Eng. J., 2019, 370, 565–572 CrossRef CAS.
- X. L. Chen, G. Konstantinos, J. C. Guo, A. Brown, R. Ghodssi, J. N. Culver and C. S. Wang, Electrochim. Acta, 2011, 56, 5210–5213 CrossRef CAS.
- H. J. Tian, X. J. Tan, X. X. Feng, C. S. Wang and W. Q. Han, Nano Energy, 2015, 11, 490–499 CrossRef CAS.
- M. G. Jeong, H. L. Du, I. Mobinul, J. K. Lee, Y. K. Sun and H. G. Jung, Nano Lett., 2017, 17, 5600–5606 CrossRef CAS PubMed.
- Y. Zheng, L. Ning, Y. Y. Zhao, W. W. Wang, Y. Qiao, Y. C. Zhu and Y. T. Qian, Energy Storage Mater., 2019, 17, 93–100 CrossRef.
- J. B. Zhou, L. Yang, K. L. Zhang, G. L. Xia, J. Du, Y. C. Zhu and Y. T. Qian, Nanoscale, 2016, 8, 4903–4907 RSC.
- F. Xu, J. J. Ji, X. P. Jiang, W. Wang and Z. P. Liu, RSC Adv., 2016, 6, 78559–78563 RSC.
- T. K. Zhao, S. F. She, X. G. Ji, W. B. Jin, A. Dang, H. Li, T. H. Li, S. M. Shang and Z. G. Zhou, J. Alloys Compd., 2017, 708, 500–507 CrossRef CAS.
- J. M. Su, J. Y. Zhao, L. Y. Li, C. C. Zhang, C. G. Chen, T. Huang and A. S. Yu, ACS Appl. Mater. Interfaces, 2017, 9, 17807–17813 CrossRef CAS PubMed.
- Y. L. Ding, P. Kopold, K. Hahn, P. A. van Aken, J. Maier and Y. Yan, Adv. Funct. Mater., 2016, 26, 1112–1119 CrossRef CAS.
- J. M. Su, C. C. Zhang, X. Chen, S. Y. Liu, T. Huang and A. S. Yu, J. Power Sources, 2018, 381, 66–71 CrossRef CAS.
- Y. Hou, S. M. Cui, Z. H. Wen, X. R. Guo, X. L. Feng and J. H. Chen, Small, 2015, 11, 5940–5948 CrossRef CAS PubMed.
- Z. Zhang, L. L. Kong, S. Liu, G. R. Li and X. P. Gao, Adv. Energy Mater., 2017, 7, 1602543 CrossRef.
- A. Sadezkya, H. Muckenhuber, H. Grothe, R. Niessner and U. Pöschl, Carbon, 2005, 43, 1731–1742 CrossRef.
- Q. C. Wang, Y. P. Lei, Z. Y. Chen, N. Wu, Y. B. Wang, B. Wang and Y. D. Wang, J. Mater. Chem. A, 2018, 6, 516–526 RSC.
- H. Tabassum, R. Zou, A. Mahmood, Z. B. Liang, Q. F. Wang, H. Zhang, S. Gao, C. Qu, W. H. Guo and S. J. Guo, Adv. Mater., 2018, 30, 1705441 CrossRef PubMed.
- L. Shi, W. K. Wang, A. B. Wang, K. G. Yuan and Y. S. Yang, J. Mater. Chem. A, 2014, 2, 20213–20220 RSC.
- J. L. Wang, X. F. Yan, Z. Zhang, H. J. Ying, R. G. Guo, W. T. Yang and W. Q. Han, Adv. Funct. Mater., 2019, 29, 1904819 CrossRef.
- L. Qie, W. M. Chen, Z. H. Wang, Q. G. Shao, X. Li, L. X. Yuan, X. L. Hu, W. X. Zhang and Y. H. Huang, Adv. Mater., 2012, 24, 2047–2050 CrossRef.
- Y. Y. Liu, H. L. Jiang, Y. H. Zhu, X. L. Yang and C. Z. Li, J. Mater. Chem. A, 2016, 4, 1694–1701 RSC.
- Y. J. Yao, C. Lian, G. D. Wu, Y. Hu, F. Y. Wei, M. J. Yu and S. B. Wang, Appl. Catal. B Environ., 2017, 219, 563–571 CrossRef CAS.
- D. L. Chao, P. Liang, Z. Chen, L. Y. Bai, H. Shen, X. X. Liu, X. H. Xia, Y. L. Zhao, S. V. Savilov, J. Y. Lin and Z. X. Shen, ACS Nano, 2016, 10, 10211–10219 CrossRef CAS PubMed.
- R. V. Salvatierra, A. R. O. Raji, S. K. Lee, Y. S. Ji, L. Li and J. M. Tour, Adv. Energy Mater., 2016, 6, 1600918 CrossRef.
- X. L. Sun, G. P. Hao, X. Y. Lu, L. X. Xi, B. Liu, W. P. Si, C. S. Ma, Q. M. Liu, Q. Zhang, S. Kaskel and O. G. Schmidt, J. Mater. Chem. A, 2016, 4, 10166–10173 RSC.
- M. Gauthier, D. Mazouzi, D. Reyter, B. Lestriez, P. Moreau, D. Guyomard and L. Roué, Energy Environ. Sci., 2013, 6, 2145–2155 RSC.
- G. A. Muller, J. B. Cook, H. S. Kim, S. H. Tolbert and B. Dunn, Nano Lett., 2015, 15, 1911–1917 CrossRef CAS PubMed.
- Y. L. Zhou, D. Yan, H. Y. Xu, J. K. Feng, X. L. Jiang, J. Yue, J. Yang and Y. T. Qian, Nano Energy, 2015, 12, 528–537 CrossRef CAS.
- Y. Xiao Y, J. Y. Hwang, I. Belharouak and Y. K. Sun, Nano Energy, 2017, 32, 320–328 CrossRef.
- V. Augustyn, J. Come, M. A. Lowe, J. W. Kim, P. L. Taberna, S. H. Tolbert, H. D. Abruña, P. Simon and B. Dunn, Nat. Mater., 2013, 12, 518–522 CrossRef CAS.
- Y. Ma, Y. G. Ma, D. Bresser, Y. C. Ji, D. Geiger, U. Kaiser, C. Streb, A. Varzi and S. Passerini, ACS Nano, 2018, 12, 7220–7231 CrossRef CAS PubMed.
- J. W. Han, D. B. Kong, W. Lv, D. M. Tang, D. L. Han, C. Zhang, D. H. Liu, Z. C. Xiao, X. H. Zhang, J. Xiao, X. Z. He, F. C. Hsia, C. Zhang, Y. Tao, D. Golberg, F. Y. Kang, L. J. Zhi and Q. H. Yang, Nat. Commun., 2018, 9, 1–9 CrossRef PubMed.
Footnote |
| † Electronic supplementary information (ESI) available. See DOI: 10.1039/d1na00012h |
| This journal is © The Royal Society of Chemistry 2021 |

