 Open Access Article
Graphene composite 3,4,9,10-perylenetetracarboxylic sodium salts with a honeycomb structure as a high performance anode material for lithium ion batteries
Mengqian
Xu†
,
Jianjun
Zhao†
 ,
Jun
Chen
 *,
Kang
Chen
,
Qian
Zhang
and
Shengwen
Zhong
*
School of Materials Science and Engineering, Jiangxi Provincial Key Laboratory of Power Batteries and Materials, Jiangxi University of Sciences and Technology, Ganzhou 341000, China. E-mail: chenjun@jxust.edu.cn; zhongshw@126.com
First published on 21st June 2021
Abstract
In order to address the issues of high solubility in electrolytes, poor conductivity and low active site utilization of organic carbonyl electrode materials, in this work, the 3,4,9,10-perylenetetracarboxylic sodium salt (PTCDA-Na) and its graphene composite PTCDA-Na-G are prepared by the hydrolysis of 3,4,9,10-perylenetetracarboxylic dianhydride and the strategy of antisolvent precipitation. The obtained PTCDA-Na active substance has a porous honeycomb structure, showing a large specific surface area. Moreover, after recombination with graphene, the dispersion and specific surface area of PTCDA-Na are further enhanced, and more active sites are exposed and conductivity is improved. As a result, the PTCDA-Na-G composite electrode materials exhibit superior electrochemical energy storage behaviors. The initial charge capacity of the PTCDA-Na-G electrode is 890.5 mA h g−1, and after 200 cycles, the capacity can still remain at 840.0 mA h g−1 with a high retention rate of 94.3%, which is much larger than those of the PTCDA-Na electrode. In addition, at different current densities, the PTCDA-Na-G electrode also presents higher capacities and better cycle stability than the PTCDA-Na electrode. Compared with PTCDA-Na with a porous honeycomb structure and previously reported sodium carboxylic acid salts with a large size bulk structure, the PTCDA-Na-G composite material prepared in this work shows superior electrochemical energy storage properties due to its large specific surface area, high dispersion, more exposed active sites and large electrical conductivity, which would provide new ideas for the development of high performance organic electrode materials for lithium-ion batteries.
1 Introduction
With the increasing demand of high power equipment for energy storage devices, lithium ion batteries with large capacity, long cycle and high rate performance are attracting extensive interest from researchers.1–3 In lithium ion batteries, the negative electrode material is one of the key materials that affect the performance of the battery.4–6 At present, the traditional negative electrode material which has been commercialized is the graphite carbon negative electrode; however, there are still many problems such as a limited theoretical capacity (372 mA h g−1), unstable layered structure, poor cycling stability and so on, which limit its application in high power energy storage batteries.7–9 Therefore, it is urgent to develop novel high performance anode materials to meet the increasing market demand. Subsequently, many other negative electrode materials have been studied, such as hard carbon materials, transition metal oxides, silicon negative electrode materials, and so on.10–15 Some of the designed materials show superior properties and provide new ideas for the subsequent development of high performance negative electrode systems, but they have their own advantages and disadvantages.Organic compounds16–21 as a new class of electrode materials are of great interest to researchers because of their advantages of high theoretical specific capacity, abundant raw materials, environmental friendliness, strong structural designability and so on. Among them, conjugated organic molecules containing unsaturated double bond structures have the advantages of fast redox reaction kinetics, high capacity and structural diversity due to their conjugated systems and multiple unsaturated groups, which is of broader concern in their roles as emerging electrochemical energy-storage materials.22–29 However, organic electrode materials with small molecules still have the problems of high solubility in electrolytes, poor conductivity and limited exposed active sites, which greatly limit the electrochemical performance of such materials.30–34 To address these issues, researchers have carried out many modification studies,35–41 such as grafting active groups onto macrocyclic conjugated structures, polymerization, doping with inorganic systems, and so on. These methods have greatly improved the performance of organic electrode and provided many new ideas for subsequent modification. However, many modification measures can lead to the decrease of the proportion and specific capacity of the active components, or cannot fundamentally solve the problem of poor conductivity.41–43 Therefore, it is still necessary to design new modification measures to solve the above problems of organic electrode materials at the same time.
In this work, 3,4,9,10-perylenetetracarboxylic dianhydride (PTCDA) was added to NaOH aqueous solution to hydrolyze, and ethanol anti-solvent is added to obtain a yellowish-brown precipitate of perylenetetracarboxylic sodium salts (PTCDA-Na). As a result, lower solubility in the electrolyte is observed, and at the same time, the composite material of perylenetetracarboxylic sodium salts with graphene (PTCDA-Na-G) is used as an anode material for lithium ion batteries, showing improved capacity, cycling stability and rate capability. The strategy of sodium salinization of an organic compound and its graphene recombination technology will provide new ideas for the design of novel organic electrode materials with high performance for lithium-ion batteries.
2 Experimental
2.1 Materials
The raw materials used in this work, such as 3,4,9,10-perylenetetracarboxylic dianhydride (PTCDA), NaOH, graphene, Super P, anhydrous ethanol, poly(vinylidene fluoride) (PVDF), N-methylpyrrolidone (NMP), etc., are purchased from Chemical Reagent Co., Ltd, and are used directly without any purification.2.2 Synthesis
2.3 Characterization and electrochemical tests
UV-Vis spectroscopy and dissolution experiments were conducted on a Hitachi U-3010 spectrophotometer. The infrared spectrum was obtained with a Fourier transform infrared (FTIR) spectrophotometer Bruker IFS66/S. X-ray diffraction spectroscopy (XRD) was performed with an X-ray diffractometer under Cu Kα radiation. Scanning electron microscopy (SEM) images were obtained on a ZEISS Crossbeam 340 scanning electron microscopy analyzer. A transmission electron microscope (FEI Tecnai G2F20) was used to capture the TEM images. X-ray photoelectron spectroscopy (XPS) was carried out on a Thermo Fisher K-Alpha with an Al Kα X-ray source.Before the electrochemical performance test, all cells were pretreated by discharging to 0.001 V from open-circuit voltage (OCV) at a 100 mA g−1 current density and eventually charged to 3.0 V at the same current density. The cyclic voltammetry (CV) curves were recorded using an Ivium-Stat multichannel electrochemical workstation (Ivium-n-Stat.Xri, the Netherlands), with the voltage range of 3 to 0.001 V and a scan rate of 0.1 mV s−1. Electrochemical impedance spectroscopy (EIS) was also performed using an Ivium-Stat multichannel electrochemical workstation (Ivium-n-Stat.Xri, the Netherlands) with a frequency of 10−2–105 Hz and a voltage amplitude of 5 mV. The charge–discharge test including cycle and rate performance analysis was performed on a Neware battery test system (BTS-5V10 mA) in a voltage range of 3 to 0.01 V.
2.4 Preparation of electrode sheets and batteries
Batteries were assembled according to the following processes: PTCDA-Na powder or PTCDA-Na-G composite powder and Super P and poly(vinylidene fluoride) (PVDF) binder were mixed at a mass ratio of 6![[thin space (1/6-em)]](https://www.rsc.org/images/entities/char_2009.gif) :
:![[thin space (1/6-em)]](https://www.rsc.org/images/entities/char_2009.gif) 3
3![[thin space (1/6-em)]](https://www.rsc.org/images/entities/char_2009.gif) :
:![[thin space (1/6-em)]](https://www.rsc.org/images/entities/char_2009.gif) 1, and then 2 g of this mixture was added to 10 mL of N-methylpyrrolidone (NMP) and ball-milled until the slurry was uniform. The uniform slurry was coated on copper foil uniformly, and dried at 120 °C for an hour, and finally vacuum dried at 60 °C for 24 h. The film was cut into a circular piece of 1.2 cm diameter, and the actual loading amount of the active material was 0.81 mg and 1.04 mg for the PTCDA-Na and PTCDA-Na-G electrodes, respectively, with an areal mass loading of 0.72 and 0.92 mg cm−2. Then PTCDA-Na/Li and PTCDA-Na-G/Li half batteries, and PTCDA-Na/NCM-811 and PTCDA-Na-G/NCM-811 full batteries are assembled with lithium metal sheets as counter electrodes, and 1 M LiPF6 in a mixture of ethylene carbonate/diethyl carbonate/ethyl methyl carbonate (EC/DEC/EMC, 1
1, and then 2 g of this mixture was added to 10 mL of N-methylpyrrolidone (NMP) and ball-milled until the slurry was uniform. The uniform slurry was coated on copper foil uniformly, and dried at 120 °C for an hour, and finally vacuum dried at 60 °C for 24 h. The film was cut into a circular piece of 1.2 cm diameter, and the actual loading amount of the active material was 0.81 mg and 1.04 mg for the PTCDA-Na and PTCDA-Na-G electrodes, respectively, with an areal mass loading of 0.72 and 0.92 mg cm−2. Then PTCDA-Na/Li and PTCDA-Na-G/Li half batteries, and PTCDA-Na/NCM-811 and PTCDA-Na-G/NCM-811 full batteries are assembled with lithium metal sheets as counter electrodes, and 1 M LiPF6 in a mixture of ethylene carbonate/diethyl carbonate/ethyl methyl carbonate (EC/DEC/EMC, 1![[thin space (1/6-em)]](https://www.rsc.org/images/entities/char_2009.gif) :
:![[thin space (1/6-em)]](https://www.rsc.org/images/entities/char_2009.gif) 1
1![[thin space (1/6-em)]](https://www.rsc.org/images/entities/char_2009.gif) :
:![[thin space (1/6-em)]](https://www.rsc.org/images/entities/char_2009.gif) 1 by volume) as the electrolyte (purchased from Capchem Technology (Shenzhen) Co., Ltd.).
1 by volume) as the electrolyte (purchased from Capchem Technology (Shenzhen) Co., Ltd.).
3 Results and discussion
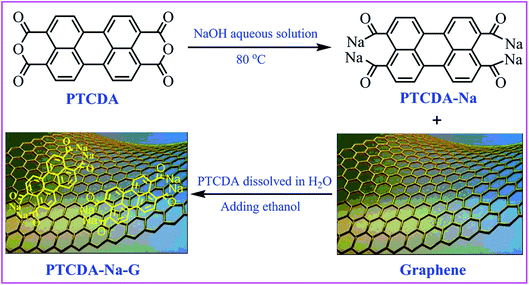
The PTCDA-Na and PTCDA-Na-G composites were prepared as shown in Scheme 1. A yellowish green transparent solution was obtained after PTCDA was fully hydrolyzed in NaOH aqueous solution, and the precipitate was produced after adding antisolvent ethanol to the solution, and then the yellow PTCDA-Na powder sample was obtained. Moreover, a certain amount of graphene was added to the saturated aqueous solution dissolved PTCDA-Na, and after vigorous stirring and ultrasonic dispersion, the antisolvent ethanol was added to the mixed solution. At this time, PTCDA-Na began to precipitate and adhere to the flake graphene surface, and the PTCDA-Na-G composite of graphene was obtained.For PTCDA compounds, there is a common problem with most small molecular organic compounds, that is, they will dissolve gradually in the electrolyte solution, which will cause the loss of active substances and eventually lead to the loss of capacity. After sodium salinization, the solubility of the PTCDA-Na sample in the electrolyte will be effectively inhibited. In order to investigate and verify this effect, the solubility of PTCDA and PTCDA-Na samples was compared. They were added to the electrolyte solvent (DMC![[thin space (1/6-em)]](https://www.rsc.org/images/entities/char_2009.gif) :
:![[thin space (1/6-em)]](https://www.rsc.org/images/entities/char_2009.gif) EMC
EMC![[thin space (1/6-em)]](https://www.rsc.org/images/entities/char_2009.gif) :
:![[thin space (1/6-em)]](https://www.rsc.org/images/entities/char_2009.gif) EC = 1
EC = 1![[thin space (1/6-em)]](https://www.rsc.org/images/entities/char_2009.gif) :
:![[thin space (1/6-em)]](https://www.rsc.org/images/entities/char_2009.gif) 1
1![[thin space (1/6-em)]](https://www.rsc.org/images/entities/char_2009.gif) :
:![[thin space (1/6-em)]](https://www.rsc.org/images/entities/char_2009.gif) 1) and expected to be prepared into a solution of 1 × 10⁻⁵ M, and their UV-Vis absorption spectra were tested, as shown in Fig. 1. As can be seen, even the newly prepared PTCDA solution shows obvious characteristic absorption peaks at 450–550 nm. However, for PTCDA-Na samples, even after 2 days of placement, the characteristic absorption peak was not observed, which fully demonstrates that sodium salinization effectively inhibits the dissolution of organic electrode materials in the electrolyte, which will be very beneficial to the improvement of PTCDA-Na electrode properties.
1) and expected to be prepared into a solution of 1 × 10⁻⁵ M, and their UV-Vis absorption spectra were tested, as shown in Fig. 1. As can be seen, even the newly prepared PTCDA solution shows obvious characteristic absorption peaks at 450–550 nm. However, for PTCDA-Na samples, even after 2 days of placement, the characteristic absorption peak was not observed, which fully demonstrates that sodium salinization effectively inhibits the dissolution of organic electrode materials in the electrolyte, which will be very beneficial to the improvement of PTCDA-Na electrode properties.
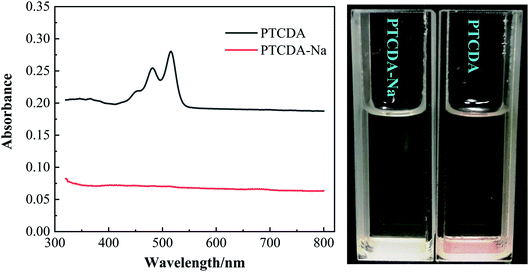 | ||
Fig. 1 UV-Vis spectra of PTCDA and PTCDA-Na composite samples (left) and their solution in electrolyte solvent (DMC![[thin space (1/6-em)]](https://www.rsc.org/images/entities/char_2009.gif) : :![[thin space (1/6-em)]](https://www.rsc.org/images/entities/char_2009.gif) EMC EMC![[thin space (1/6-em)]](https://www.rsc.org/images/entities/char_2009.gif) : :![[thin space (1/6-em)]](https://www.rsc.org/images/entities/char_2009.gif) EC = 1 EC = 1![[thin space (1/6-em)]](https://www.rsc.org/images/entities/char_2009.gif) : :![[thin space (1/6-em)]](https://www.rsc.org/images/entities/char_2009.gif) 1 1![[thin space (1/6-em)]](https://www.rsc.org/images/entities/char_2009.gif) : :![[thin space (1/6-em)]](https://www.rsc.org/images/entities/char_2009.gif) 1) with an expected concentration of 1 × 10⁻⁵ M. 1) with an expected concentration of 1 × 10⁻⁵ M. | ||
The morphology of the active material has a crucial effect on the performance of the electrode. To this end, the microstructure of the PTCDA-Na and PTCDA-Na-G samples was investigated, as shown in Fig. 2. Obviously, the PTCDA-Na sample is composed of flake particles with a thickness of about 50 nm, and the flake particles accumulate together to form a honeycomb porous microstructure (Fig. 2(a and b)), which would have a large specific surface area, and more active sites will be exposed and more capacity contributions will be produced. After compositing with graphene, for the PTCDA-Na-G sample, the flake PTCDA-Na active material is coated with a thin layer of graphene, and the PTCDA-Na particles are attached to the surface of graphene (Fig. 2(c and d)), which can effectively improve the dispersion degree and further enhance the exposure degree of the active point of the electrode material, and would be more conducive to improving the electrochemical performance.
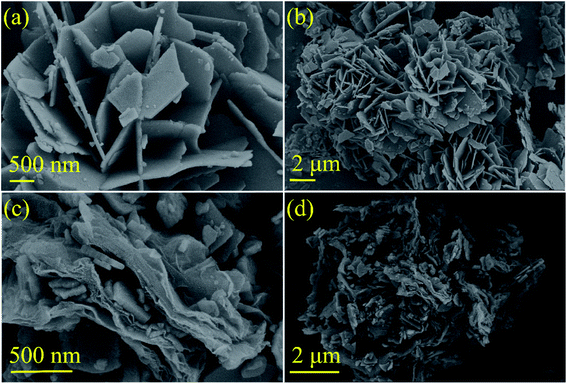 | ||
| Fig. 2 SEM images of PTCDA-Na and PTCDA-Na-G composite samples (a and b) PTCDA-Na; (c and d) PTCDA-Na-G. | ||
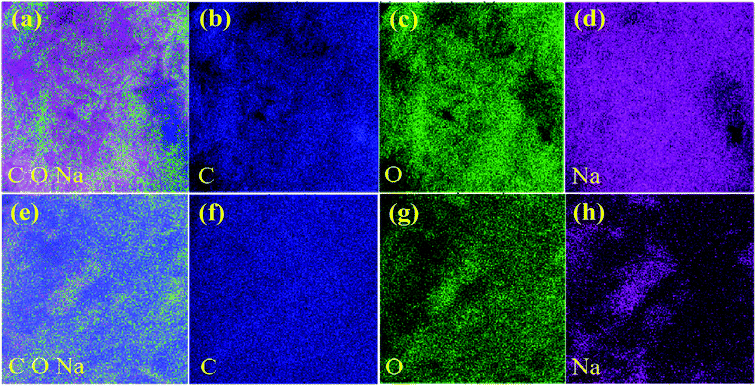
The EDS spectra were also investigated to further characterize the elemental composition of electrode materials. For the PTCDA-Na sample, the C, O and Na elements were clearly observed (Fig. 3(a–d)), and their distribution is relatively uniform. Meanwhile after compositing PTCDA-Na with graphene, with the increase of the composition of the C element, the blue color representing the C element in the total spectrum and the C element spectrum also deepens, while in the O and Na element spectra, the green color representing the O element and the purple color representing the Na element are slightly lighter (Fig. 3(e–h)), which fully confirms the recombination process of graphene.
A BET surface adsorption experiment was carried out, as shown in Fig. 4 and Table 1. For the PTCDA-Na sample, because of its porous and loose honeycomb structure (Fig. 3(a–d)), a large pore size of 53.17 nm, total pore volume of 0.5617 cm3 g−1 and specific surface area of 19.4 m2 g−1 are observed. However, after graphene compositing with PTCDA-Na, the PTCDA-Na-G sample presents a lager specific surface area of 112.4 m2 g−1 with a lower total pore volume of 0.2583 cm3 g−1 and small size of 19.99 nm, respectively. After graphene recombination, the pore size of the PTCDA-Na-G sample is decreased, and the specific surface area of the sample is significantly enhanced, which clearly indicates that the recombination of graphene can further increase the dispersion of PTCDA-Na active substances and expose more active sites. This will further improve the electrochemical performance of the electrode.
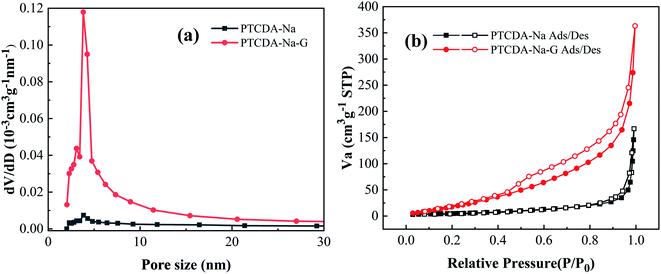 | ||
| Fig. 4 (a) Pore size distribution curves of PTCDA-Na and PTCDA-Na-G samples; (b) adsorption curves of PTCDA-Na and PTCDA-Na-G samples. | ||
| Samples | Specific surface area (m2 g−1) | Total pore volume (cm3 g−1) | Average pole diameter (nm) |
|---|---|---|---|
| PTCDA-Na | 19.4 | 0.5617 | 53.17 |
| PTCDA-Na-G | 112.4 | 0.2583 | 19.99 |
The symmetric and antisymmetric peaks of –COO– bonds in PTCDA-Na compounds can be clearly observed in the IR spectrum (Fig. 5(a)). After graphene recombination, there is no change of new organic functional groups and bonds, and the IR spectrum of PTCDA-Na-G composites has almost no change. XRD diffraction patterns show that the PTCDA-Na sample has good crystallinity (Fig. 5(a)), which is mainly determined by its regular morphology and ordered lamellar structure as shown in Fig. 2(a and b). Due to the disorder of graphene itself, in the process of recombination with graphene, the PTCDA-Na compound is attached to the graphene surface after precipitation, which naturally reduces the disorder degree of the PTCDA-Na-G sample. Therefore, the XRD diffraction peaks in Fig. 5(b) also indicate that the crystallization degree of the sample is obviously decreased and the disorder degree is increased, which can also be clearly observed from Fig. 2(c and d). Moreover, for the PTCDA-Na-G sample, in its XRD diffraction pattern, it can be obviously observed that the wide drum-wrapped peaks around 26° belongs to the characteristic diffraction peak of graphene, which indicates the existence of graphene.
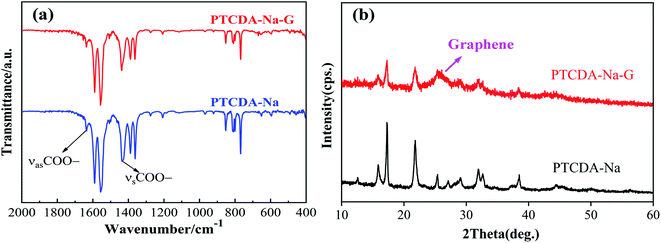 | ||
| Fig. 5 (a) IR spectra and (b) XRD diffraction patterns of PTCDA-Na and PTCDA-Na-G composite samples. | ||
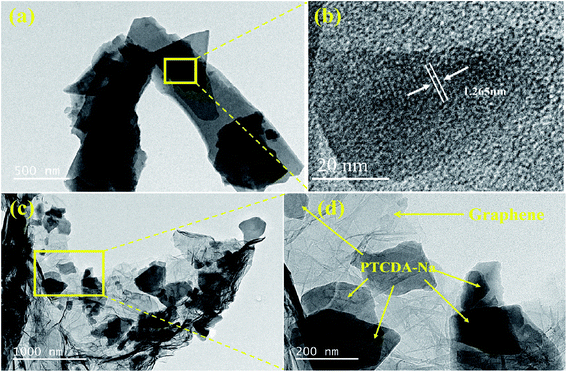
Changes in the morphology and structure before and after graphene recombination are also reflected in TEM images. As shown in Fig. 6(a and b), the lamellar PTCDA-Na particles piled together, and obvious lattice fringes were observed on the lamellar particle surface with a fringe spacing of 1.265 nm. Meanwhile in the PTCDA-Na-G sample, PTCDA-Na consists of mainly bulk particles, which are loosely bound on the surface of the graphene layer and no obvious lattice fringes are observed (Fig. 6(c and d)). The TEM image further indicates that PTCDA-Na samples have better order and crystallinity, while PTCDA-Na-G samples are more disordered.
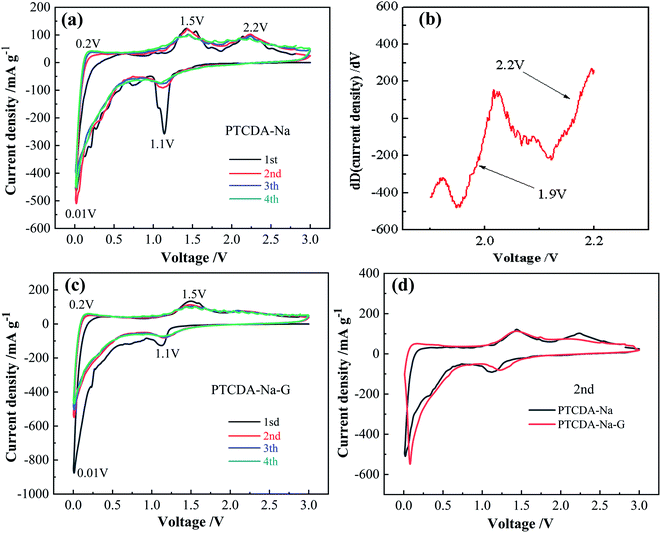
PTCDA-Na and PTCDA-Na-G electrodes were prepared and assembled into a Li-ion battery, and cyclic voltammetry (CV) was carried out from 0.001 to 3.0 V with a scan rate of 0.1 mV s−1. As shown in Fig. 7(a), PTCDA-Na shows three pairs of redox peaks at 2.2/1.9 V, 1.5/1.1 V and 0.2/0.01 V, which correspond to the lithium intercalation reaction of C![[double bond, length as m-dash]](https://www.rsc.org/images/entities/char_e001.gif) O and C
O and C![[double bond, length as m-dash]](https://www.rsc.org/images/entities/char_e001.gif) C functional groups in the PTCDA compound as well as interlayer spacing, respectively. Fig. 7(b) clearly shows that there is a weak ground peak at 1.9 V through differential analysis. The second CV curve has a good coincidence with the third, and their area decreases slightly compared with the first CV curve, which indicates that the PTCDA-Na electrode has smaller irreversible capacity and better cycling reversibility. After compositing with graphene, the PTCDA-Na-G sample mainly has a disordered amorphous structure, and the redox peak caused by the lithium intercalation process between layers becomes very weak; only two pairs of obvious redox peaks at 1.5/1.1 V and 0.2/0.01 V correspond to the lithium intercalation reaction of C
C functional groups in the PTCDA compound as well as interlayer spacing, respectively. Fig. 7(b) clearly shows that there is a weak ground peak at 1.9 V through differential analysis. The second CV curve has a good coincidence with the third, and their area decreases slightly compared with the first CV curve, which indicates that the PTCDA-Na electrode has smaller irreversible capacity and better cycling reversibility. After compositing with graphene, the PTCDA-Na-G sample mainly has a disordered amorphous structure, and the redox peak caused by the lithium intercalation process between layers becomes very weak; only two pairs of obvious redox peaks at 1.5/1.1 V and 0.2/0.01 V correspond to the lithium intercalation reaction of C![[double bond, length as m-dash]](https://www.rsc.org/images/entities/char_e001.gif) O, C
O, C![[double bond, length as m-dash]](https://www.rsc.org/images/entities/char_e001.gif) C functional groups as well as a disordered amorphous structure was observed for the PTCDA-Na-G electrode (Fig. 7(c)). Similarly, the second CV curve has a good coincidence degree with the third one, and compared with the first CV curve, the area decreases slightly, indicating that the PTCDA-Na-G electrode also has a small irreversible capacity loss and better cycling reversibility. From the TEM image in Fig. 6, it can be seen that the PTCDA-Na sample is mainly mixed with an ordered layered structure and a disordered unstructured structure, which determines that the oxidation reduction peak in its CV curve is derived from the ordered layered structure and the disordered unstructured structure, respectively. As a result, as shown in Fig. 7(a), the PTCDA-Na electrode shows three pairs of redox peaks which correspond to the lithium intercalation reaction of C
C functional groups as well as a disordered amorphous structure was observed for the PTCDA-Na-G electrode (Fig. 7(c)). Similarly, the second CV curve has a good coincidence degree with the third one, and compared with the first CV curve, the area decreases slightly, indicating that the PTCDA-Na-G electrode also has a small irreversible capacity loss and better cycling reversibility. From the TEM image in Fig. 6, it can be seen that the PTCDA-Na sample is mainly mixed with an ordered layered structure and a disordered unstructured structure, which determines that the oxidation reduction peak in its CV curve is derived from the ordered layered structure and the disordered unstructured structure, respectively. As a result, as shown in Fig. 7(a), the PTCDA-Na electrode shows three pairs of redox peaks which correspond to the lithium intercalation reaction of C![[double bond, length as m-dash]](https://www.rsc.org/images/entities/char_e001.gif) O and C
O and C![[double bond, length as m-dash]](https://www.rsc.org/images/entities/char_e001.gif) C functional groups in the PTCDA compound, interlayer spacing and disordered amorphous structure, respectively. However, for PTCDA-Na-G samples, no orderly layered structures were found, mainly consisting of rambling amorphous structures. As a result, the CV curve mainly has two main groups of oxidation reduction peaks, and no redox peaks at 2.2/1.9 V resulting from ordered layered structures were found. Fig. 7(d) shows that the area of the CV curve for the PTCDA-Na-G electrode is slightly larger than that of the CV curve for the PTCDA-Na electrode, indicating that graphene recombination will improve electrode capacity to some extent. This is mainly because the in situ recombination of graphene will increase the dispersion of PTCDA-Na active particles, improve the conductivity of the electrode, and finally expose more active sites.
C functional groups in the PTCDA compound, interlayer spacing and disordered amorphous structure, respectively. However, for PTCDA-Na-G samples, no orderly layered structures were found, mainly consisting of rambling amorphous structures. As a result, the CV curve mainly has two main groups of oxidation reduction peaks, and no redox peaks at 2.2/1.9 V resulting from ordered layered structures were found. Fig. 7(d) shows that the area of the CV curve for the PTCDA-Na-G electrode is slightly larger than that of the CV curve for the PTCDA-Na electrode, indicating that graphene recombination will improve electrode capacity to some extent. This is mainly because the in situ recombination of graphene will increase the dispersion of PTCDA-Na active particles, improve the conductivity of the electrode, and finally expose more active sites.
This conclusion can also be confirmed by the analysis of the EIS impedance spectra of the two electrodes, as shown in Fig. 8. It's obvious that after graphene recombination, the semicircle diameter in the high frequency region of the PTCDA-Na-G electrode decreases, and the slope of the straight line in the low frequency region increases obviously. After fitting, different impedance values are obtained, as listed in Table 2, where Rs reflects the transfer resistance of lithium ions in the electrolyte and the interface resistance caused by the SEI film double layer, Rct is the charge-transfer resistance during the electrochemical reaction process, and W1 represents the Warburg impedance concerning the diffusion of Li+ into the bulk electrode. After 3 cycles (Fig. 8(a)), the Rs, Rct and W1 of the PTCDA-Na-G electrode are 2.4, 62.8 and 0.0002 Ω, respectively, which are lower than those of the PTCDA-Na electrode (the Rs, Rct and W1 are 4.2, 71.9 and 23.8 Ω, respectively). The results show that the impedance of the PTCDA-Na-G electrode decreases obviously after graphene recombination, especially the Warburg impedance (W1) concerning the diffusion of Li+ into the bulk electrode, which would be beneficial to the performance of the electrode. After 100 cycles (Fig. 8(b)), the Rct of both the electrodes dropped significantly. Meanwhile, the W1−R of PTCDA-Na-G is still much smaller than that of the PTCDA-Na electrode.
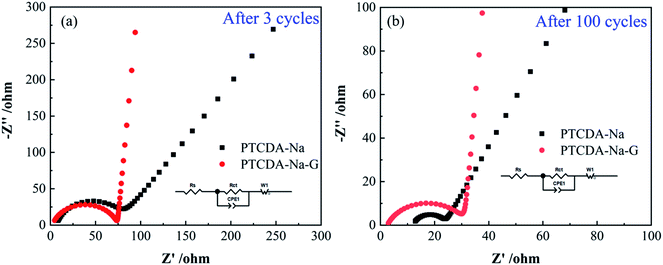 | ||
| Fig. 8 (a) EIS impedance of PTCDA-Na and PTCDA-Na-G electrodes after 3 cycles; (b) EIS impedance of PTCDA-Na and PTCDA-Na-G electrodes after 100 cycles. | ||
| Electrode | R S/Ω (error) | R ct/Ω (error) | W 1−R/Ω (error) |
|---|---|---|---|
| PTCDA-Na (3rd cycle) | 4.21 (67.7%) | 62.82 (21.2%) | 23.8 (202.3%) |
| PTCDA-Na-G (3rd cycle) | 2.42 (208.0%) | 71.98 (0.22%) | 0.0002 (7.71 × 10⁻⁶%) |
| PTCDA-Na (100th cycle) | 12.14 (1.52%) | 11.51 (2.32%) | 3.84 (7.28%) |
| PTCDA-Na-G (100th cycle) | 2.53 (2.02%) | 27.16 (11.36%) | 3.43 (254.59%) |
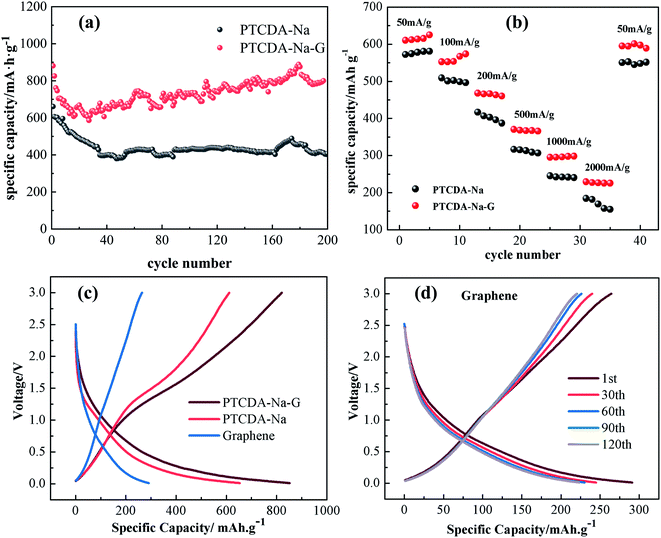
The charge/discharge behaviors of PTCDA-Na and PTCDA-Na-G electrodes were investigated as shown in Fig. 9. It is obvious that the PTCDA-Na-G electrode present superior cycle stability to the PTCDA-Na electrode. The initial charge capacity of the PTCDA-Na-G electrode is 890.5 mA h g−1; thereafter, the charging capacity decreased in the next 20 cycles. After 20 cycles, the charging capacity began to rise gradually, and the charging capacity remained at 840.0 mA h g−1 after 200 cycles with a capacity retention of 94.3%. The PTCDA-Na-G electrode has good stability and extremely high reversibility of electrochemical reactions. During the 200 cycles of the charge and discharge process, the coulombic efficiency of the electrode still remains above 98%. Meanwhile for the PTCDA-Na electrode, the initial charge capacity is 680.3 mA h g−1, which is much lower than that of the PTCDA-Na-G electrode (Fig. 9(a)). After 200 cycles, the capacity gradually decreases to 401.8 mA h g−1 with a capacity retention of 59.1%, which are also much lower than those of the PTCDA-Na-G electrode. After compositing with graphene, the rate capability is also obviously improved, as shown in Fig. 9(b). At different current densities, the PTCDA-Na-G electrode displays stable rate cycle performance, while for the PTCDA-Na electrode, the cycle capacities are very unstable, and display a declining trend at different current densities. The results indicate that the rate capacities of the PTCDA-Na-G electrode are much higher and more stable than those of the PTCDA-Na electrode, which clearly reflect that graphene plays very important roles in the performance improvement of PTCDA-Na molecules.
In addition, an investigation was made on the electrochemical performance of the graphene/Li battery in order to clarify the reasons for the improvement of PTCDA-Na active materials after compositing with graphene. As shown in Fig. 9(c), the initial charge capacity of the graphene electrode is 235 mA h g−1, which is much lower than that of the PTCDA-Na electrode (600 mA h g−1) and PTCDA-Na-G electrode (800 mA h g−1). Moreover, as the cycling progresses, the capacity of graphene decreases (Fig. 9(d)). The results show that graphene is not the main capacity contributor in PTCDA-Na-G composites, while the PTCDA-Na active material is the main capacity contributor. On the one hand, graphene can effectively improve the dispersion of PTCDA-Na active compounds and expose more active sites in PTCDA-Na-G composites. On the other hand, graphene with good conductivity can further enhance the conductivity of the composites, making the capacity of active compounds easier to show and effectively improving the rate cycling performance at a high current. On the one hand, graphene can effectively improve the dispersion of PTCDA-Na active compounds and expose more active sites in PTCDA-Na-G composites. On the other hand, graphene with good conductivity can further enhance the conductivity of the composites, making the capacity of active compounds easier to show and effectively improving the rate cycling performance at a high current. And that's why the PTCDA-Na-G electrode has better charge–discharge energy storage performance than the PTCDA-Na electrode. According to reported literature,44,45 annealing at a certain temperature can improve the performance of PTCDA, increase electrical conductivity, and reduce thermal decomposition.
In order to illustrate the advantage of PTCDA-Na electrodes, a systematic comparison between the performance of PTCDA-Na electrodes in this work and that of previously reported similar sodium carboxylate electrodes is provided as shown in Table 3. It can be seen that for large particles of sodium carboxylic acid active compounds,46 their initial capacities are relatively low, but as the cycling goes on, their capacities gradually increase. This is due to the gradual pulverization of the active substances during the cycle process, which exposes more active sites. Nevertheless, the PTCDA-Na active compounds investigated in this work are composed of porous honeycomb-like sheet-like particles with a larger specific surface area and more exposed active sites than previously published bulk sodium carboxylic acid salt active materials, resulting in a larger initial capacity of the PTCDA-Na electrode. After graphene recombination, the dispersion and conductivity of PTCDA-Na-G active substances are further improved, and more active sites are exposed, and larger initial capacity and better rate performance are displayed. As a result, PTCDA-Na with a honeycomb structure and its graphene composites prepared in this work exhibit superior electrochemical energy storage properties.
| Electrodes | Initial capacity (mA h g−1) | 200th capacity (mA h g−1) | Capacity retention | References |
|---|---|---|---|---|
| PTCDA-Na | 680.3 | 401.8 | 59.1% | In this work |
| PTCDA-Na-G | 890.5 | 840.0 | 94.3% | In this work |
| Sodium tartrate (ST) | 182.3 | 295.3 | 162% | 46 |
| Sodium pyromellitate (SP) | 182.4 | 246.1 | 135% | 46 |
| Sodium oxalate (SO) | 187.9 | 354.2 | 188% | 46 |
| Sodium citrate (SC) | 186.8 | 188.8 | 101% | 46 |
4 Conclusions
In this work, graphene composite 3,4,9,10-perylenetetracarboxylic sodium salts (PTCDA-Na-G) were prepared; after the PTCDA-Na active substances with a porous honeycomb structure are encapsulated by graphene, their dispersion and specific surface area are further effectively improved, so that more active sites are exposed. In addition, graphene with a thin layer structure further improves the conductivity of composite electrode materials. As a result, the electrochemical energy storage performance (such as initial capacity, cycle stability and rate capability) of the PTCDA-Na-G composite electrode is greatly improved. Furthermore, compared with previously reported sodium carboxylic acid salts (ST, SP, SO and SC) with a large size bulk structure, the PTCDA-Na with a porous honeycomb structure prepared in this work and especially its graphene complexes (PTCDA-Na-G) show superior electrochemical energy storage properties due to their large specific surface area, high dispersion, more exposed active sites and large electrical conductivity. Furthermore, compared with previously reported sodium carboxylic acid salt compounds with a large size bulk structure, the PTCDA-Na with a porous honeycomb structure prepared in this work and its graphene complexes show superior electrochemical energy storage properties due to their large specific surface area, high dispersion, more exposed active sites and large electrical conductivity. The strategy of sodium salinization of an organic compound and its graphene recombination technology will provide new ideas for the design of novel organic electrode materials with high performance for lithium-ion batteries.Conflicts of interest
There are no conflicts to declare.Acknowledgements
The work was supported by the National Natural Science Foundation of China (21762019), and the Natural Science Foundation of Jiangxi Province (20161BAB213082 and 20171BAB206017), the Program of Qingjiang Excellent Young Talents of Jiangxi University of Science and Technology (JXUSTQJBJ2019003), and the Guangdong YangFan Innovative & Entepreneurial Research Team Program (2016YT03N101).References
- Y. Lu, X. S. Hou, L. C. Miao, L. Li, R. J. Shi, L. J. Liu and J. Chen, Cyclohexanehexone with ultrahigh capacity as cathode materials for lithium-ion batteries, Angew. Chem., Int. Ed., 2019, 58, 7020–7024 CrossRef CAS PubMed.
- Y. T. Li, X. Chen, A. Dolocan, Z. M. Cui, S. Xin, L. G. Xue, H. H. Xu, K. Park and J. B. Goodenough, Garnet Electrolyte with an Ultralow Interfacial Resistance for Li-Metal Batteries, J. Am. Chem. Soc., 2018, 140, 6448–6455 CrossRef CAS PubMed.
- Y. Chen and C. Wang, Designing High Performance Organic Batteries, Acc. Chem. Res., 2020, 53, 2636 CrossRef CAS PubMed.
- Y. Lu and J. Chen, Prospects of organic electrode materials for practical lithium batteries, Nat. Rev. Chem., 2020, 4(3), 127–142 CrossRef CAS.
- C. Jiang, Q. Jia, M. Tang, K. Fan, Y. Chen, M. Sun, S. Xu, Y. Wu, C. Zhang, J. Ma, C. Wang and W. Hu, Regulating the Solvation Sheath of Li Ions by Hydrogen Bonds for Highly Stable Lithium-Metal Anodes, Angew. Chem., Int. Ed., 2021, 60, 10871–10879 CrossRef CAS PubMed.
- J. Chen, Y. Xu, M. H. Cao, C. J. Zhu, X. L. Liu, Y. T. Li and S. W. Zhong, A Stable 2D Nano-Columnar Sandwich Layered Phthalocyanine Negative Electrode for Lithium-Ion Batteries, J. Power Sources, 2019, 426, 169–177 CrossRef CAS.
- Y. G. Sun, J. Tang, K. Zhang, J. S. Yuan, J. Li, D.-M. Zhu, K. Ozawa and L.-C. Qin, Comparison of reduction products from graphite oxide and graphene oxide for anode applications in lithium-ion batteries and sodium-ion batteries, Nanoscale, 2017, 9, 2585–2595 RSC.
- X. H. Gong, J. Zheng, Y. B. Zheng, S. P. Cao, H. Wen, B. P. Lin and Y. M. Sun, Succinimide-modified graphite as anode materials for lithium-ion batteries, Electrochim. Acta, 2020, 356, 136858 CrossRef CAS.
- L. Mai, J. Sheng, L. Xu, S. Tan and J. Meng, One-Dimensional Hetero-Nanostructures for Rechargeable Batteries, Acc. Chem. Res., 2018, 51, 950–959 CrossRef CAS PubMed.
- W. L. Lin, Y. Huang, L. H. Guan, X. Y. Huang, L. Li, K.-Z. Du and X. H. Wu, Chalcogen-doped red phosphorus nanoparticles@porous carbon as high-rate and ultrastable anode for lithium-ion batteries, Carbon, 2020, 170, 85–92 CrossRef CAS.
- G. Song, H. B. Son, D.-Y. Han, M. Je, S. Nam and S. Park, A renewable future: a comprehensive perspective from materials to systems for next-generation batteries, Mater. Chem. Front., 2021, 5, 3344–3377 RSC.
- J. He, Y. Q. Wei, T. Y. Zhai and H. Q. Li, Antimony-based materials as promising anodes for rechargeable lithium-ion and sodium-ion batteries, Mater. Chem. Front., 2018, 2, 437–455 RSC.
- X. H. Gong, J. Zheng, Y. B. Zheng, S. P. Cao, H. Wen, B. P. Lin and Y. M. Sun, Succinimide-modified graphite as anode materials for lithium-ion batteries, Electrochim. Acta, 2020, 356, 136858 CrossRef CAS.
- N. W. Ding, Y. Chen, R. Li, J. Chen, C. X. Wang, Z. F. Li and S. W. Zhong, Pomegranate structured C@pSi/rGO composite as high performance anode materials of lithium-ion batteries, Electrochim. Acta, 2021, 367, 137491 CrossRef CAS.
- Y. Huang, Z. Xu, J. Mai, T.-K. Lau, X. Lu, Y.-J. Hsu, Y. Chen, A. C. Lee, Y. Hou, Y. S. Meng and Q. Li, Revisiting the origin of cycling enhanced capacity of Fe3O4 based nanostructured electrode for lithium ion batteries, Nano Energy, 2017, 41, 426–433 CrossRef CAS.
- M. Tang, S. Zhu, Z. Liu, C. Jiang, Y. Wu, H. Li, B. Wang, E. Wang, J. Ma and C. Wang, Tailoring pi-Conjugated Systems: From pi-pi Stacking to High-Rate-Performance Organic Cathodes, Chem, 2018, 4, 2600–2614 CAS.
- Z. C. Xu, S. X. Hou, Z. Y. Zhu, P. F. Zhou, L. Xue, H. T. Lin, J. Zhou and S. P. Zhuo, Functional thiophene-diketopyrrolopyrrole-based polymer derivatives as organic anode materials for lithium-ion batteries, Nanoscale, 2021, 13, 2673–2684 RSC.
- L. Zhou, K. Zhang, Z. Hu, Z. Tao, L. Mai, Y.-M. Kang, S.-L. Chou and J. Chen, Recent Developments on and Prospects for Electrode Materials with Hierarchical Structures for Lithium-Ion Batteries, Adv. Energy Mater., 2018, 8, 1701415 CrossRef.
- L. X. Zhang, Z. H. Liu, G. L. Cui and L. Q. Chen, Biomass-derived materials for electrochemical energy storages, Prog. Polym. Sci., 2015, 43, 136–164 CrossRef CAS.
- Y. Liang, P. Zhang, S. Yang, Z. Tao and J. Chen, Fused Heteroaromatic Organic Compounds for High-Power Electrodes of Rechargeable Lithium Batteries, Adv. Energy Mater., 2013, 3, 600–605 CrossRef CAS.
- Z. L. Wang, Y. J. Li, P. J. Liu, Q. Y. Qi, F. Zhang, G. L. Lu, X. Zhao and X. Y. Huang, Few layer covalent organic frameworks with graphene sheets as cathode materials for lithium-ion batteries, Nanoscale, 2019, 11, 5330–5335 RSC.
- Z. P. Song, Y. M. Qian, T. Zhang, M. Otani and H. S. Zhou, Poly (benzoquinonyl sulfide) as a High-Energy Organic Cathode for Rechargeable Li and Na Batteries, Adv. Sci., 2015, 2, 1500124 CrossRef PubMed.
- K. Rana, S. D. Kim and J. H. Ahn, Additive-free thick graphene film as an anode material for flexible lithium-ion batteries, Nanoscale, 2015, 7, 7065–7071 RSC.
- D. M. Cui, D. Tian, S. S. Chen and L. J. Yuan, Graphene wrapped 3,4,9,10-perylene- tetracarboxylic dianhydride as a high-performance organic cathode for lithium ion batteries, J. Mater. Chem. A, 2016, 4, 9177–9183 RSC.
- B. Häupler, A. Wild and U. S. Schubert, Carbonyls: Powerful Organic Materials for Secondary Batteries, Adv. Energy Mater., 2015, 5, 1402034 CrossRef.
- Q. Zhao, Z. Q. Zhu and J. Chen, Molecular Engineering with Organic Carbonyl Electrode Materials for Advanced Stationary and Redox Flow Rechargeable Batteries, Adv. Mater., 2017, 29, 1607007 CrossRef PubMed.
- C. Luo, R. M. Huang, R. Kevorkyants, M. Pavanello, H. X. He and C. S. Wang, Self-Assembled Organic Nanowires for High Power Density Lithium, Nano Lett., 2014, 14, 1596–1602 CrossRef CAS PubMed.
- H. P. Wu, Q. Yang, Q. H. Meng, A. Ahamad, M. Zhang, L. Y. Zhu, Y. G. Liu and Z. X. Wei, Polyimide derivative containing different carbonyl groups for flexible lithium ion batteries, J. Mater. Chem. A, 2016, 4, 2115–2121 RSC.
- C. Peng, G. H. Ning, J. Su, G. Zhong, W. Tang, B. Tian and K. P. Loh, Reversible multi-electron redox chemistry of π-conjugated N-containing heteroaromatic molecule-based organic cathodes, Nat. Energy, 2017, 2(7), 1–9 Search PubMed.
- Y. Liang, P. Zhang and J. Chen, Function-oriented design of conjugated carbonyl compound electrodes for high energy lithium batteries, Chem. Sci., 2013, 4, 1330–1337 RSC.
- Z. Song, Y. Qian, T. Zhang, M. Otani and H. Zhou, Poly(benzoquinonyl sulfide) as a High-Energy Organic Cathode for Rechargeable Li and Na Batteries, Adv. Sci., 2015, 2, 1500124 CrossRef PubMed.
- J. Chen, Q. Zhang, M. Zeng, N. W. Ding, Z. F. Li and S. W. Zhong, Carboxyl conjugated phthalocyanines used as novel electrode materials with high specific capacity for lithium-ion batteries, J. Solid State Electrochem., 2016, 20, 1285–1294 CrossRef CAS.
- W. Zhang, J. Wang, L. Bao, Z. Cao and J. Yu, Nanopores created by carbon onion conductive agent providing enhanced capacitance in supercapacitors, Diamond Relat. Mater., 2019, 96, 231–236 CrossRef CAS.
- P. Bu, S. Liu, Y. Lu, S. Zhang, H. Wang and F. Tu, Effects of Carbon Black on the Electrochemical Performance of Lithium-Organic Coordination Compound Batteries, Int. J. Electrochem. Sci., 2012, 7, 4617–4624 CAS.
- G. Qu, J. Tan, H. Wu, Z. Yu, S. Zhang, G. Liu and C. Su, Synergistic Effect of Salinized Quinone for Entrapment of Polysulfides for High-Performance Li–S Batteries, ACS Appl. Mater. Interfaces, 2020, 12(21), 23867–23873 CrossRef CAS PubMed.
- B. Tian, G. H. Ning, W. Tang, C. Peng, D. Yu, Z. Chen and K. P. Loh, Polyquinoneimines for lithium storage: more than the sum of its parts, Mater. Horiz., 2016, 3(5), 429–433 RSC.
- L. Zhao, W.-K. Wang, A.-B. Wang, Z.-B. Yu, S. Chen and Y.-S. Yang, A MC/AQ Parasitic Composite as Cathode Material for Lithium Battery, J. Electrochem. Soc., 2011, 158, A991–A996 CrossRef CAS.
- P. Bu, S. Q. Liu and Y. Lu, Effects of carbon back on the electrochemical performance of lithium-organic coordination compound batteries, Int. J. Electrochem. Sci., 2012, 7, 4617–4624 CAS.
- C. Luo, R. M. Huang, R. Kevorkyants, M. Pavanello, H. X. He and C. S. Wang, Self-Assembled Organic Nanowires for High Power Density Lithium, Nano Lett., 2014, 14, 1596–1602 CrossRef CAS PubMed.
- S. W. Wang, L. J. Wang, K. Zhang, Z. Q. Zhu, Z. L. Tao and J. Chen, Organic Li4C8H2O6 Nanosheets for Lithium-Ion Batteries, Nano Lett., 2013, 13, 4404–4409 CrossRef CAS PubMed.
- Z. P. Song, H. Zhan and Y. H. Zhou, Polyimides: Promising Energy-Storage Materials, Angew. Chem., Int. Ed., 2010, 49, 8444–8448 CrossRef CAS PubMed.
- T. Nokami, T. Matsuo, Y. Inatomi, N. Hojo, T. Tsukagoshi, H. Yoshizawa, A. Shimizu, H. Kuramoto, K. Komae, H. Tsuyama and J.-I. Yoshida, Polymer-Bound Pyrene-4,5,9,10-tetraone for Fast-Charge and -Discharge Lithium-Ion Batteries with High Capacity, J. Am. Chem. Soc., 2012, 134, 19694–19700 CrossRef CAS PubMed.
- P. Hu, H. Wang, Y. Yang, J. Yang, J. Lin and L. Guo, Renewable-Biomolecule-Based Full Lithium-Ion Batteries, Adv. Mater., 2016, 28, 3486–3492 CrossRef CAS PubMed.
- M. Q. Sun, H. Li, J. Wang and G. H. Wang, Promising graphene/carbon nanotube foam@p-conjugated polymer self-supporting composite cathodes for high-performance rechargeable lithium batteries, Carbon, 2015, 94, 864–871 CrossRef CAS.
- S. Liu, J. Mao and L. Zhang, et al., Manipulating the Solvation Structure of Nonflammable Electrolyte and Interface to Enable Unprecedented Stability of Graphite Anodes beyond 2 Years for Safe Potassium-Ion Batteries, Adv. Mater., 2021, 33, 2006313 CrossRef CAS PubMed.
- Y. Xu, J. Chen, C. Zhu, P. Zhang, G. Jiang, C. Wang, Q. Zhang, N. Ding, Y. Huang and S. Zhong, High-performance of sodium carboxylate-derived materials for electrochemical energy storage, Sci. China Mater., 2018, 61, 707–718 CrossRef CAS.
Footnote |
| † Co-first author. |
| This journal is © The Royal Society of Chemistry 2021 |

