 Open Access Article
Creative Commons Attribution 3.0 Unported Licence
Surface basicity mediated rapid and selective adsorptive removal of Congo red over nanocrystalline mesoporous CeO2†
Deepak
Joshy
a,
Seena
Chakko
a,
Yahya A.
Ismail
 a and
Pradeepan
Periyat
 *ab
*ab
aDepartment of Chemistry, University of Calicut, Kerala, India 673635. E-mail: pperiyat@uoc.ac.in
bDepartment of Environmental Studies, Kannur University, Kerala, India. E-mail: pperiyat@kannuruniv.ac.in
First published on 21st September 2021
Abstract
Herein we first report surface basicity mediated rapid and selective adsorptive removal of organic pollutants over nanocrystalline mesoporous CeO2. The role of surface features in controlling the selectivity and efficiency of adsorption is well known. Nevertheless, the possibility of tuning the adsorption capacity and selectivity of adsorbents through their surface characteristics remains less explored. In this work, the surface basicity of mesoporous CeO2 nanoparticles was improved by Er3+ doping under two different reaction conditions: via sol–gel and sol–hydrothermal methods. The nature and amount of surface basic sites were determined with the help of CO2 temperature programmed desorption (TPD). The adsorption capacity and selectivity of four different CeO2 samples were investigated using Congo red, methyl orange, and methylene blue as the model pollutants. From the adsorption studies, Er3+ doped CeO2 synthesized by the sol–gel method, having the highest amount of surface basic sites, proved to be the most efficient and highly selective adsorbent among the four developed variants of CeO2 towards Congo red. According to the proposed mechanism, surface basicity can be employed as a controlling parameter capable of tuning the adsorption capacity as well as the selectivity of CeO2 towards organic pollutants.
Introduction
CeO2 is one of the most widely employed semiconducting metal oxides in the field of catalysis and environmental remediation,1–5 mainly due to (i) its high abundance and low cost,6 (ii) wide band-gap, non-toxicity and high stability,7 (iii) tendency for oxygen uptake into the lattice and the possibility of a reversible transition redox system between Ce3+ and Ce4+ (ref. 8 and 9) and (iv) the chance of formation of solid solutions with other oxides.6 CeO2 has already emerged as a promising choice for a wide range of catalytic processes such as a promoter in three-way catalysts in automobiles,10,11 solid oxide fuel cells,12,13 reforming of hydrocarbons,14–16 water gas shift reaction,17–19 CO oxidation,20–22 catalytic combustion of volatile organic compounds (VOC's),23–26 hydrogenation of alkynes,27,28 syngas conversion to alcohols,29 thermochemical water splitting,30,31 photocatalysis32–34etc. Nevertheless, efforts to further improve its catalytic efficiency are still in progress.35 Besides this, the environmental remediation applications of CeO2 mainly include photocatalytic degradation36,37 and adsorptive removal of pollutants from water resources.38,39Textile and dyestuff industries are some of the major sources of water pollution, as they release dye species into water resources. The total world production of dyes is around 700![[thin space (1/6-em)]](https://www.rsc.org/images/entities/char_2009.gif) 000 tonnes annually. About 10–15% of these dyes are lost during their application and a major share is discharged into water bodies. Many of these dyes have a very complex chemical structure and are found to be non-biodegradable. Studies have revealed that many of these dyes are carcinogenic and mutagenic in nature. In addition, the dyes may be present in different forms in different aqueous environments. In such cases we should be able to tune our remediation techniques according to the requirements of the target dye molecules. For example, Congo red is such a widely employed benzidine-based azo dye for various applications such as in textile, printing, plastic, rubber and dyeing industries. Due to its high water solubility, Congo red can disperse easily in water resources. Also depending on pH, Congo red is capable of being present in different ionic forms in water. Such a malign and widely distributed water pollutant should be treated individually by highly efficient means.40–42 Adsorptive removal is one such effective way to remove organic pollutants. While developing the adsorbent material, we have focused on Congo red as our target pollutant.
000 tonnes annually. About 10–15% of these dyes are lost during their application and a major share is discharged into water bodies. Many of these dyes have a very complex chemical structure and are found to be non-biodegradable. Studies have revealed that many of these dyes are carcinogenic and mutagenic in nature. In addition, the dyes may be present in different forms in different aqueous environments. In such cases we should be able to tune our remediation techniques according to the requirements of the target dye molecules. For example, Congo red is such a widely employed benzidine-based azo dye for various applications such as in textile, printing, plastic, rubber and dyeing industries. Due to its high water solubility, Congo red can disperse easily in water resources. Also depending on pH, Congo red is capable of being present in different ionic forms in water. Such a malign and widely distributed water pollutant should be treated individually by highly efficient means.40–42 Adsorptive removal is one such effective way to remove organic pollutants. While developing the adsorbent material, we have focused on Congo red as our target pollutant.
The adsorption capacity and selectivity of an adsorbent depend on several factors such as high surface area, porosity, amount of surface active sites, pH, electrostatic interaction between the adsorbent surface and dye species, and weak interactions such as hydrogen bonding between the adsorbent and dye molecules.43,44 The adsorption capacity and selectivity of adsorbents can be controlled by the effective tuning of the above factors particularly by regulating surface features. Hence in this study, we targeted the tailoring of the surface features of the adsorbent according to the requirement of the pollutant.
The present work aims at understanding, analysing and correlating the surface characteristics of CeO2 with its adsorption capacity and selectivity towards Congo red. The surface characteristics under investigation are surface area, porosity, surface basicity and hydrogen bonding. Variations in surface characteristics were brought by doping Er3+ into the CeO2 lattice under two different reaction conditions: via sol–gel and sol–hydrothermal methods. Er3+ doping succeeded in improving surface features such as surface area, porosity, surface basicity and thereby the weak interactions between the CeO2 surface and Congo red molecules. The effect of improved surface features was then correlated with the adsorption ability of CeO2. In this work, surface features of CeO2 were tuned to develop highly efficient and selective adsorbents for Congo red adsorption and removal. This work aims at maximizing the adsorption efficiency and selectivity of CeO2 with minimum modifications. This work will prompt future investigators to see adsorption, also from the perspective of surface basicity.
Experimental
Material preparation
Pure CeO2 and Er3+ doped CeO2 were synthesized by two separate synthetic routes via sol–hydrothermal and aqueous sol–gel methods. 43.2 g of Ce(NO3)3·6H2O (99%, Aldrich) was stirred in 500 mL distilled water for half an hour to ensure complete dissolution. NH4OH (Merck Emplura, 25%) solution was then added dropwise to precipitate cerium(IV) hydroxide. The addition of NH4OH was continued until the pH reached a value of 10 to ensure that all Ce(NO3)3·6H2O had been precipitated as Ce(OH)4. The precipitate of Ce(OH)4 was centrifuged and washed several times with distilled water. To confirm the absence of nitrate in the precipitate, concentrated H2SO4 was added to the centrifugate and the resulting solution was boiled. In this solution, a paper ball was dropped, and the absence of brown fumes indicated that the centrifugate was nitrate-free. After achieving the nitrate-free centrifugate, the precipitate was then dispersed in 1000 mL distilled water; to this, 10% HCl (Emplura Merck, 35%) was added dropwise until the pH value reached 2. The solution was then kept under stirring for 2 days to obtain the sol. The sol was then divided into two portions. The first portion was used for the synthesis of CeO2via the hydrothermal method. For this, the sol was transferred to a Teflon lined stainless steel autoclave and heated at 150 °C for 48 hours. The components in the autoclave were then transferred to a Petri dish and were dried in an oven set at 150 °C for 2 days to obtain hydrothermally synthesised CeO2 (CeO2-HT). The second portion of the sol was used for the synthesis of CeO2 by the aqueous sol–gel method. The sol was dried directly in an oven set at 150 °C for 48 hours. The dried precursor was then calcined at 500 °C for 2 hours and the compound thus obtained is represented as CeO2-Sol. The Er3+ doped CeO2 sol was prepared by the same procedure by adding a calculated quantity (5 mmol) of Er(NO3)3·5H2O to 100 mmol CeO2 sol. The Er3+ doped sol was subjected to both hydrothermal and sol–gel methods to obtain CEr-HT and CEr-Sol samples.Characterisation of materials
The phase purity and crystal structure of the synthesised samples were determined by powder X-ray diffraction (PXRD) on a Rigaku Miniflex 600 X-ray diffractometer. The crystallite size of the synthesised compounds was calculated from the PXRD pattern using the Scherrer equation. The surface characterisation and morphology evaluation were carried out using a ZEISS Gemini SEM 300. HR-TEM analysis was performed using a Jeol-JEM 2100 transmission electron microscope. Fourier transform infrared (FTIR) spectra measurements were carried out using a Jasco-FT/IR-4100 spectrophotometer. The Brunauer–Emmett–Teller (BET) surface area of the samples was calculated by N2 adsorption at the temperature of liquid nitrogen using a Belsorp Max surface area analyser. Prior to the measurements, the samples were degassed at 200 °C under vacuum for 3 hours to remove the adsorbed moisture on the catalyst surface. The specific surface area was calculated using the BET model at a relative pressure of P/P0 = 0.05–0.3.Basicity measurements using temperature programmed desorption (TPD)
CO2-temperature programmed desorption (TPD) studies were carried out using a BELCAT-M analyser. For this, 0.1 g of the prepared sample was weighed into a quartz tube sample holder and then subjected to pre-treatment at 200 °C for 30 minutes under a He atmosphere. The sample was then cooled to room temperature and then CO2 was passed over the sample for 30 minutes to carry out adsorption. Then it was followed by He purging for another 30 minutes at 50 °C for the removal of physisorbed CO2 from the sample surface. The desorption measurements were performed by increasing the temperature from 50 °C to 650 °C at a heating rate of 12 K min−1. The amounts of different types of basic sites were calculated by integrating the CO2-TPD curves over different temperature ranges of desorption corresponding to very weak, weak, medium and strong basic sites.Adsorption experiments
Adsorption studies were carried out on all four synthesized CeO2 samples (1 g L−1) using Congo red as the model pollutant at a concentration of 20 mg L−1. The adsorption experiments were carried out in magnetically stirred glass vessels at the ambient pH of the Congo red solution. At regular contact intervals, samples were withdrawn, centrifuged and analysed using a Jasco V-770 UV-vis-NIR spectrophotometer. To evaluate the selectivity, adsorption analyses were performed with methylene blue and methyl orange also. The effect of dye concentration and pH on adsorption activity was evaluated by varying the initial dye concentrations (10, 15, 20, 25 and 30 mg L−1) and by carrying out adsorption studies under 3 different pH conditions (3, 6.5 (ambient pH) and 10). Besides this, the pH of the point of zero charge (pHPZC) of the adsorbent material was determined using the pH drift method.45Adsorbent regeneration and reusability
After the adsorption process, the Congo red adsorbed CeO2 samples were collected and washed several times with distilled water. Then the samples were dried and calcined at 500 °C for 2 hours. The adsorption efficiency of the recycled adsorbents was also determined.Results and discussion
Pure CeO2 and Er3+ doped CeO2 were synthesised via hydrothermal and aqueous sol–gel methods. The PXRD patterns of all the samples synthesised are shown in Fig. 1. As shown in Fig. 1, well-defined peaks are obtained for all samples.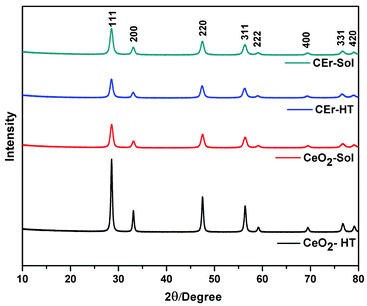 | ||
| Fig. 1 X-ray diffraction patterns of pure CeO2 and Er3+ doped CeO2 samples prepared by aqueous sol–gel and hydrothermal methods. | ||
The peaks can be indexed to the cubic fluorite structure of CeO2 (JCPDS 34-0394) belonging to the Fm3m space group.7 Characteristic reflections of the (111), (200), (220), (311), (222) and (400) planes are shown in Fig. 1. A small shift in the peaks towards lower 2θ for Er3+ doped samples was observed in the PXRD pattern, and this can be attributed to the increased ionic size of Er3+ compared to that of Ce4+ (ionic radius of Ce = 97 pm; Er = 100.4 pm).
The crystallite sizes of the synthesised samples determined from the Scherrer equation are reported in Table 1. From the crystallite size values, it is evident that CeO2-HT has the largest crystallite size compared to other samples. This is due to the enhanced Ostwald ripening and oriented attachment in hydrothermally synthesised samples.46 However, in the case of CEr-HT, a reduction in the crystallite size was observed which may be due to the inhibition of crystal growth caused by the dopant Er3+. The presence of Er3+ in between the Ce4+ ions has a significant role in decreasing the frequency of collisions between the ceria particles. As the collisions decrease, the oriented attachment and Ostwald ripening rate diminish, resulting in a smaller crystallite size. At the same time, crystal growth takes place in a normal manner in the case of CeO2-Sol and CEr-Sol where strict conditions of pressure and temperature are absent. Thus, the crystal growth conditions are almost the same for CeO2-Sol and CEr-Sol.
| Samples | Crystallite size (nm) |
|---|---|
| CeO2-HT | 19.48 |
| CeO2-Sol | 10.74 |
| CEr-HT | 10.69 |
| CEr-Sol | 11.11 |
The field emission scanning electron microscopy (FESEM) micrographs of the synthesized samples are shown in Fig. 2. An idea about the surface morphology and extent of agglomeration can be obtained from the FESEM images. The SEM images of CeO2-HT show large-sized aggregates, distinct from one another. At the same time, CEr-HT exhibits a porous flake like structure. The SEM images of pure CeO2 and Er3+ doped CeO2 particles synthesised via the sol–gel method indicate that CEr-sol exhibits a highly porous appearance and relatively small agglomerates when compared to CeO2-Sol.
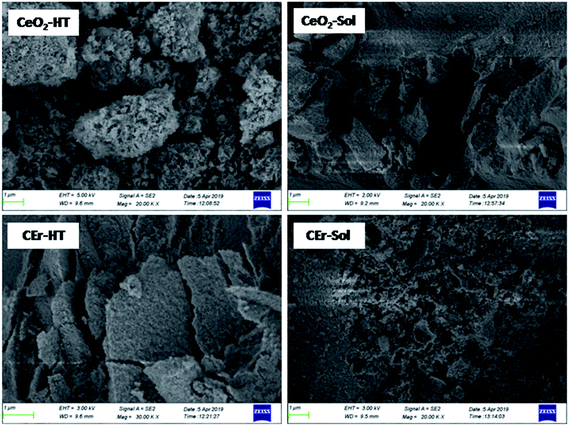 | ||
| Fig. 2 FESEM micrographs of pure CeO2 and Er3+ doped CeO2 samples prepared by sol–gel and hydrothermal methods. | ||
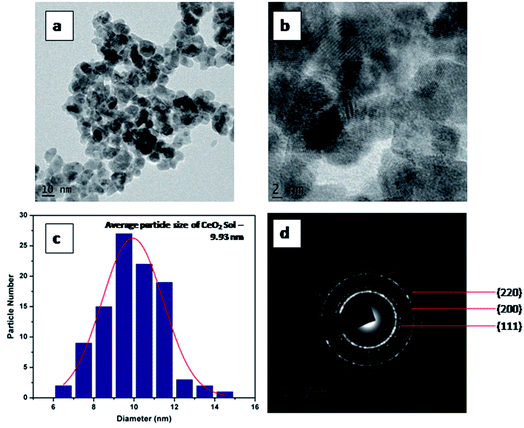
HR-TEM analyses of CeO2-Sol and CEr-Sol were performed to further confirm the trend observed in crystallite sizes. HR-TEM images of CeO2-sol are shown in Fig. 3. The average particle size was found to be 9.93 nm. The SAED patterns can be indexed to (111), (200) and (220) planes. The calculated d spacing for the (111) plane is 3.14 Å in CeO2-Sol.
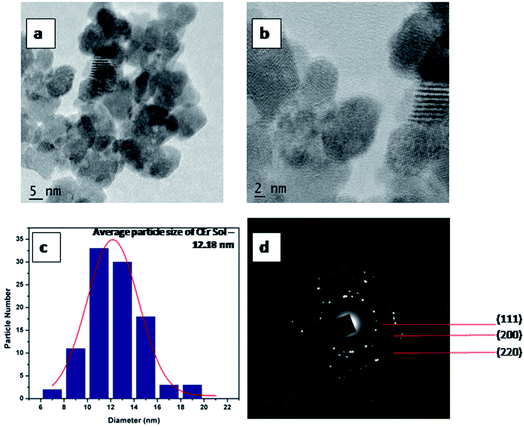
HR-TEM images of CEr-Sol are shown in Fig. 4. In this case, the average particle size was found to be 12.18 nm. Here the calculated d spacing for the (111) plane is 3.20 Å which is greater than that observed in CeO2-Sol. This can be attributed to the doping of relatively large Er3+ ions into the CeO2 lattice. The well defined fringes in Fig. 3b and 4b show the mesoporous nature of the prepared CeO2 and it is also well evident from the pore size obtained from the BET measurements.
The N2 adsorption isotherms of the synthesised samples are shown in Fig. 5. Parameters such as surface area, pore volume and pore diameters of the synthesised samples were analysed using the BET technique and are tabulated in Table 2. The Er3+ doped CeO2 samples were found to have a higher surface area than pure CeO2. Among the samples synthesised, the sol–gel derived samples exhibited higher surface areas than their hydrothermal analogues. In the case of hydrothermally synthesized samples, CEr-HT exhibited almost double the surface area of CeO2-HT. This can be partly correlated to the larger crystallite size of CeO2-HT particles which may result in a decrease of the surface area. The additional enhancement in surface areas of the Er3+ doped samples can be the result of the generated oxygen vacancies and the enriched interconnected pore networks present in them. All the samples synthesised were mesoporous in nature as evident from their pore size which lies in the range of 4–14 nm.47 The mesoporous nature is also evident from the fact that all the samples exhibit type IV adsorption isotherms.48 According to the IUPAC classification of adsorption hysteresis loops, the loops of CeO2-Sol, CEr-Sol and CEr-HT belong to type H2,49 which arises from porous materials having networks of interconnected pores of progressive sizes and shapes. At the same time, CeO2-HT exhibits a type H3 adsorption hysteresis loop which is characteristic of materials with slit-shaped pores.50
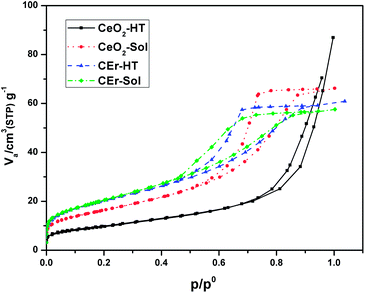 | ||
| Fig. 5 N2 adsorption isotherms of pure and Er3+ doped CeO2 samples prepared by aqueous sol–gel and hydrothermal methods. | ||
| Samples | BET surface area (m2 g−1) | Total pore volume (cm3 g−1) | Pore diameter (nm) |
|---|---|---|---|
| CeO2-HT | 35.114 | 0.1278 | 14.563 |
| CeO2-Sol | 58.769 | 0.102 | 6.9446 |
| CEr-HT | 72.073 | 0.0929 | 5.1561 |
| CEr-Sol | 73.668 | 0.0888 | 4.8198 |
Here we have recorded the FT-IR spectra of all the CeO2 samples prepared and the spectra are shown in Fig. 6. In the FT-IR spectra, the broad absorption band within the range of 3400–3450 cm−1 corresponds to the OH stretching vibrations of adsorbed H2O on the sample surfaces.51 Again the transmission bands at 1380 and 1625 cm−1 correspond to the H–O–H bending mode which confirms the presence of adsorbed moisture and surface hydroxyls in the samples. Thus FT-IR measurements indicated the presence of adsorbed water molecules on the CeO2 surfaces. The role of adsorbed water in the selective adsorption of Congo red by CeO2 will be discussed later. The absorption bands at 450 cm−1 and 850 cm−1 correspond to characteristic Ce–O stretching vibrations. So the observed IR absorption frequencies are in good agreement with previous literature.52,53 Another species of strong band is located around 1000 cm−1, which may be associated with the formation of nano-crystalline CeO2.52
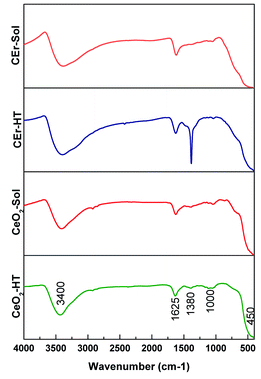 | ||
| Fig. 6 FT-IR spectra of pure and Er3+ doped CeO2 samples prepared by sol–gel and hydrothermal methods. | ||
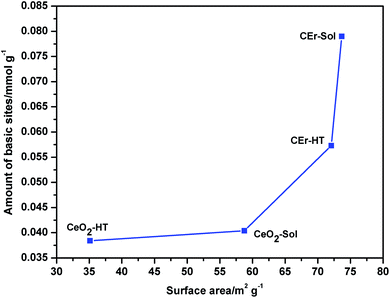
Surface basicity studies performed using CO2-TPD measurements revealed the strength, distribution and amount of basic sites present on the surface of the synthesised compounds.54,55 The strength of basic sites was determined based on the temperature range in which desorption occurs i.e., the higher the temperature at which desorption occurs, the stronger will be the basic sites. Similarly, weaker sites desorb at a lower temperature. Based on the temperature range at which desorption occurs, the basic sites on CeO2 particles were classified into very weak (<523 K), weak (523–653 K), medium (653–723 K) and strong (>723 K).56,57 Integration of the CO2-TPD curves over these temperature ranges provided the amount of different basic sites. The TPD curves of all the samples recorded at a heating rate of 12 K min−1 are shown in Fig. 7 and the amount of basic sites calculated by integrating the curves and the surface area of the respective samples are given in Table 3.
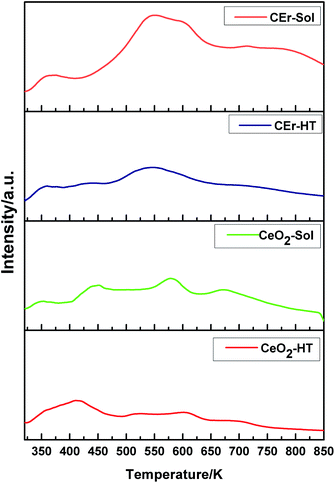 | ||
| Fig. 7 CO2-TPD curves at a heating rate of 12 K min−1 for CeO2-HT, CeO2-Sol, CEr-HT and CEr-Sol samples. | ||
| Sample | Surface area (m2 g−1) | Type of basic site | Total (mmol g−1) | |||
|---|---|---|---|---|---|---|
| Very weak < 523K (mmol g−1) | Weak 523–653 K (mmol g−1) | Medium 653–723 K (mmol g−1) | Strong > 723 K (mmol g−1) | |||
| CeO2-HT | 35.11 | 0.0205 | 0.0107 | 0.0038 | 0.0034 | 0.0384 |
| CeO2-Sol | 58.77 | 0.0157 | 0.0130 | 0.0059 | 0.0058 | 0.0404 |
| CEr-HT | 72.07 | 0.0203 | 0.0173 | 0.00687 | 0.0128 | 0.0573 |
| CEr-Sol | 73.67 | 0.0202 | 0.0265 | 0.0104 | 0.0219 | 0.0790 |
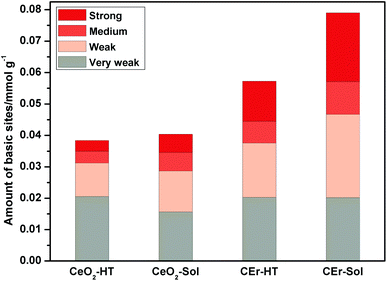
It is evident from Fig. 8 that with the increase in the surface area there is a simultaneous increment in the number of basic sites. While considering each type of basic site, except for the very weak type sites, the amount of all other types of basic sites increases with an increase in surface area. However, very weak basic sites are present in almost the same amount in all samples except in CeO2-Sol. The distributions of different types of basic sites among the synthesised samples are shown in Fig. 9.
The introduction of Er3+ ions into the CeO2 lattice has a remarkable influence on the strength of basic sites. For hydrothermally synthesized samples (CeO2-HT and CEr-HT), the amount of medium strength basic sites got doubled on Er3+ doping and the amount of strong basic sites became four times that of CeO2-HT. Similarly, in sol–gel synthesized samples, CEr-Sol has almost double the amount of medium strength basic sites and approximately four times the amount of strong basic sites when compared to CeO2-Sol.
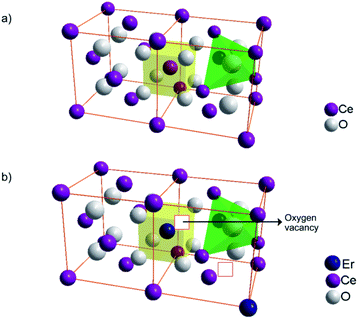
The increase in the number of basic sites with Er3+ doping can be explained based on the Lewis acid–base concept. The structure of pure CeO2 and oxygen vacancy generation by Er3+ doping in the CeO2 lattice are illustrated in Fig. 10. The replacement of Ce4+ with Er3+ in the CeO2 lattice results in oxygen vacancies, which are electron-rich in nature. According to the Lewis concept, electron donors are basic in nature and electron acceptors are acidic. Hence the electron-rich sites are expected to have basic character.58 So, the doping of Er3+ results in an increased number of oxygen vacancies which are basic in nature.
Adsorption studies
The adsorption activity of the as-prepared CeO2 samples towards Congo red was evaluated using UV-visible absorption spectroscopy. The adsorptive removal of Congo red (initial concentration of the dye solution was fixed at 20 mg L−1) by the CeO2-HT, CeO2-Sol, CEr-HT and CEr-Sol samples (1 g L−1) at the ambient pH (6.5) of Congo red solution in terms of their UV-visible spectra is shown in Fig. 11.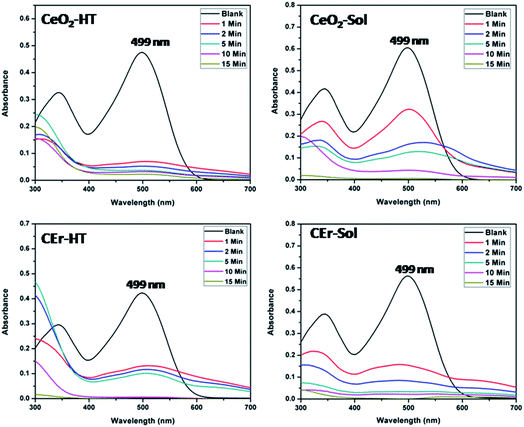 | ||
| Fig. 11 UV-visible absorbance spectra showing the adsorptive removal of Congo red by CeO2-HT, CeO2-Sol, CEr-HT and CEr-Sol samples. | ||
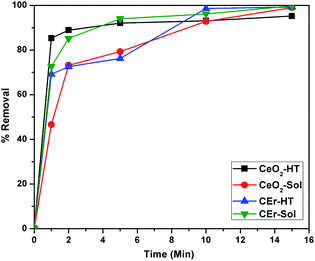
The percentage removal of Congo red by the four different CeO2 samples is shown in Fig. 12. It can be seen that all four samples show more than 90% removal of Congo red within 15 minutes. It can be seen that CeO2-HT and CEr-Sol show 88.9 and 85.16% removal within 2 minutes. Among the four samples, CEr-Sol is capable of removing almost 100% of Congo red within 15 minutes. The adsorption rates of Congo red by the sol–hydrothermal and sol–gel derived samples are shown separately in Fig. 13. In the case of hydrothermal derived samples, it can be seen that CeO2-HT initially shows a higher rate of adsorption which diminishes later and then CEr-HT dominates. While comparing the sol–gel derived samples, it can be seen that CEr-Sol always exhibits a superior adsorption rate to CeO2-Sol. From the adsorption studies, it is evident that CEr-Sol is the best adsorbent material among the four CeO2 samples developed. Therefore further investigations were focussed mainly on CEr-Sol.
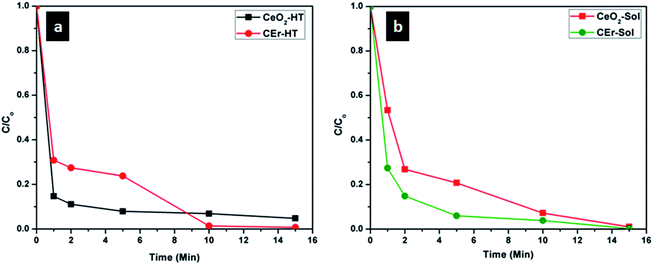 | ||
| Fig. 13 Comparison of adsorption rates of (a) sol–hydrothermal derived and (b) sol–gel derived CeO2 samples. | ||
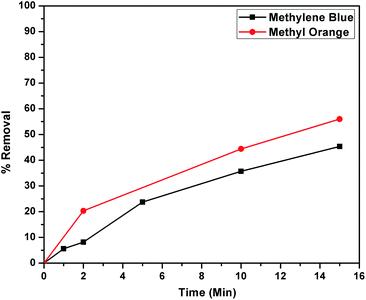
The higher selectivity of CEr-Sol towards Congo red (CR) was evaluated by carrying out adsorption analysis with a cationic dye methylene blue (MB) and another azo dye methyl orange (MO). The UV-visible absorption spectra for MB and MO adsorptions are shown in Fig. 14a and b, respectively. CEr-Sol shows adsorption towards both MB and MO to some extent. The percentage removal of MB and MO by CEr-Sol is shown in Fig. 15. CEr-Sol shows higher adsorption capacity towards MO than towards MB. Compared to the 85% removal of Congo red by CEr-Sol within 2 minutes, the percentage removal of MB and MO within the same time span is less.
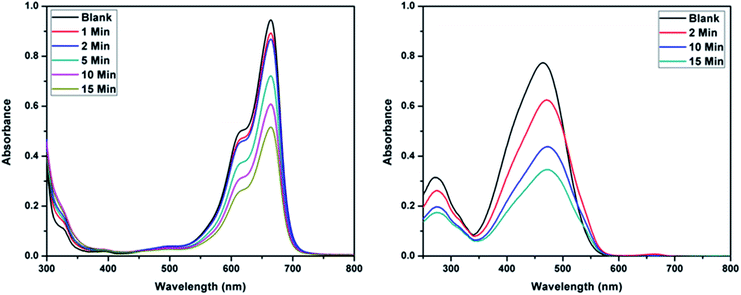 | ||
| Fig. 14 UV-visible absorbance spectra showing the adsorptive removal of (a) methylene blue and (b) methyl orange by CEr-Sol. | ||
The adsorption activity of CEr-Sol in a mixed dye solution of MB and CR was also studied using UV-visible absorption spectroscopy. UV-visible absorbance spectra of the mixed dye solution before and after introducing CEr-Sol are shown in Fig. 16. The initial dye solution exhibits two absorption maxima, one at 663 nm corresponding to MB and the other at ∼480 nm corresponding to CR, respectively. Two minutes after the introduction of CEr-Sol into the dye solution, a considerable reduction in the CR absorption band can be seen. At the same time, the MB absorption band around 663 nm is fully retained. Hence the selectivity and rapid adsorption rate of CEr-Sol towards CR even in the presence of other dyes are fully evident.
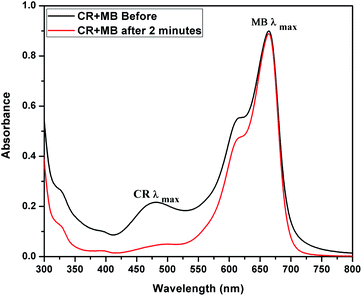 | ||
| Fig. 16 UV-visible absorbance spectrum showing the selective adsorption of Congo red by CEr-Sol from a mixed solution of Congo red and methylene blue. | ||
Effect of pH on adsorption
The effect of pH on the adsorption of Congo red was evaluated by carrying out adsorption studies under pH conditions of 3, 6.5 and 10. The UV-visible spectra corresponding to the adsorption under three different pH conditions are shown in Fig. 17. On varying the pH of the Congo red solution, it was found that the colour of the solution turned dark blue at around pH 3 and showed a corresponding red shift in the absorption spectra. At the same time around pH 10, the red colour of the dye solution got more intense compared to that at the ambient pH of 6.5. It is evident from the adsorption studies that pH plays a crucial role in Congo red adsorption. CEr-Sol exhibited 99.75% removal of Congo red at the inherent pH (6.5) of the dye solution. At pH 3, CEr-sol showed a removal percentage of 96.24% which reduced to 13.54% at an alkaline pH of 10. Thus the inherent pH of the Congo red solution (6.5) was found to be the best environment for maximum adsorption by CEr-Sol. The pH of the point of zero charge (pHPZC) of CEr-Sol determined by the pH drift method was 2.16. The role of the pH of Cogo red solution and pHPZC of the adsorbent in the adsorption mechanism is discussed in detail in the coming sections.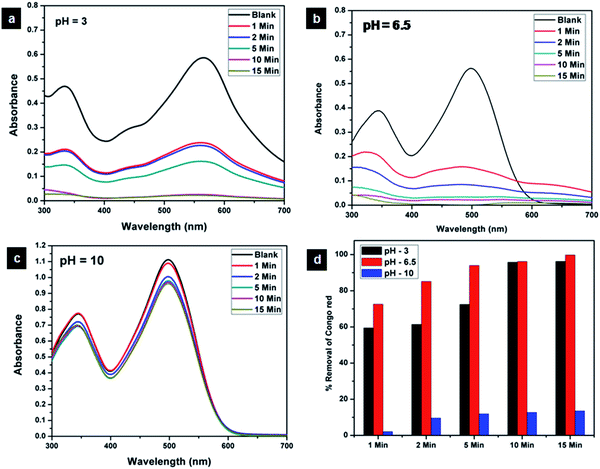 | ||
| Fig. 17 Effect of pH on the adsorptive removal of Congo red by CEr-Sol at (a) pH 3, (b) pH 6.5 and (c) pH 10 and (d) bar diagram showing the percentage removal at different time intervals. | ||
From all the above results, it is clear that CEr-Sol is the most superior and fastest adsorbent among the four variants of CeO2 samples synthesized. Adsorption isotherms of CEr-Sol are shown in Fig. 18.
 | ||
| Fig. 18 (a) Langmuir isotherm, (b) linearized Langmuir and (c) linearized Freundlich isotherms of CEr-Sol. | ||
Adsorption isotherm analysis can help to calculate the maximum adsorption capacity of adsorbents towards a particular species. The adsorbent concentration was optimized at first (1 g L−1). For the optimized CEr-Sol concentration, the amount of Congo red was varied (10, 15, 20, 25 and 30 mg L−1) and Langmuir and Freundlich adsorption isotherms were plotted. The Langmuir adsorption isotherm model can account for homogeneous systems. According to the Langmuir adsorption model
The Langmuir adsorption isotherm and linearized Langmuir isotherm of CEr-Sol are shown in Fig. 18a and b. The maximum amount of dye adsorbed per unit weight of CEr-SOl, qm, is found to be 29.19 mg g−1. It corresponds to the complete monolayer coverage of the CEr-Sol surface. The experimental data were found to fit well with the Langmuir model with a correlation coefficient R2 of 0.9996. The value of b is found to be 18.52 L mg−1 and b is a measure of affinity between the adsorbent and adsorbate. The Freundlich model can account for multilayer and non-equivalent adsorption sites. According to the Freundlich adsorption model
In the case of the Langmuir adsorption isotherm, the affinity between the adsorbent and adsorbate can be quantified by calculating the dimensionless separation factor RL which is given by the equation
Linear isotherms will have a KC0 value equal to 1. If KC0 is in between 1 and 10 the adsorption is considered favourable. A KC0 value higher than 10 denotes a spontaneous and highly favourable adsorption isotherm. The derived value of KC0 for CEr-Sol is 557.65 and it indicated the highly favourable nature of its adsorption isotherm.
Kinetics of Congo red adsorption on CEr-Sol
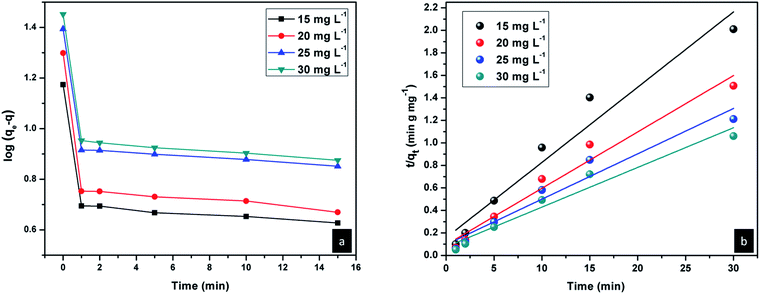
The rate of adsorption of Congo red by CEr-Sol can be determined from kinetics studies. Here we have considered pseudo first order and pseudo second order models for kinetics studies as shown in Fig. 19. According to the pseudo first order adsorption,where qe is the amount of Congo red adsorbed at equilibrium and qt is the amount adsorbed during various time intervals. Here t is the time in minutes and k1 is the pseudo first order rate constant.43
In the case of pseudo second order adsorption,
| Congo red concentration (mg L−1) | k 2 (g mg−1 min−1) | q e calculated (mg g−1) | q e experimental (mg g−1) | R 2 |
|---|---|---|---|---|
| 15 | 2.84 × 10⁻² | 14.95 | 14.93 | 0.9442 |
| 20 | 2.64 × 10⁻² | 19.95 | 19.89 | 0.9649 |
| 25 | 1.68 × 10⁻² | 24.81 | 24.76 | 0.9425 |
| 30 | 1.63 × 10⁻² | 28.34 | 28.28 | 0.9534 |
Mechanism of selective adsorption of Congo red
A thorough investigation of the adsorption mechanism was required to understand the selectivity and enhanced adsorption activity of the prepared samples towards Congo red. While evaluating the adsorption mechanism, several factors such as surface area, porosity, pH, electrostatic interaction between the adsorbent surface and dye molecules, weak interactions such as hydrogen bonding and coordination effects should be considered. The surface area and pore size distributions of the developed samples are already given in Table 2. Among the four CeO2 samples CEr-Sol has the highest surface area and the smallest pore size distribution (4.8 nm). Adsorption capacity and surface area are directly related. The molecular size of Congo red is 2.62 nm which can fit perfectly into the CEr-Sol pores, but the molecular sizes of methyl orange and methylene blue are 1.2 and 1.43 nm, respectively, which are too small to fit into the pores.60 Thus surface area enhancement and pore size regulation by doping Er3+ into the CeO2 lattice can influence the adsorption capacity to a certain extent. It is noted that the electrostatic interaction between the CeO2 surface and dye molecules can affect the adsorption capacity. Hence the adsorption activities of CEr-Sol using both cationic (methylene blue) and anionic (Congo red and methyl orange) dyes are also evaluated. Within 2 minutes, 85.1% of Congo red and 20.3% of methyl orange were removed by CEr-Sol. However, only 8.1% of the cationic dye methylene blue was removed in 2 minutes by CEr-Sol. Even though CEr-Sol has more affinity towards anionic dyes than towards cationic dyes, the surface charge on CeO2 is not the only crucial determining factor of adsorption here. If the surface charge was the only determining factor, CEr-Sol would have adsorbed both anionic dye species to the same extent. A combined effect of pH and adsorbent surface charge emerges during the adsorption of Congo red by CEr-Sol. Here the pHPZC of CEr-Sol was found to be 2.16 (ESI Fig. S1†). Since Congo red is a dipolar molecule, it exists in anionic form in neutral and alkaline pH and in cationic form in acidic pH. From the pHPZC value, we know that at pH > 2.16, the CEr-Sol surface is negatively charged and at pH < 2.16, the CEr-Sol surface is positively charged. While considering the possible electrostatic interactions between Congo red and the CEr-Sol surface, it can be seen that at neutral pH and pH above 7, the adsorbent surface and the Congo red molecules are negatively charged. Thus the mutual repulsion between the adsorbent and adsorbate is responsible for the reduced adsorption under alkaline conditions. Again below pH 2.16, we have both adsorbent and adsorbate as positively charged species and their mutual repulsion tends to decrease the extent of adsorption. This electrostatic repulsion is one of the reasons for the reduced adsorption under acidic conditions. At the same time, a pH in between 2.16 and 7 can give rise to positively charged Congo red species and a negatively charged CEr-Sol surface, enhancing the electrostatic attraction between Congo red and CEr-Sol. Thus the pH range in between 2.16 and 7 electrostatically favours Congo red adsorption on the CEr-Sol surface. Further beyond the electrostatic interactions, the deciding factor in this case is hydrogen bonding. Adsorbed water molecules and surface functional groups on the CeO2 surface can often form hydrogen bonds with the functional groups present on the dye molecules. Here the surface basic sites are significant in controlling the adsorption mechanism because the extent of hydrogen bonding depends on surface basicity. Hence further investigation is exclusively dedicated to the surface basicity controlled selective adsorption of Congo red by CeO2.Selective adsorption and surface basicity
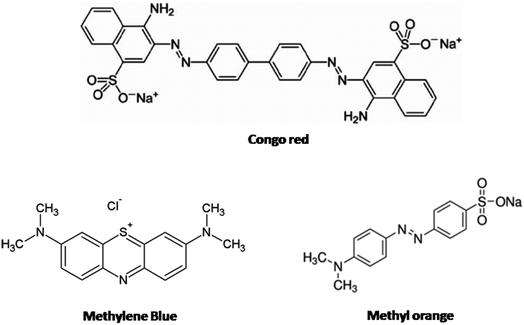
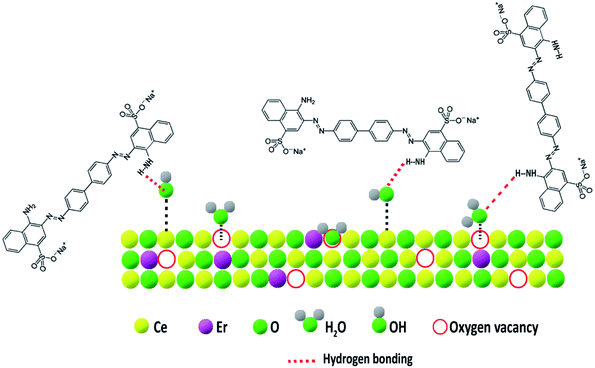
The type and nature of surface basic sites may be different in different adsorbent materials. Here on the CeO2 surface, oxygen vacancies are the major basic sites. The basic nature of oxygen vacancies was explained earlier. The doping of low valence ions such as Er3+ into the CeO2 lattice significantly increased the number of oxygen vacancies and thereby the amount of basic sites.58 These oxygen vacancies have a strong affinity for moisture.53 The presence of adsorbed moisture is evident from the FT-IR spectra. The adsorbed water molecules can form hydrogen bonds with solvent water which ensures better dispersion of the adsorbent in water. Also, many of the adsorbed water molecules dissociate near oxygen vacancies to form surface-active hydroxyl groups.61 The possibility of hydrogen bonding increases with an increase in surface basicity. Now the selectivity of CEr-Sol towards Congo red can be explained based on hydrogen bonding. The structures of Congo red, methylene blue and methyl orange are shown in Fig. 20. From the chemical structures, it is evident that only Congo red has –NH2 functional groups present in its structure which are capable of forming hydrogen bonds with the adsorbed water molecules and hydroxyl basic sites on the CeO2 surface. At the same time, methylene blue and methyl orange lack amino groups that are capable of forming hydrogen bonds. Thus hydrogen bonding can account for the selective adsorption of Congo red by CeO2. The proposed adsorption mechanism is illustrated in Fig. 21.Since CEr-Sol possesses the highest amount of basic sites specifically medium strength and strong basic sites, a corresponding improvement in the adsorption capacity is observed. So the surface basicity enhancement by Er3+ doping into the CeO2 lattice increases hydrogen bonding and thereby the selective adsorption of Congo red. These studies revealed that surface basicity can be used as an effective tool for tuning the adsorption capacity and selectivity of CeO2 towards Congo red. Optimising surface basicity can thus lead to the fabrication of the best adsorbent version of CeO2 for environmental remediation.
Reusability tests
Recyclability is an important attribute in sustainable environmental remediation. After washing several times with distilled water the regenerated adsorbents were dried and calcined at 500 °C for 2 hours. Adsorption studies were again carried out using the regenerated adsorbents for two more adsorption/regeneration cycles. As shown in Fig. 22, the recyclability tests show that the percentage removal of Congo red is 89.33% in the second cycle and 81.38% in the third cycle. Better desorption and recycling techniques which can preserve the surface active sites and thereby the adsorption efficiency of regenerated adsorbents should be further investigated.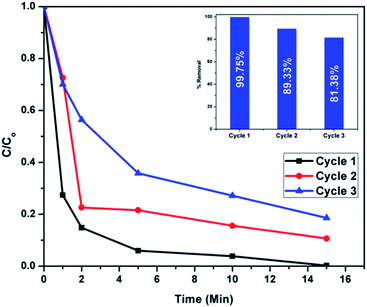 | ||
| Fig. 22 Adsorption rates of regenerated CEr-Sol samples in 3 successive cycles (the percentage removal is given in the inset). | ||
Conclusions
Nanocrystalline mesoporous CeO2 and Er3+ doped CeO2 samples were synthesized using sol–gel and sol–hydrothermal methods. The selective and rapid adsorption ability of these nanocrystalline mesoporous CeO2 samples towards organic pollutants such as Congo red, methyl orange and methylene blue was investigated in detail. From the adsorption experiments, CEr-Sol was found to be the most efficient and highly selective adsorbent towards Congo red. All these studies revealed that CEr-Sol has the highest selectivity and efficiency for Congo red adsorption. CEr-Sol is capable of removing 85.16% of Congo red within 2 minutes and 99.75% removal is observed in 15 minutes. The rapid and selective adsorption mechanism of CEr-Sol was further investigated in detail. Kinetics of the adsorption process was also studied and pseudo second-order kinetics was assigned to it. The main factors controlling the selectivity and adsorption ability are surface area, porosity, electrostatic interactions, surface active sites and hydrogen bonding. Among these, the presence of strong surface basic sites and hydrogen bonding are the crucial factors responsible for the selective and rapid adsorption of Congo red by CEr-Sol. From the surface basicity measurements, the enhancement of adsorption efficiency along with an increase in surface basic sites is evident. The basic mechanism behind the rapid and selective adsorptive removal of Congo red by CEr-Sol is the formation of hydrogen bonds, formed either by the surface hydroxyls or adsorbed water molecules with NH2 groups present exclusively on Congo red. Oxygen vacancies are the prominent basic sites present on the CeO2 surface. The enhanced number of oxygen vacancies generated upon Er3+ doping into the CeO2 lattice plays a significant role in selective adsorption. These oxygen vacancies have a higher affinity for moisture adsorption and the adsorbed water molecules can selectively form hydrogen bonds with the NH2 groups present on Congo red molecules. Since functional groups capable of hydrogen bond formation are absent in methylene blue and methyl orange, the extent of adsorption of these dye molecules on CEr-Sol is comparatively small. This work establishes the possibility of surface basicity mediated enhancement of the selectivity and efficiency of Congo red adsorption by CeO2. Thus surface basicity can be effectively used to tune the selective adsorption capacity of adsorbents towards pollutants.Conflicts of interest
There are no conflicts to declare.Acknowledgements
Deepak Joshy is grateful to University Grants Commission, Government of India, for a JRF fellowship.References
- A. Trovarelli, Catal. Rev., 1996, 38, 439–520 CrossRef CAS.
- S. Wang and G. M. Lu, Appl. Catal., 1998, 19, 267–277 CrossRef CAS.
- S. Seal, A. Jeyaranjan, C. J. Neal, U. Kumar, T. S. Sakthivel and D. C. Sayle, Nanoscale, 2020, 12, 6879–6899 RSC.
- C. Sun, H. Li and L. Chen, Energy Environ. Sci., 2012, 5, 8475–8505 RSC.
- J. A. Rodriguez, D. C. Grinter, Z. Liu, R. M. Palomino and S. D. Senanayake, Chem. Soc. Rev., 2017, 46, 1824–1841 RSC.
- T. Montini, M. Melchionna, M. Monai and P. Fornasiero, Chem. Rev., 2016, 116, 5987–6041 CrossRef CAS PubMed.
- P. Periyat, F. Laffir, S. Tofail and E. Magner, RSC Adv., 2011, 1, 1794–1798 RSC.
- N. J. Lawrence, J. R. Brewer, L. Wang, T.-S. Wu, J. Wells-Kingsbury, M. M. Ihrig, G. Wang, Y.-L. Soo, W.-N. Mei and C. L. Cheung, Nano Lett., 2011, 11, 2666–2671 CrossRef CAS PubMed.
- J. Wang, X. Xiao, Y. Liu, K. Pan, H. Pang and S. Wei, J. Mater. Chem. A, 2019, 7, 17675–17702 RSC.
- M. Ozawa, M. Kimura and A. Isogai, J. Alloys Compd., 1993, 193, 73–75 CrossRef CAS.
- J. Kašpar, P. Fornasiero and M. Graziani, Catal. Today, 1999, 50, 285–298 CrossRef.
- H. Yahiro, K. Eguchi and H. Arai, Solid State Ionics, 1989, 36, 71–75 CrossRef CAS.
- K. Eguchi, T. Setoguchi, T. Inoue and H. Arai, Solid State Ionics, 1992, 52, 165–172 CrossRef CAS.
- N. Srisiriwat, S. Therdthianwong and A. Therdthianwong, Int. J. Hydrogen Energy, 2009, 34, 2224–2234 CrossRef CAS.
- R. Zhang, Y. Wang and R. C. Brown, Energy Convers. Manage., 2007, 48, 68–77 CrossRef CAS.
- A. L. Marinho, F. S. Toniolo, F. B. Noronha, F. Epron, D. Duprez and N. Bion, Appl. Catal., 2021, 281, 119459 CrossRef CAS.
- R. Si and M. Flytzani-Stephanopoulos, Angew. Chem., Int. Ed., 2008, 47, 2884–2887 CrossRef CAS PubMed.
- Q. Fu, A. Weber and M. Flytzani-Stephanopoulos, Catal. Lett., 2001, 77, 87–95 CrossRef CAS.
- D. Andreeva, V. Idakiev, T. Tabakova, L. Ilieva, P. Falaras, A. Bourlinos and A. Travlos, Catal. Today, 2002, 72, 51–57 CrossRef CAS.
- G. Avgouropoulos and T. Ioannides, Appl. Catal., A, 2003, 244, 155–167 CrossRef CAS.
- G. Avgouropoulos, T. Ioannides and H. Matralis, Appl. Catal., 2005, 56, 87–93 CrossRef CAS.
- H. Wang, J. Shen, J. Huang, T. Xu, J. Zhu, Y. Zhu and C. Li, Nanoscale, 2017, 9, 16817–16825 RSC.
- S. Aouad, E. Abi-Aad and A. Aboukaïs, Appl. Catal., 2009, 88, 249–256 CrossRef CAS.
- W. Xingyi, K. Qian and L. Dao, Appl. Catal., 2009, 86, 166–175 CrossRef.
- M. Centeno, M. Paulis, M. Montes and J. Odriozola, Appl. Catal., A, 2002, 234, 65–78 CrossRef CAS.
- J. Kong, Z. Xiang, G. Li and T. An, Appl. Catal., 2020, 269, 118755 CrossRef CAS.
- S. Peng, X. Sun, L. Sun, M. Zhang, Y. Zheng, H. Su and C. Qi, Catal. Lett., 2019, 149, 465–472 CrossRef CAS.
- G. Vilé, B. Bridier, J. Wichert and J. Pérez-Ramírez, Angew. Chem., Int. Ed., 2012, 51, 8620–8623 CrossRef PubMed.
- Y. Liu, K. Murata, M. Inaba, I. Takahara and K. Okabe, Fuel, 2013, 104, 62–69 CrossRef CAS.
- Q.-L. Meng, C.-i. Lee, T. Ishihara, H. Kaneko and Y. Tamaura, Int. J. Hydrogen Energy, 2011, 36, 13435–13441 CrossRef CAS.
- H. Kaneko, T. Miura, H. Ishihara, S. Taku, T. Yokoyama, H. Nakajima and Y. Tamaura, Energy, 2007, 32, 656–663 CrossRef CAS.
- R. Ma, S. Zhang, T. Wen, P. Gu, L. Li, G. Zhao, F. Niu, Q. Huang, Z. Tang and X. Wang, Catal. Today, 2019, 335, 20–30 CrossRef CAS.
- H. Qi, C. Shi, X. Jiang, M. Teng, Z. Sun, Z. Huang, D. Pan, S. Liu and Z. Guo, Nanoscale, 2020, 12, 19112–19120 RSC.
- Z. Dong, B. Yang, H. Chang and L. Li, RSC Adv., 2020, 10, 36371–36377 RSC.
- W. Huang and Y. Gao, Catal. Sci. Technol., 2014, 4, 3772–3784 RSC.
- H. Jiang, S. Ge, Y. Zhang, M. Liu, J. Zhang, J. Lin, M. Dong, J. Wang and Z. Guo, Phys. Chem. Chem. Phys., 2020, 22, 23743–23753 RSC.
- M. M. Sabzehmeidani, H. Karimi and M. Ghaedi, New J. Chem., 2020, 44, 5033–5048 RSC.
- K. Ye, Y. Li, H. Yang, M. Li, Y. Huang, S. Zhang and H. Ji, Appl. Catal., 2019, 259, 118085 CrossRef CAS.
- Y. Xu, R. Li and Y. Zhou, RSC Adv., 2019, 9, 22366–22375 RSC.
- X.-F. Yu, J.-W. Liu, H.-P. Cong, L. Xue, M. N. Arshad, H. A. Albar, T. R. Sobahi, Q. Gao and S.-H. Yu, Chem. Sci., 2015, 6, 2511–2515 RSC.
- X. Ouyang, W. Li, S. Xie, T. Zhai, M. Yu, J. Gan and X. Lu, New J. Chem., 2013, 37, 585–588 RSC.
- X.-h. Lu, D.-z. Zheng, J.-y. Gan, Z.-q. Liu, C.-l. Liang, P. Liu and Y.-x. Tong, J. Mater. Chem., 2010, 20, 7118–7122 RSC.
- D. Maiti, S. Mukhopadhyay and P. S. Devi, ACS Sustainable Chem. Eng., 2017, 5, 11255–11267 CrossRef CAS.
- L. Wang, C. Shi, L. Wang, L. Pan, X. Zhang and J.-J. Zou, Nanoscale, 2020, 12, 4790–4815 RSC.
- A. Xie, J. Dai, X. Chen, J. He, Z. Chang, Y. Yan and C. Li, RSC Adv., 2016, 6, 72985–72998 RSC.
- M. Lin, Z. Y. Fu, H. R. Tan, J. P. Y. Tan, S. C. Ng and E. Teo, Cryst. Growth Des., 2012, 12, 3296–3303 CrossRef CAS.
- K. S. Sing, Adv. Colloid Interface Sci., 1998, 76, 3–11 CrossRef.
- E. P. Barrett, L. G. Joyner and P. P. Halenda, J. Am. Chem. Soc., 1951, 73, 373–380 CrossRef CAS.
- K. S. Sing and R. T. Williams, Adsorpt. Sci. Technol., 2004, 22, 773–782 CrossRef CAS.
- T. Horikawa, D. Do and D. Nicholson, Adv. Colloid Interface Sci., 2011, 169, 40–58 CrossRef CAS PubMed.
- L. Yue and X.-M. Zhang, J. Alloys Compd., 2009, 475, 702–705 CrossRef CAS.
- S. K. Sahoo, M. Mohapatra, A. K. Singh and S. Anand, Mater. Manuf. Processes, 2010, 25, 982–989 CrossRef CAS.
- N. a. M. Tomić, Z. D. Dohcevic-Mitrovic, N. M. Paunović, D. a. Z. Mijin, N. D. Radic, B. k. V. Grbić, S. M. Askrabic, B. M. Babic and D. V. Bajuk-Bogdanovic, Langmuir, 2014, 30, 11582–11590 CrossRef PubMed.
- V. Choudhary and V. Rane, J. Catal., 1991, 130, 411–422 CrossRef CAS.
- J. Fung and I. Wang, Appl. Catal., A, 1998, 166, 327–334 CrossRef CAS.
- A. Azzouz, D. Nistor, D. Miron, A. Ursu, T. Sajin, F. Monette, P. Niquette and R. Hausler, Thermochim. Acta, 2006, 449, 27–34 CrossRef CAS.
- Z. Cui, J. Gan, J. Fan, Y. Xue and R. Zhang, Ind. Eng. Chem. Res., 2018, 57, 10977–10984 CrossRef CAS.
- H. Metiu, S. Chrétien, Z. Hu, B. Li and X. Sun, J. Phys. Chem., 2012, 116, 10439–10450 CAS.
- N. M. Jacob, P. Kuruva, G. Madras and T. Thomas, Ind. Eng. Chem. Res., 2013, 52, 16384–16395 CrossRef.
- M. Szlachta and P. Wójtowicz, Water Sci. Technol., 2013, 68, 2240–2248 CrossRef CAS PubMed.
- Z. Yang, Q. Wang, S. Wei, D. Ma and Q. Sun, J. Phys. Chem., 2010, 114, 14891–14899 CAS.
Footnote |
| † Electronic supplementary information (ESI) available. See DOI: 10.1039/d1na00412c |
| This journal is © The Royal Society of Chemistry 2021 |

