Investigation of biological activity of 2,3-disubstituted quinazolin-4(1H)-ones against Mycobacterium tuberculosis and DNA via docking, spectroscopy and DFT studies
C. B. Pradeep
Kumar
a,
M. S.
Raghu
b,
K. N. N.
Prasad
 c,
S.
Chandrasekhar
 c,
B. K.
Jayanna
d,
Fahad A.
Alharthi
 e,
M. K.
Prashanth
 *d and
K. Yogesh
Kumar
f
aDepartment of Chemistry, Malnad College of Engineering, Hassan – 573 202, India
bDepartment of Chemistry, New Horizon College of Engineering, Bengaluru 560 103, India
cDepartment of Physics, B N M Institute of Technology, Bengaluru-560 070, India
dDepartment of Chemistry, B N M Institute of Technology, Bengaluru-560 070, India. E-mail: prashanthmk87@gmail.com
eDepartment of Chemistry, College of Science, King Saud University, Riyadh, 11451, Saudi Arabia
fDepartment of Chemistry, School of Engineering and Technology, Jain University, Ramanagara, 562 112, India
First published on 23rd November 2020
Abstract
A series of 2,3-disubstituted quinazolin-4(1H)-ones (3a–j) were screened for their antimicrobial activity via the minimum inhibitory concentration method (MIC). The in vitro anti-tubercular (TB) activity of compounds against Mycobacterium tuberculosis (Mtb) H37Rv was evaluated. Among the screened compounds, 3g and 3h exhibited more potent anti-TB activity with MIC values of 2.15 and 0.75 μM, respectively. The compound 3g and 3h were tested for cytotoxic activity against the mammalian Vero cell line. Docking studies were performed on the enoyl acyl carrier protein (InhA) to understand the mechanism of actions of the compounds. The study revealed that the compounds have a strong anti-TB activity and showed a good affinity toward the protein. Hence, the target compounds 3g and 3h can be adapted and produced more effectively as lead compounds in the treatment of multi-drug resistant tuberculosis. Furthermore, the interaction of lead compounds 3g and 3h with DNA was studied by UV-Visible, fluorescence, and circular dichroism (CD) spectroscopy, cyclic voltammetry (CV) and dynamic viscosity measurements. The studies showed that the groove binding mode of interaction is predominant between DNA and compounds (3g and 3h). The viscosity and absorption results obtained for compound 3g indicated that the Ct-DNA binding properties were enhanced as compared to compound 3h with Kb values of 8.58 × 10⁴ and 3.41 × 10⁴ L Mol−1, respectively. The B3LYP level of density functional theory (DFT) was used to obtain ground state geometries, molecular electrostatic potential (MEP) surfaces, and HOMO–LUMO energy calculations.
Introduction
Over the years, N-heterocyclic compounds have gained enormous significance in the field of drug discovery processes due to their characteristic properties such as lipophilicity, metabolism, and oral bioavailability. Chemists have focused on the synthesis of various six-membered N-heterocyclic compounds because of their potential applications in pharmacology, biology, etc.1–4 Among the six membered N-heterocyclic compounds, quinazolinone systems are potentially biologically important. Quinazolinone derivatives have a wide range of applications in many chemical, biological, and pharmaceutical fields.5–9 As a result, these compounds have attracted the attention of synthetic and biological chemists.DNA is a major biological macromolecule and is of fundamental significance in the life process. It is active in protein biosynthesis and carries significant genetic information. Specifically, DNA is the primary molecular target for the development of new drug candidates for TB by combating drug resistance in the development of tuberculosis drugs.10 In the development of a particular target drug, it is critical that it does not affect the normal physiological process of the cells. In this respect, in the field of tuberculosis therapy, the design of DNA binding drugs is a leading strategy for the future.11,12 The interaction studies between quinazolinone and DNA are an important topic and various quinazolinone derivatives have been investigated for their DNA binding properties.
Tuberculosis (TB) is a deadly infectious airborne disease caused by Mycobacterium tuberculosis and it is the leading killer disease worldwide.13 It is an infectious bacillus and the second largest cause of mortality. Despite the availability of TB treatment, it has affected approximately 10 million people and caused 1.5 million deaths in 2019.14 A total of 24 lakhs of TB infected patients have been registered in India and over 79![[thin space (1/6-em)]](https://www.rsc.org/images/entities/char_2009.gif) 000 mortality cases were reported in 2019. Thus, 20
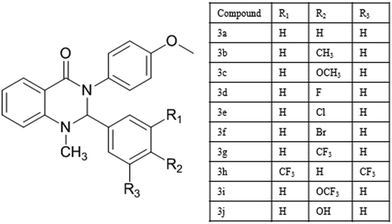
000 mortality cases were reported in 2019. Thus, 20![[thin space (1/6-em)]](https://www.rsc.org/images/entities/char_2009.gif) 000 deaths occur every four months. DOTS should eradicate TB, but due to MDR and XDR-TB, the number of deaths has been rising day by day. The treatment of affected patients with MDR and XDR-TB is very complicated. Researchers have sought to find a new anti-TB drug. Bedaquiline has been established as the first new TB drug to appear in more than 40 years.15–17 For this reason, it is a major challenge for researchers to identify effective drugs that can control the growth of Mycobacterium tuberculosis and at the same time reduce the side effects. Taking into consideration the wide-spread use of quinazolinones in medicine and as a continuation of our research studies on quinazolinones,18–22 we report herein the antimicrobial and antitubercular activity, and cytotoxic effects of quinazolinone compounds (Fig. 1).23 The anti-TB activity of the compounds 3g and 3h are correlated with a docking study. The ability of biologically active compounds 3g and 3h to interact with DNA was investigated using UV-Visible, fluorescence, and circular dichroism spectroscopy, cyclic voltammetry, and dynamic viscosity measurements. Also, density functional theory (DFT) was employed to optimize the experimental data.
000 deaths occur every four months. DOTS should eradicate TB, but due to MDR and XDR-TB, the number of deaths has been rising day by day. The treatment of affected patients with MDR and XDR-TB is very complicated. Researchers have sought to find a new anti-TB drug. Bedaquiline has been established as the first new TB drug to appear in more than 40 years.15–17 For this reason, it is a major challenge for researchers to identify effective drugs that can control the growth of Mycobacterium tuberculosis and at the same time reduce the side effects. Taking into consideration the wide-spread use of quinazolinones in medicine and as a continuation of our research studies on quinazolinones,18–22 we report herein the antimicrobial and antitubercular activity, and cytotoxic effects of quinazolinone compounds (Fig. 1).23 The anti-TB activity of the compounds 3g and 3h are correlated with a docking study. The ability of biologically active compounds 3g and 3h to interact with DNA was investigated using UV-Visible, fluorescence, and circular dichroism spectroscopy, cyclic voltammetry, and dynamic viscosity measurements. Also, density functional theory (DFT) was employed to optimize the experimental data.
Results and discussion
The target compounds used in the present study were previously synthesized and fully characterized by spectroscopic and analytical techniques.23 The antibacterial activity of compounds 3a–j against Gram-positive and Gram-negative bacterial strains was tested by the disc diffusion method and the MIC was determined by the dilution method. The obtained results are summarized in Table 1. The standard drugs rifampicin, streptomycin, and fluconazole were used as standards for antibacterial and antifungal activities, respectively. Overall, the quinazolinone compounds (3a–j) displayed broad-spectrum antimicrobial activities against most of the bacteria and fungi tested including MRSA. It was observed that compounds 3g and 3h displayed more potent activity than the respective compounds. This might be explained by the presence of the high electron-withdrawing trifluoromethyl moiety in the compounds. Increased activity was observed with the inclusion of electron-withdrawing groups on the aromatic ring. In halo-substituted compounds (3dvs.3evs.3f), the fluoro (3d) substituent displayed more elevated activity relative to the chloro (3e) and bromo (3f) substituents on the phenyl ring. Moreover, compound 3d showed moderate activity with a MIC ≥8 μg mL−1. Compounds 3e and 3f showed average activity with MIC ≥16 μg mL−1. The compound 3g and 3h displayed equal activity to the standard drug rifampicin against S. aureus, B. subtilis and P. aeruginosa. This may be attributed to the greater electronegativity. Generally, the biological strength, bioavailability, metabolic stability, and lipophilicity has been enhanced by more electronegative atoms in the aromatic ring.24 Enhanced lipophilicity could make molecules easier to absorb and transport in biological systems (Table 2).| Compound | Minimum inhibitory concentration (MIC)a in μM | ||||||
|---|---|---|---|---|---|---|---|
| Gram-positive | Gram-negative | Fungi | MTBb | ||||
| S. aureus | MRSA | B. subtilis | E. coli | P. aeruginosa | C. albicans | ||
| a The values given are means of three experiments. b Mycobacterium tuberculosis H37Rv. | |||||||
| 3a | >128 | >128 | >128 | >128 | 64 | >128 | >100 |
| 3b | 64 | >128 | >128 | >128 | >128 | >128 | >100 |
| 3c | 64 | >128 | 64 | >128 | 64 | 64 | 50 |
| 3d | 8 | 8 | 8 | 8 | 16 | 8 | 12.5 |
| 3e | 16 | 16 | 16 | 32 | 16 | 16 | 12.5 |
| 3f | 16 | 16 | 16 | 64 | 16 | 32 | 25 |
| 3g | 0.5 | 1.0 | 0.5 | 2 | 2 | 4 | 0.25 |
| 3h | 0.5 | 2 | 1 | 4 | 2 | 4 | 0.75 |
| 3i | 64 | >128 | 64 | >128 | >128 | 64 | >100 |
| 3j | 64 | >128 | 64 | >128 | >128 | >128 | >100 |
| Rifampicin | 0.5 | 0.5 | 0.5 | 4 | 2 | Ntb | 0.12 |
| Polymyxin B | 16 | 16 | 8 | 4 | 8 | Ntb | — |
| Flucanazole | — | — | — | — | — | 4 | — |
| Isoniazid | — | — | — | — | — | — | 0.36 |
The promising findings from the antimicrobial studies led us to make a preliminary evaluation of the quinazolinone compounds for their in vitro antituberculosis activity. All the compounds 3a–j were evaluated for their in vitro antituberculosis activity against MTB H37Rv by the agar dilution method. The results obtained were compared with standards rifampicin and isoniazid, as presented in Table 1. Of the tested compounds, compounds 3g and 3h with MIC values of 0.25 and 0.75 μM, respectively, were the most potent growth inhibitors of Mtb H37Rv. In addition, the 3d and 3e compounds also exhibited significant activity with a MIC value of 12.5 μM. Among the numerous substitutions on the phenyl ring for antitubercular action, the monosubstituted trifluoromethyl group on the phenyl ring is more active than the monosubstituted halogens and the disubstituted trifluoromethyl group. This indicates that the mono-substitution of the trifluoromethyl group on the phenyl ring displayed excellent antitubercular activity relative to the standard isoniazid (MIC: 0.36 μM). Based on these results, compounds 3g and 3h have been identified as promising antimicrobial members along with the better antitubercular activity of this series of compounds. To illustrate the antitubercular potential of a drug, certain therapeutic properties must be identified. Toxicity is first among these criteria. Generally, potential candidates are typically evaluated on a mammalian Vero cell line in pre-clinical drug development to determine any cytotoxic impact the compound may exert on the body cells. The IC50 values obtained for the active compounds are shown in Table 3. Among the test compounds, 3g and 3h showed inferior toxicity with IC50 values of 168.47 and 183.26 μM against a mammalian Vero cell line.
| Compound | Docking score (kcal mol−1) | Interacting residues | π–σ | ||
|---|---|---|---|---|---|
| H-bond | Hydrophobic | Amide-π stacked | |||
| NF: not formed. | |||||
| 3a | −6.8 | NF | Leu-5, Ile-10, Val-12, Ile-25, Ala-29, Ala-34, Val-92, His-93, Ile-95, Tyr-128, Val-145, Gly-146, Met-147, Leu-188, Ala-191, Ala-239, Cys-243, Leu-245 | Val-242 | NF |
| 3b | −6.5 | NF | Leu-5, Ile-10, Val-12, Ile-21, Ile-25, Ala-29, Leu-36, Val-92, His-93, Ile-144, Val-145, Gly-146, Met-147, Leu-188, Val-189, Ala-239, Cys-243, Leu-246 | Val-242 | NF |
| 3c | −6.9 | NF | Ile-25, Ile-10, Val-12, Ala-26, Val-28, Ala-29, Leu-36, Gly-90, Val-92, His-93, Gly-146, Met-147, Leu-168, Leu-188, Val-189, Cys-243, Leu-245 | NF | Val-145 |
| 3d | −7.3 | NF | Leu-5, Ile-25, Ala-29, Leu-36, Val-92, His-93, Tyr-127, Val-145, Gly-146, Met-147, Asn-187, Leu-188, Val-189, Ala-239, Cys-243, Leu-245, Leu-246 | Val-242 | NF |
| 3e | −7.1 | NF | Leu-5, Ile-25, Ala-29, Ala-34, Leu-36, Val-92, His-93, Ile-144, Val-145, Gly-146, Met-147, Asn-187, Leu-188, Val-189, Ala-239, Cys-243, Leu-246 | Val-242 | NF |
| 3f | −7.3 | His-93 | Leu-11, Val-12, Ile-21, Ile-25, Ala-29, Gly-90, Val-92, Ser-94, Ser-143, Val-145, Gly-146, Met-147, Leu-188, Val-189, Val-242, Cys-243, Leu-246 | NF | NF |
| 3g | −9.3 | Val-92, Cys-243 | Leu-5, Val-12, Ser-13, Ile-25, Val-28, Ala-29, Ala-34, Val-92, His-93, Val-145, Gly-146, Asp-148, Met-147, Asn-187, Leu-188, Val-189, Cys-243, Leu-246 | Val-242 | Ile-25, Val-242 |
| 3h | -8.9 | Val-91 | Leu-5, Ile-10, Val-12, Ile-25, Ala-29, Asp-89, Val-92, His-93, Ile-144, Val-145, Gly-146, Met-147, Leu-188, Val-189, Val-238, Ala-239, Cys-243, Leu-246 | NF | Val-242 |
| 3i | −6.8 | NF | Leu-5, Ile-25, Ala-26, Ala-29, Leu-36, Val-92, His-93, Ser-94, Val-145, Gly-146, Met-147, Leu-188, Val-189, Ala-191, Cys-243, Leu-245, Leu-246 | NF | NF |
| 3j | −8.1 | NF | Leu-5, Ile-10, Ile-25, Ala-29, Ala-34, Leu-36, Val-92, His-93, Ile-144, Val-145, Gly-146, Met-147, Leu-188, Val-189, Val-238, Cys-243, Leu-246 | Val-242 | NF |
| Isoniazid | −7.6 | Val-91 | Ile-25, Ala-29, Val-92, His-93, Val-145, Gly-146, Met-147, Leu-188, Val-189, Cys-243, Leu-246 | NF | Val-242 |
| Quercetin | −9.4 | Ile-25, Val-91, Val-189 | Ile-21, Val-28, Ala-29, Gly-90, His-93, Ser-94, Val-145, Gly-146, Met-147, Asp-148, Lys-165, Leu-188, Val-189, Ala-239, Cys-243 | Val-242 | Val-92 |
Molecular docking studies
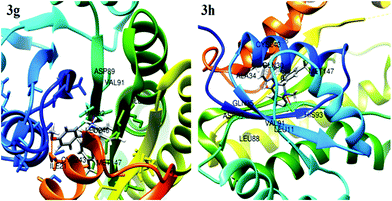
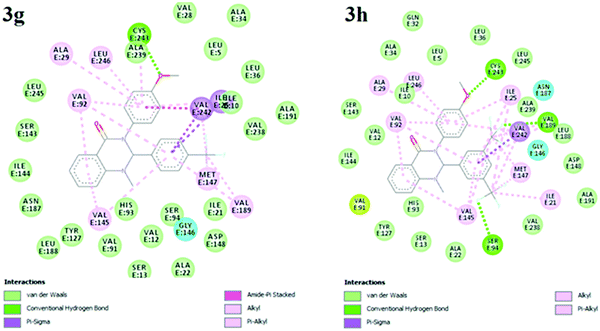
Molecular docking analysis is commonly employed to predict the binding energy and mechanism of action for ligands at the active site of a protein. Tuberculosis is characterized by a number of drug targets, including InhA (enoyl acyl carrier protein reductase), and inhibitors of target InhA were found to be a promising lead.25 InhA is involved in the elongation of type II fatty acids during the mycolic acid synthesis and it is currently the target of the first-line drug isoniazid for treating tuberculosis infections. For the cell viability of bacteria, InhA is essential and supported as an effective anti-TB target. As a result, InhA inhibitors have been found to have in vivo efficacy, and are considered good targets. Therefore, we focused and docked the target compounds with InhA (PDB id: 4QXM) protein using Autodock 4.2 software. The structure of the protein crystal was optimized and minimized using the protein preparation wizard using the default setting to rectify the PDB structure for the docking process. The molecular docking scores and interacting residues of protein with target compounds are listed in Table 3. The docking studies revealed that ligand docking scores were in the range of −9.3 to −6.5, which are comparable to the standard drug isoniazid and quercetin with docking scores of −7.6 to −9.4 kcal mol−1, respectively. A linear correlation was found between the docking scores of the test compounds and the corresponding MIC values, where the active compounds showed a high docking score, while the compounds with higher MIC values showed a lower docking score. The docking study showed that compound 3g and 3h had more binding affinity to InhA relative to test compounds 3a–f, 3i and 3j. Compounds 3g and 3h showed the best possible binding mode against 4QXM protein. Fig. 2 and 3 represent the 3D and 2D docked pictures of target compounds 3g and 3h with 4QXM. In the best docked pose of 3g, two hydrogen bonds are formed with Val-92 and Cys-243, and 3h forms one hydrogen bond with Val-91. Additionally, an amide-pi interaction is seen between Val-242 and the phenyl ring (3g). Hence, these interactions resulted in the highest docking score of −9.3 kcal mol−1 for compound 3g compared to 3h (−8.9 kcal mol−1).ADME and bioavailability analysis provide significant insight for drug-likeness in the research and development process for new drugs. Lipinski's Rule of five26 of these compounds was computed using pre-ADMET software. The oral active compound does not have more than 4 violations of Lipinski's Rule. Table 4 summarizes the prediction of Lipinski's rule of five for the test compounds, which is a preliminary test for drug-likeness of compounds. In the present analysis, all the test compounds showed good drug-likeness based on Lipinski's Rule of 5 showing no violations of more than the full permissible limits, proving all the test compounds to be orally active. The descriptor model values such as molecular weight, number of rotatable bonds, hydrogen bond donor (HBD), hydrogen bond acceptor (HBA) and Log![[thin space (1/6-em)]](https://www.rsc.org/images/entities/char_2009.gif) P, used as a solubility measure for the test compounds, lie in the expected ranges. Furthermore, polar surface area (PSA) is an important property to determine the oral bioavailability, which is used for the optimization of a compound's ability to permeate cells. A PSA of less than 90 Å2 is normally required for molecules to penetrate the blood brain barrier. Excessively high PSA values contribute to low bioavailability and drug absorption. For all the test compounds, our results showed good values in the range 32.78–53.01 Å2. The value of the SwissADME Log
P, used as a solubility measure for the test compounds, lie in the expected ranges. Furthermore, polar surface area (PSA) is an important property to determine the oral bioavailability, which is used for the optimization of a compound's ability to permeate cells. A PSA of less than 90 Å2 is normally required for molecules to penetrate the blood brain barrier. Excessively high PSA values contribute to low bioavailability and drug absorption. For all the test compounds, our results showed good values in the range 32.78–53.01 Å2. The value of the SwissADME Log![[thin space (1/6-em)]](https://www.rsc.org/images/entities/char_2009.gif) P was determined from five separate algorithms, and it is presumed that the value represents real conditions.27 This ADME prediction of active compounds will also assist in designing new drug candidates with favorable oral bioavailability.
P was determined from five separate algorithms, and it is presumed that the value represents real conditions.27 This ADME prediction of active compounds will also assist in designing new drug candidates with favorable oral bioavailability.
| Compound | Mol. Wt. | Rotatable bonds | HBA | HBD | Log![[thin space (1/6-em)]](https://www.rsc.org/images/entities/char_2009.gif) P P |
Molar refractivity | PSA | Bioavailability score |
|---|---|---|---|---|---|---|---|---|
| HBA: hydrogen bond acceptor, HBD: hydrogen bond donor, PSA: polar surface area. | ||||||||
| 3a | 344.41 | 3 | 2 | 0 | 3.23 | 109.69 | 32.78 | 0.55 |
| 3b | 358.43 | 3 | 2 | 0 | 3.61 | 114.66 | 32.78 | 0.55 |
| 3c | 374.43 | 4 | 3 | 0 | 3.62 | 116.18 | 42.01 | 0.55 |
| 3d | 362.40 | 3 | 3 | 0 | 3.44 | 109.65 | 32.78 | 0.55 |
| 3e | 378.85 | 3 | 2 | 0 | 3.58 | 114.70 | 32.78 | 0.55 |
| 3f | 423.30 | 3 | 2 | 0 | 3.69 | 117.39 | 32.78 | 0.55 |
| 3g | 412.40 | 4 | 5 | 0 | 3.56 | 114.69 | 32.78 | 0.55 |
| 3h | 480.40 | 5 | 8 | 0 | 3.79 | 119.70 | 32.78 | 0.55 |
| 3i | 410.41 | 5 | 5 | 0 | 3.56 | 116.29 | 42.01 | 0.55 |
| 3j | 360.41 | 3 | 3 | 1 | 3.02 | 111.72 | 53.01 | 0.55 |
| Lipinski rule | ≤500 | — | <10 | <10 | <5 | 40–130 | — | — |
DNA is one of the aims for small molecules like antibiotics, which are biologically important. There is increasing interest in exploring the relationship of small molecules with DNA for the rational design and development of new and effective DNA oriented drugs. Despite many efforts to obtain information about the interaction between DNA and various drug molecules, there are few studies in the existing literature concerning the interaction between antitubercular drugs and DNA. Chakraborty et al.28,29 reported that antitubercular drugs, namely dapsone and rifampicin, bind DNA via groove and intercalate modes, respectively. In this context, we decided to test the most effective molecule for DNA binding studies. The interaction of compounds 3g and 3h toward DNA was studied by UV-Vis absorption spectroscopy. The absorption spectra of compound 3g and 3h in the absence and presence of increasing concentrations of Ct-DNA are illustrated in Fig. 4. Generally, the hypochromic and red shift are tied to the intercalative binding form of molecules to DNA, whereas hyperchromic and blue shift were correlated with groove binding. Our results showed that upon addition of increasing concentrations of Ct-DNA, the absorbance of the compound 3g and 3h decreases regularly and no red shift was observed, which confirms the groove binding mode of compound 3g and 3h with Ct-DNA. The Gibbs free energy (ΔG) of test compounds and DNA were calculated based on the binding constant using the following classical van’t Hoff's eqn (1).
ΔG = −RT![[thin space (1/6-em)]](https://www.rsc.org/images/entities/char_2009.gif) ln ln![[thin space (1/6-em)]](https://www.rsc.org/images/entities/char_2009.gif) Kb Kb | (1) |
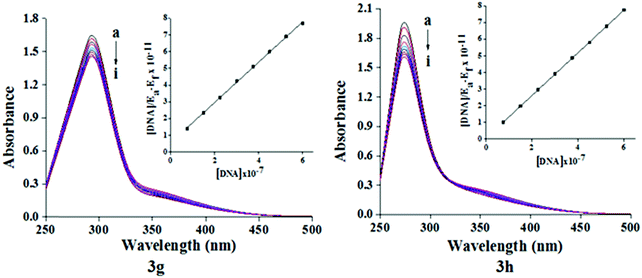 | ||
| Fig. 4 Absorption spectra of compound 3g and 3h (100 μM) in the absence and presence (10–80 μM) of Ct-DNA at pH 7.4 and at room temperature. Inset: Plot of [DNA]/(εa − εf) vs. [DNA]. | ||
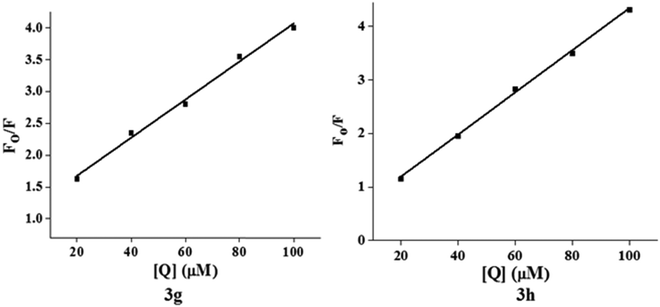
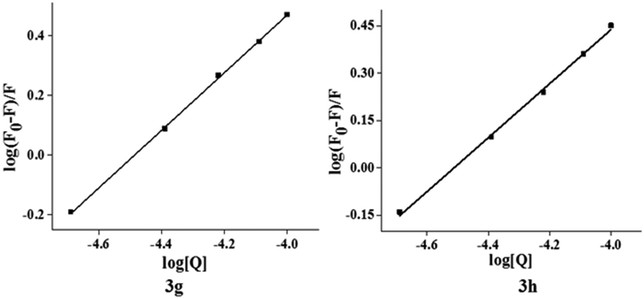
The characteristic EB quenching assay results are shown in Fig. 5. With an increase of the test compounds (3g and 3h) concentration, fluorescence spectra show a decrease of the DNA bound EB intensity at 598 nm. This indicates that the quenching of EB molecules occurs due to the binding of the quinazolinone moiety to DNA. The classical Stern–Volmer equation30(2) was used to calculate quenching constant in evidence of the binding interactions.
| F0/F = 1 + KSV[Q] = 1 + Kqτ0[Q] | (2) |
log(F0 − F)/F = log![[thin space (1/6-em)]](https://www.rsc.org/images/entities/char_2009.gif) Kb + n Kb + n![[thin space (1/6-em)]](https://www.rsc.org/images/entities/i_char_2009.gif) log[Q] log[Q] | (3) |
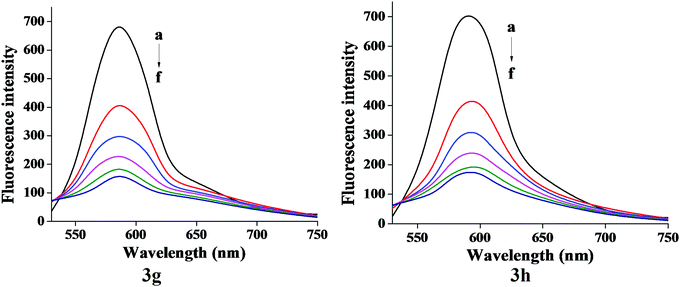 | ||
| Fig. 5 Fluorescence emission spectra of EB-DNA in absence and presence (20–100 μM) of compound 3g and 3h. | ||
| Compound | K SV (L mol−1) | K q (L mol−1 s−1) | R 2 | K b (L mol−1) | n | ΔG (kJ mol−1) |
|---|---|---|---|---|---|---|
| 3g | 2.518 × 10⁴ | 2.516 × 10¹² | 0.9931 | 8.58 × 10⁴ | 1.41 | −47.36 × 10⁸ |
| 3h | 2.316 × 10⁴ | 2.318 × 10¹² | 0.9842 | 3.41 × 10⁴ | 1.29 | −17.38 × 10⁸ |
Fig. 7 shows the plot of log[(F0 − F)/F] versus log[Q] and the values of Kb and n are shown in Table 5. Generally, the value of Kb ranging from 105 to108 L M−1 signifies a strong binding affinity.33,34 For the present system, the linear plot in Fig. 7 yields a binding constant of 8.58 × 10⁴ and 3.41 × 10⁴ L M−1 for compound 3g and 3h, respectively. The order of the binding constant assessed shows groove binding of the probe in the DNA environment. The n values are very close to 1, which indicate that a single binding site occurs between test compounds and Ct-DNA.
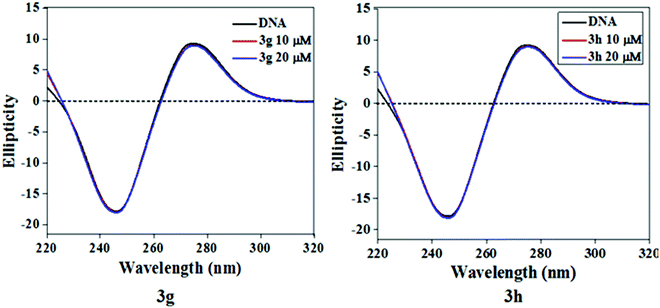
During ligand–DNA interactions, optical behavior is prone to local conformational changes in the secondary structure of Ct-DNA as measured by CD spectroscopy. Hence, we have endeavored to record CD spectra of Ct-DNA with increasing test compound/Ct-DNA ratios to ascertain the significant conformational changes of the DNA double helix during the interaction between test compounds and Ct-DNA (Fig. 8). Two characteristic bands, a positive band at 275 nm due to base stacking and a negative band at 245 nm due to right-handed helicity, were observed in the CD spectrum of Ct-DNA.35 The intensity of these two characteristic CD bands of Ct-DNA and their peak position does not change significantly when test compounds interact with Ct-DNA, which clearly indicated that binding the test compounds with Ct-DNA does not disrupt the base stacking. Thus, it can be inferred that groove binding is the most possible interaction mode of test compounds with Ct-DNA.
Electrochemical techniques were employed as a simple and fast DNA interaction study with various compounds. CV techniques are important to estimate drug–DNA interaction behaviors qualitatively and quantitatively. The electrochemical analysis of the ligand–DNA interactions supplement spectroscopic methods and include details on interactions with the reduced and oxidized form of the ligand.36 The redox behavior of test compounds 3g and 3h was monitored using a glassy carbon electrode as a working surface at a scan rate of 100 mV s−1 through cyclic voltammetry. Fig. 9 represents the cyclic voltammograms of test compounds 3g and 3h in the absence and presence of Ct-DNA in Tris–HCl buffer of pH 7.4. A decrease in the peak current with the introduction of Ct-DNA was shown by voltammetric responses, which may be induced by the slow diffusion of the test compound-DNA complexes formed after interaction and decrease in free ligand concentration. Throughout the presence of Ct-DNA, the anodic peak shifted positively whereas the cathodic peak shifted negatively, suggesting a groove binding between the test compounds and Ct-DNA.37,38 Thus, we can conclude that this observation is well correlated to the findings obtained from UV-Vis, fluorescence, and circular dichroism spectroscopic techniques.
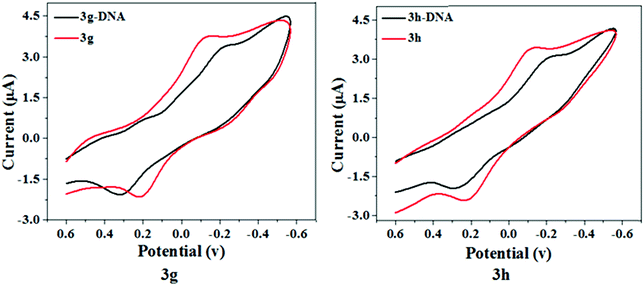 | ||
| Fig. 9 Cyclic voltammogram of compound 3a and 3g in the absence (red) and presence (black) of DNA at 50 mV s−1 in 10 mM tris-buffer, pH 7.4. | ||
The spectroscopic data to support the binding mode are necessary, however not adequate. A very important tool to further estimate the binding nature of Ct-DNA is the viscometric measurement, which is extremely sensitive and can be conclusive evidence of how small molecules interact with DNA. Hence, to better explain the binding of the test compounds, viscosity measurements were conducted on Ct-DNA by varying the concentration of the test compounds. The regional base pairs were separated in the intercalation mode to accommodate compounds that increase the viscosity of DNA. On the other side, no significant change was observed in the viscosity of DNA for groove binding.39 The effect of test compounds 3g and 3h on the viscosity of Ct-DNA is given in Fig. 10. No significant viscosity changes in Ct-DNA were observed in our study with the increased test compound concentration. This finding indicated that test compounds 3g and 3h associate with Ct-DNA through groove binding rather than intercalation.
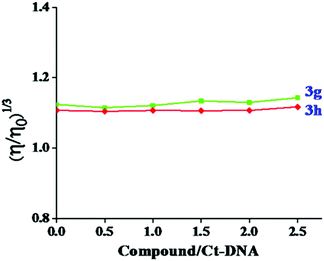 | ||
| Fig. 10 The effect of increasing concentration of compound 3g and 3h over the relative viscosity of Ct-DNA (50 μM). | ||
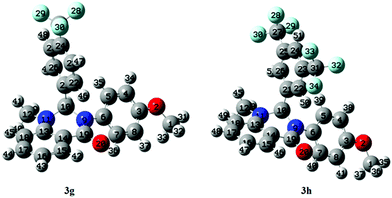
DFT based global reactivity descriptors have drawn significant attention in defining the reactivity and site selectivity of different bio-molecules. We therefore used DFT based global reactivity descriptors to analyze the structure, stability, and properties of compounds 3g and 3h. The optimization of compound 3g and 3h was performed using DFT at the B3LYP level of theory with the 6-31G basis set and no imaginary frequencies were found in the optimized structure. The absence of imaginary frequencies confirmed that these structures corresponded to a true minimum of energy. Further, optimized data indicated that the selected compounds belong to C1 point symmetry. The default convergence criteria set by the software Gaussian 09 were applied in both molecules geometry optimizations. The optimized structures along with the numbering scheme are shown in Fig. 11.
The Mulliken atomic charges provide information about the concentration of the electronic charge density of molecules. Quantities such as the dipole moment, polarizability, chemical reactivity rely on the charge distribution in the molecular systems. Calculated Mulliken atomic charges by DFT/B3LYP at 6-31G basis set are shown in Table 6. From Table 6, the charge on the carbon atom (C19) is higher than other carbon atoms in both the compounds because it is bonded to electronegative oxygen (O9) and nitrogen atoms (N20). Also, we can observe that nitrogen and oxygen atoms (O2, N9, N11, and O20) are the most negatively charged atoms, implying that these centres have the maximum electron density and can interact easily with the positively charged portion of the receptor.
| Compound 3g | Compound 3h | ||||
|---|---|---|---|---|---|
| Atom no. | Atoms | Charges | Atom no. | Atoms | Charges |
| 1 | C | −0.207 | 1 | C | −0.207 |
| 2 | O | −0.523 | 2 | O | −0.522 |
| 3 | C | 0.284 | 3 | C | 0.284 |
| 4 | C | −0.138 | 4 | C | −0.136 |
| 5 | C | −0.108 | 5 | C | −0.108 |
| 6 | C | 0.254 | 6 | C | 0.254 |
| 7 | C | −0.069 | 7 | C | −0.068 |
| 8 | C | −0.177 | 8 | C | −0.177 |
| 9 | N | −0.641 | 9 | N | −0.642 |
| 10 | C | −0.034 | 10 | C | −0.035 |
| 11 | N | −0.401 | 11 | N | −0.396 |
| 12 | C | −0.317 | 12 | C | −0.319 |
| 13 | C | 0.190 | 13 | C | 0.185 |
| 14 | C | 0.042 | 14 | C | 0.035 |
| 15 | C | −0.138 | 15 | C | −0.128 |
| 16 | C | −0.132 | 16 | C | −0.128 |
| 17 | C | −0.129 | 17 | C | −0.128 |
| 18 | C | -0.128 | 18 | C | −0.129 |
| 19 | C | 0.394 | 19 | C | 0.390 |
| 20 | O | −0.417 | 20 | O | −0.413 |
| 21 | C | 0.124 | 21 | C | 0.088 |
| 22 | C | −0.119 | 22 | C | −0.073 |
| 23 | C | −0.133 | 23 | C | −0.073 |
| 24 | C | −0.027 | 24 | C | −0.088 |
| 25 | C | −0.117 | 25 | C | −0.055 |
| 26 | C | −0.149 | 26 | C | −0.101 |
| 27 | C | 0.713 | 27 | C | 0.720 |
| 28 | F | −0.269 | 28 | F | −0.275 |
| 29 | F | -0.279 | 29 | F | −0.269 |
| 30 | F | −0.277 | 30 | F | −0.272 |
| 31 | H | 0.160 | 31 | C | 0.718 |
| 32 | H | 0.167 | 32 | F | −0.263 |
| 33 | H | 0.161 | 33 | F | −0.274 |
| 34 | H | 0.141 | 34 | F | −0.270 |
| 35 | H | 0.143 | 35 | H | 0.161 |
| 36 | H | 0.147 | 36 | H | 0.167 |
| 37 | H | 0.143 | 37 | H | 0.161 |
| 38 | H | 0.169 | 38 | H | 0.143 |
| 39 | H | 0.145 | 39 | H | 0.138 |
| 40 | H | 0.171 | 40 | H | 0.148 |
| 41 | H | 0.174 | 41 | H | 0.144 |
| 42 | H | 0.168 | 42 | H | 0.173 |
| 43 | H | 0.128 | 43 | H | 0.148 |
| 44 | H | 0.131 | 44 | H | 0.176 |
| 45 | H | 0.133 | 45 | H | 0.170 |
| 46 | H | 0.182 | 46 | H | 0.173 |
| 47 | H | 0.165 | 47 | H | 0.132 |
| 48 | H | 0.160 | 48 | H | 0.133 |
| 49 | H | 0.139 | 49 | H | 0.134 |
| 50 | H | 0.213 | |||
| 51 | H | 0.193 | |||
| 52 | H | 0.167 | |||
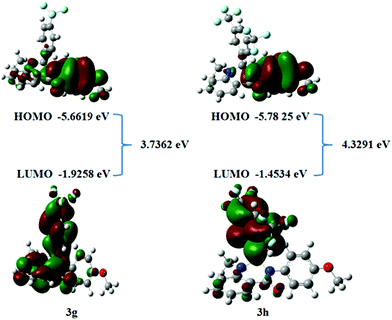
The Frontier molecular orbitals theory related to the HOMO and LUMO is the principle for elucidating the chemical stability of a compound.40 The energy distribution of compounds can be analyzed using HOMO and LUMO energies. HOMO and LUMO energies are associated with molecular reactivity. Such orbitals have a significant role in the electronic and optical properties that determine molecular interactions with other molecular systems. The frontier orbital gap helps to differentiate the kinetic stability and the chemical reactivity of the molecular system.41,42 Concerning the Pearson maximum hardness principle,43 the structure with the lowest chemical hardness and energy gap is the highest reactivity species. The values of HOMO, LUMO, and frontier orbital gap energies of compound 3g and 3h are computed in Fig. 12 and Table 7. From these findings, we can infer that tested compounds 3g and 3h have potential sites available to give or accept electrons. The theoretically calculated EHOMO energies for compounds 3g and 3h are −5.6619 and −5.7825 eV, respectively. The ELUMO values for compound 3g and 3h are −1.9258 and −1.4534 eV, respectively. The compound 3h exhibits a large energy gap compared to 3g, hence it implies that compound 3h exhibits less chemical reactivity compared to compound 3g. These findings are consistent with the biological activity and Ct-DNA binding results. Thus, the lowest hardness, energy gap, and the highest chemical potential of compound 3g makes it the most active species in the present series. In addition, the HOMO–LUMO energy is used to calculate key molecular properties. The following parameters were calculated with the aid of specified expressions and equations in the literature44 and the results are indicated in Table 7. The electrophilicity index values of 3.7938 and 3.6179 eV and chemical potentials of −3.8524 and −3.0236 was obtained for compound 3g and 3h, respectively. The electrophilicity index parameter generally helps to confirm the toxicity of molecules by quantifying the biological activity of drug–receptor interaction.45 The negative magnitude of chemical potential implies that the compounds are not spontaneously decomposed into their elements.
| Parameters | Compound 3g | Compound 3h |
|---|---|---|
| E HOMO (eV) | −5.6619 | −5.7825 |
| E LUMO (eV) | −1.9258 | −1.4534 |
| E HOMO − ELUMO gap (eV) | 3.7362 | 4.3291 |
| Ionization potential (I) (eV) | 5.6619 | 5.7825 |
| Electron affinity (EA) (eV) | 1.9258 | 1.4534 |
| Global hardness (η) | 1.8681 | 2.1645 |
| Global softness (S) | 0.9340 | 1.0823 |
| Electronegativity (χ) | −3.7938 | −3.6179 |
| Electrophilicity index (ω) | 3.7938 | 3.6179 |
| Chemical potential (μ) | −3.8524 | −3.0236 |
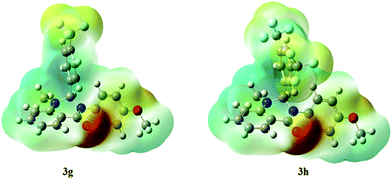
The molecular electrostatic potential surfaces show the charge distributions of molecules in three dimensions, which give clear information on the interactions of the compounds.46 The molecular electrostatic potential is useful in determining the electrophilic attack sites, nucleophilic reactions, and hydrogen-bonding interactions.47 The MEP mapped surface of the compounds 3g and 3h were computed using DFT/B3LYP at the 6-31G basis set and the MEP surface is plotted in Fig. 13. Red, blue, and green colors represent the regions of the high electronegative, high electropositive, and zero potential, respectively.48 Indeed, it is clear that in the compounds 3g and 3h, an oxygen atom (red region) and nitro groups react with electrophilic sites, and all hydrogens atoms (blue region) react with nucleophilic sites.
Conclusion
In summary, a small library of novel 2,3-disubstituted quinazolinone analogs was assessed for their antimicrobial and in vitro antitubercular activities. The results show that the MIC of some tested compounds was found to be good compared to that of reference compounds and better results were found in the case of compounds 3g and 3h. The more potent compounds 3g and 3h were docked with InhA protein. The obtained binding energy was compared and it is well correlated with in vitro anti-TB studies. Based on antimicrobial and anti-TB potency, binding interactions of compounds 3g and 3h with Ct-DNA were investigated. The findings by spectroscopic, viscometric, and electrochemical techniques revealed that these compounds have the potency to bind with Ct-DNA via a groove mode of interaction. Moreover, charge analysis, frontier molecular orbitals, hardness and softness were investigated for the molecules 3g and 3h. These types of compounds represent a promising target for future drug discovery and the development of antimicrobial and anti-TB agents.Experimental
Materials and methods
Our group had previously synthesized the 2,3-disubstituted quinazolin-4(1H)-ones molecules (3a–j) tested in the current study.23 All chemicals and solvents were of AR grade. The compounds were prepared as a stock solution using DMF. Throughout the experiments double distilled water was used. Fluorescence measurements were conducted on a flurophotometer (Varioskan Flash 4.00.53) and UV-Vis absorption spectra were recorded with a UV-Vis spectrophotometer (Systronics 118, India).Antimicrobial activity
The in vitro antimicrobial screening effects of the test compounds were individually tested against a panel of bacteria and fungi including Staphylococcus aureus (NCIM 5021), Bacillus subtilis (NCIM 2999), Pseudomonas aeruginosa (NCIM 5029), Escherichia coli (NCIM 2574), Methicillin-resistant S. aureus (MRSA)936, and Candida albicans (NCIM 3471) Microbial strains were cultured overnight at 37 °C in Nutrient and potato dextrose agar medium. All the pure microbial strains were obtained from the National Chemical Laboratory (NCL), Pune, India. The screening of antimicrobial activity and determination of minimum inhibitory concentration for the tested compounds was performed by agar disc diffusion49 and broth dilution methods,50 respectively. All the samples were conducted in triplicate and the inhibition zone was measured in millimeters. The MIC-value was determined to be the lowest compound concentration that inhibited the microorganism's macroscopic growth completely.Antitubercular activity
The in vitro activities of imidazole derivatives along with the references against Mycobacterium tuberculosis (ATCC 35801) were performed as previously described.51,52 Briefly, the MIC for the compounds were determined by an agar dilution method. The bacterial growth was measured after 28 days of incubation at 37 °C. The MIC is the concentration of the compound necessary for bacterial growth to be inhibited completely.Cytotoxicity assay
The 50% cytotoxic concentration of some compounds (3d, 3e, 3f, 3g, and 3h) towards the mammalian Vero cell line was determined by an MTT assay using the protocol of a Promega Cell Titer 96 non-radioactive cell proliferation assay kit.53 The assay measures the reduction of yellow tetrazolium (MTT) by metabolically active cells to purple formazan using spectrophotometry. After 72 h of exposure, viability was assessed based on the cellular conversion of MTT into a formazan product. Isoniazid was used as a reference drug.Molecular docking
Molecular docking analysis was performed with the UCSF Chimera software.54 The 3D structure of InhA (PDB code: 4QXM) was chosen as an ideal target protein for docking with imidazole derivatives. Naturally occurring quercetin and isoniazid were employed as standard ligands. The protein data bank (PDB) files of the crystal structure of the InhA was retrieved from the protein data bank. Regularization and optimization for the protein and ligand were performed. A grid was generated to identify xyz coordinates around the binding site of the enzyme. The docking score and H-bond interactions were estimated for all the synthesized compounds used in this study. The docked results were visualized and analyzed using Discovery Studio Visualizer.55 ADME of the synthesized derivatives was predicted from the free online server http://www.swissadme.ch.56,57DNA binding studies
Viscosity measurements
The viscosity measurements were done by using an Ostwald viscometer at a constant temperature of 25 ± 0.1 °C in a thermostatic bath. In the presence of increasing concentrations of test compounds 3g and 3h, the specific contribution of viscosity due to Ct-DNA was determined. The flow time was measured with a digital stopwatch and three replicated measurements calculated an average flow time. The resulting data is represented as (η/η0)1/3versus the binding ratio ([compound]/[DNA]), where η is the viscosity of DNA in the presence of test compound and η0 is the viscosity of DNA alone.Circular dichroism studies
CD spectra of Ct-DNA were recorded with a Chirascan spectropolarimeter in the absence and presence of test compounds 3g and 3h at room temperature. The spectra were recorded in a 1 cm cell with a wavelength range of 200–600 nm, 1 nm bandwidth with 1 nm steps, and 0.5 s time-per-point. After an average of four scans, the final CD spectrum was generated.Cyclic voltammetry
Cyclic voltammetric experiments were performed to investigate the redox behavior of test compounds using CH electrochemical analyzer in a single compartmental cell of volume 10–15 mL. A three-electrode configuration with a carbon functioning electrode, Pt-wire as an auxiliary electrode, and Ag/AgCl as the reference electrode was used. Cyclic voltammetry for test compounds 3g and 3h were carried out in the absence and presence of DNA in Tris buffer (pH 7.5). The glassy carbon electrode was polished on a nylon buffer pad with 0.3 μm alumina powder and all solutions were deaerated with high purity nitrogen.DFT studies
The compounds were optimized using the B3LYP level of theory with a 6-31G basis set without using any symmetry constraint. The optimization was performed using Gaussian 09 software59 and the Gauss view software was used to visualize the molecular structures. The HOMO–LUMO energy values are used to study the stability of the compounds. The global indexes were calculated using frontier densities and energies. Furthermore, the molecular electrostatic potential (MEP) maps were plotted to show the likely reactive species in the target compound.Conflicts of interest
The authors declare no competing financial interest.Acknowledgements
Authors are immensely express their indebtedness gratitude to the Management of BNM Institute of Technology for providing lab facilities to carry out this work. Fahad A. Alharthi extend his thanks and appreciation to Research Supporting Project (Ref: RSP-2020/160) King Saud University, Riyadh, Saudi Arabia for funding.References
- M. S. Salem, S. I. Sakr, W. M. El-Senousy and H. M. F. Madkour, Arch. Pharm., 2017, 346, 766–773 CrossRef.
- X. Cao, Z. Sun, Y. Cao, R. Wang, T. Cai, W. Chu, W. Hu and Y. Yang, J. Med. Chem., 2014, 57, 3687–3706 CrossRef CAS.
- Y. Chen, K. Yu, N. Y. Tan, R. H. Qiu, W. Liu, N. L. Luo, L. Tong, C. T. Au, Z. Q. Luo and S. F. Yin, Eur. J. Med. Chem., 2014, 79, 391–398 CrossRef CAS.
- H. A. Abuelizz, R. A. El-Dib, M. Marzouk and R. Al-Salahi, Microb. Pathog., 2018, 117, 60–67 CrossRef CAS.
- H. M. Shallal and W. A. Russu, Eur. J. Med. Chem., 2011, 46, 2043–2057 CrossRef CAS.
- R. A. Smits, M. Adami, E. P. Istyastono, O. P. Zuiderveld, C. M. E. Van Dam and F. J. J. de Kanter, J. Med. Chem., 2010, 53, 2390–2400 CrossRef CAS.
- G. Grover and S. G. Kini, Eur. J. Med. Chem., 2006, 41, 256–262 CrossRef CAS.
- I. Khan, S. Zaib, S. Batool, N. Abbas, Z. Ashraf, J. Iqbal and A. Saeed, Bioorg. Med. Chem., 2016, 24, 2361–2381 CrossRef CAS.
- E. H. Maeam, M. S. Salem and S. A. M. Al-Mabrook, Res. Chem. Intermed., 2018, 44, 2545–2559 CrossRef.
- M. Iichenko and I. Dubey, Quantum Chemical Approaches in Modeling the Structure of DNA Quadruplexes and Their Interaction with Metal Ions and Small Molecules, Application of Computational Techniques in Pharmacy and Medicine, Springer, Netherlands, 2014, p. 181 Search PubMed.
- A. Paul and S. Bhattacharya, Curr. Sci., 2012, 102, 212–231 CAS.
- J. Feigon, W. A. Denny, W. Leupin and D. R. Kearns, J. Med. Chem., 1984, 27, 450–465 CrossRef CAS.
- I. Kucukguzel, S. G. Kucukguzel, S. Rollas and M. Kiraz, Bioorg. Med. Chem. Lett., 2001, 11, 1703–1707 CrossRef CAS.
- WHO.Global Tuberculosis Report 2019. World Health Organization, https://apps.who.int/iris/handle/10665/329368.
- A. H. Diacon, A. Pym, M. Grobusch, R. Patientia, R. Rustomjee, L. Page-Shipp, C. Pistorius, R. Krause, M. Bogoshi, G. Churchyard, A. Venter, J. Allen, J. C. Palomino, T. De Marez, R. P. G. Van Heeswijk, N. Lounis, P. Meyvisch, J. Verbeeck, W. Parys, K. de Beule, K. Andries and D. F. Mc Neeley, N. Engl. J. Med., 2009, 360, 2397–2405 CrossRef CAS.
- R. Dey, S. Nandi, A. Samadder, A. Saxena and A. K. Saxena, Curr. Top. Med. Chem., 2020, 20, 2662–2680 CrossRef CAS.
- A. K. Saxena and A. Singh, Curr. Top. Med. Chem., 2019, 19, 337–355 CrossRef CAS.
- C. B. Pradeep Kumar, M. K. Prashanth, K. N. Mohana, M. B. Jagadeesha, M. S. Raghu, N. K. Lokanath and K. Yogesh Kumar, Surf. Interfaces, 2020, 18, 100446 CrossRef.
- H. N. Deepakumari, B. K. Jayanna, M. K. Prashanth, H. D. Revanasiddappa and B. Veeresh, Archive der Pharmazie Chemistry in Life Sciences, 2016, 349, 566–571 CrossRef CAS.
- M. K. Prashanth and H. D. Revanasiddappa, Lett. Drug Des. Discovery, 2014, 11, 712–720 CrossRef CAS.
- M. K. Prashanth, M. Madaiah, H. D. Revanasiddappa and B. Veeresh, Spectrochim. Acta, Part A, 2013, 110, 324–332 CrossRef CAS.
- M. K. Prashanth and H. D. Revanasiddappa, Med. Chem. Res., 2013, 22, 2665–2676 CrossRef CAS.
- M. S. Raghu, K. N. N. Prasad, B. K. Jayanna, C. B. Pradeep Kumar, K. Yogesh Kumar and M. K. Prashanth, Vietnam J. Chem., 2019, 57, 585–594 CrossRef CAS.
- S. Poonam and A. D. Westwell, J. Enzyme Inhib. Med. Chem., 2007, 22, 527–540 CrossRef.
- C. Vilcheze, J. Jacobs and R. William, Annu. Rev. Microbiol., 2007, 61, 35–50 CrossRef CAS.
- C. A. Lipinski, F. Lombardo, B. W. Dominy and P. J. Feeney, Adv. Drug Delivery Rev., 2012, 64, 4–17 CrossRef.
- A. Daina, O. Michielin and V. Zoete, Sci. Rep., 2017, 7, 42717 CrossRef.
- A. Chakrabortya, A. K. Pandab, R. Ghosha and A. Biswas, Arch. Biochem. Biophys., 2019, 665, 107–113 CrossRef.
- A. Chakraborty, A. K. Panda, R. Ghosh, I. Roy and A. Biswas, Int. J. Biol. Macromol., 2019, 127, 187–196 CrossRef CAS.
- Y. J. Sun, R. T. Liu, Z. X. Chi, P. F. Qin, X. Y. Fang and Y. Mou, J. Biochem. Mol. Toxic., 2010, 24, 323–329 CrossRef CAS.
- G. Zhang, X. Huand and P. Fu, J. Photochem. Photobiol., B, 2012, 108, 53–61 CrossRef CAS.
- L. Xia, Z. Wenying, H. Qi and N. Kuny, J. Photochem. Photobiol., B, 2008, 93, 172–176 CrossRef.
- S. Das and G. S. Kumar, J. Mol. Struct., 2008, 872, 56–63 CrossRef CAS.
- D. Sahoo, P. Bhattacharya and S. Chakravorti, J. Phys. Chem. B, 2010, 114, 2044–2050 CrossRef CAS.
- Y. Rahman, S. Afrin, M. A. Husain, T. Sarwar, A. A. Shamsuzzaman and M. Tabish, Arch. Biochem. Biophys., 2017, 625-626, 1–12 CrossRef CAS.
- R. Hajin, E. Ekhlasi and R. Daneshvar, Eur. J. Chem., 2012, 9, 1587–1598 Search PubMed.
- M. T. Carter, M. Rodriguez and A. J. Bard, J. Am. Chem. Soc., 1989, 111, 8901–8911 CrossRef CAS.
- M. Sirajuddin, S. Ali and A. Badshah, J. Photochem. Photobiol., B, 2013, 124, 1–19 CrossRef CAS.
- C. S. Liu, H. Zhang, R. Chen, X. S. Shi, X. H. Buand and M. Yang, Chem. Pharm. Bull., 2007, 55, 996–1001 CrossRef CAS.
- S. Gunasekaran, R. A. Balaji, S. Kumeresan, G. Anand and S. Srinivasan, Can. J. Anal. Sci. Spectrosc., 2008, 53, 149–162 CAS.
- A. Rauk, Orbital Interaction Theory of Organic Chemistry, 2nd edn, John Wiley & Sons, New York, 2001, p. 34 Search PubMed.
- G. M. Abu El-Reash, O. A. El-Gammal, S. E. Ghazy and A. H. Radwan, Spectrochim. Acta, Part A, 2013, 104, 26–34 CrossRef CAS.
- R. G. Pearson, Acc. Chem. Res., 1993, 26, 250–255 CrossRef CAS.
- M. Govindarajan, M. Karabacak, S. Periandy and D. Tanuja, Spectrochim. Acta, Part A, 2012, 97, 231–245 CrossRef CAS.
- R. Parthasarathi, J. Padmanabhan, U. Sarkar, B. Maiti, V. Subramanian and P. K. Chattaraj, J. Mol. Des., 2003, 2, 798–813 CAS.
- I. Alkorta and J. J. Perez, Int. J. Quantum Chem., 1996, 57, 123–135 CrossRef CAS.
- P. Politzer and J. S. Murray, Theor. Chem. Acc., 2002, 108, 134–142 Search PubMed.
- F. J. Luque, M. Orozco, P. K. Bhadane and S. R. Gadre, J. Phys. Chem., 1993, 97, 9380–9384 CrossRef CAS.
- S. H. Gillespie, Medical Microbiology-Illustrated, Butterworth Heinemann Ltd, UK, 1994, p. 234 Search PubMed.
- R. N. Jones, A. L. Barry, T. L. Gaven, J. A. Washington, E. H. Lennette, A. Balows and W. J. Shadomy, Manual of Clinical Microbiology, American Society for Microbiology, Washington DC, 4th edn, 1984, p. 972 Search PubMed.
- M. Madaiah, M. K. Prashanth, H. D. Revanasiddappa and B. Veeresh, New J. Chem., 2016, 40, 9191–9204 RSC.
- M. S. Raghu, C. B. Pradeep Kumar, K. N. N. Prasad, M. K. Prashanth, K. Yogesh Kumar, S. Chandrasekhar and B. Veeresh, ACS Comb. Sci., 2020, 22, 509–518 CrossRef CAS.
- L. L. Gundersen, J. Nissen-Meyer and B. Spilsberg, J. Med. Chem., 2002, 45, 1383–1386 CrossRef CAS.
- E. F. Pettersen, T. D. Goddard, C. C. Huang, G. S. Couch, D. M. Greenblatt, E. C. Meng and T. E. Ferrin, J. Comput. Chem., 2004, 25, 1605–1612 CrossRef CAS.
- Discovery Studio Visualization, http://accelrys.com/products/collaborativescience/biovia-discovery-studio/visualization-download.php.
- A. Daina, O. Michielin and V. Zoete, J. Chem. Inf. Model., 2014, 54, 3284–3301 CrossRef CAS.
- A. Daina, O. Michielin and V. Zoete, Chem. Med. Chem., 2016, 11, 1117–1121 CrossRef CAS.
- J. Kumaramangalam, A. Yuvaraj, N. S. P. Bhuvanesh, P. T. Perumal, A. Sreekantha and K. Ramasamy, Inorg. Chem. Front., 2015, 2, 780–798 RSC.
- M. Frisch, G. Trucks, H. Schlegel, G. Scuseria, M. Robb, J. Cheeseman,G. Scalmani, V. Barone, B. Mennucci and G. Petersson, Gaussian 09, RevisionA. 02, Gaussian, Inc, Wallingford, CT, 2009 Search PubMed.
| This journal is © The Royal Society of Chemistry and the Centre National de la Recherche Scientifique 2021 |

