Highly dispersed Pt species anchored onto NH2-Ce-MOFs and their derived mesoporous catalysts for CO oxidation†
Zeyi
Guo
a,
Qi
You
a,
Lianghao
Song
b,
Guoxin
Sun
 b,
Guozhu
Chen
 *b,
Cuncheng
Li
 b,
Xianfeng
Yang
c,
Xun
Hu
 d and
Xuchuan
Jiang
 *a
*a
aInstitute for Smart Materials & Engineering, University of Jinan, Jinan 250022, P.R. China. E-mail: ism_jiangxc@ujn.edu.cn
bSchool of Chemistry and Chemical Engineering, University of Jinan, Jinan 250022, P.R. China. E-mail: chm_chengz@ujn.edu.cn
cAnalytical and Testing Center, South China University of Technology, Guangzhou 510640, P.R. China
dSchool of material science and engineering, University of Jinan, Shandong province 255022, China
First published on 14th October 2020
Abstract
Simultaneously maximizing the dispersion of noble metals and demonstrating optimal activity are of significant importance for designing stable metal catalysts. In this study, highly dispersed ultrafine platinum (Pt) particles with a size of <1.5 nm anchored onto a mesoporous CeO2 structure have been synthesized by coordinating Pt ions with amino groups in NH2-Ce-MOFs, followed by high-temperature calcination. It was found that the presence of –NH2 groups in Ce-MOFs played a crucial role in anchoring Pt species with high dispersion on the MOF framework. Interestingly, the anchored Pt species were beneficial for the formation of Ce–Pt sites during the conversion from Ce-BDC to CeO2. As a result, the as-prepared catalysts held dense surface peroxo species, responsible for boosting CO oxidation at low temperatures.
Introduction
Platinum/ceria (Pt/CeO2) nanocomposites have been extensively studied in various catalytic reactions because of the high oxygen storage capacity of CeO2 and excellent intrinsic catalytic activity of Pt species, as well as their synergistic effect in catalytic processes.1–10 To date, numerous researchers have developed various methods to prepare Pt/CeO2 catalysts, such as the impregnation method,11,12 deposition-precipitation method,13 and co-precipitation method.14 Although many efforts have been devoted to regulating the structures/compositions to improve the Pt/CeO2 catalytic activities, the development of an ideal catalyst with unique features, including the mesoporous structure and well-dispersed Pt species, is still challenging and important for optimizing their catalytic performance.Recently, how to maximize the utilization of noble metals in catalysts by means of ultrafine dispersion (even atomic dispersion) has attracted increasing attention.15,16 Unfortunately, with the decrease of the noble metal particle size, the drastically increased surface free energy will make the highly-dispersed small metal particles or clusters very energetic and active, thus leading to their aggregation/sintering which may reduce their catalytic activity to some extent. To further address this issue, various strategies have been proposed to stabilize ultrafine noble metal particles. For example, Pd nanoparticles were stabilized through a rattle-type Pd/ZnO@hollow ZIF-8 structure, where the outer ZIF-8 shell protected the catalytically active Pd nanoparticles from poisoning and leaching, giving rise to excellent stability.17 Cheng et al. prepared Pd@CeO2 core–shell nanotube catalysts using multi-walled carbon nanotubes as a sacrificial template, in which the noble metal nanoparticles were preserved at high dispersion due to physical confinement and interaction confinement, even after being treated at a high temperature.18 Our group has obtained ultra-small Pt particles embedded into CeO2 nanotubes by an interfacial reaction between Ce(OH)CO3 nanorods and NaOH. During the interfacial reaction, the negatively charged Pt species electrostatically attracted to gradually form Ce(OH)3 were responsible for the homogeneous mixture of Pt and CeO2.19 Considering that the mesoporous structure is beneficial for the diffusion of reactants, it is thus more promising to explore alternative and effective strategies to prepare ultrafine Pt particles anchored onto the mesoporous structured CeO2.
Metal–organic frameworks (MOFs), with rich porosities, diverse topological structures and multiple possibilities being functionalized, have attracted much attention for catalyst preparation.20–24 Upon calcination, the MOFs were demonstrated to be a good precursor candidate for the synthesis of metal oxides, in which the MOF-derived metal oxides inherit high porosity and large surface area. Importantly, with the assistance of the uncoordinated atoms in MOFs, noble metal ions could be anchored onto MOFs for generating a high dispersion of noble metal nanoparticles after reduction or calcination. For instance, the uncoordinated N atoms present in the zirconium-porphyrinic MOFs were found to coordinate with noble metal (Ir, Pt, Ru, Au, and Pd) ions; the single noble metal atom was dispersed evenly on the MOF support after suitable reduction.25 The Li group obtained a N-doped carbon supported single Ru atom catalyst by the pyrolysis of Ru3+/Zr-MOFs. They found that the free amino (–NH2) group at the MOF skeleton coordinating with Ru3+ played a key role in the formation of a single Ru atom.26 Although Pt/CeO2 composites and the noble metal particles supported on MOF-derived metal oxides have been reported, catalysts with ultrafine Pt particles supported on CeO2 derived from Ce-MOFs have not been reported yet. Therefore, it is desirable to extend this strategy to design ultrafine Pt particles that could anchor onto mesoporous CeO2, particularly assisted by –NH2 functionalized Ce-MOFs.
In this work, we have prepared –NH2 functionalized Ce-BDC (BDC = 1,4-benzenedicarboxylate) in order to anchor Pt species onto NH2-Ce-BDC by the coordination of Pt with –NH2. After pyrolysis and hydrogen reduction, the catalyst with ultrafine Pt nanoparticles anchored onto porous CeO2 was obtained successfully. The high dispersion of ultrafine Pt nanoparticles was verified by HAADF-STEM and XPS characterization. Because of the higher dispersion of Pt species and the existence of Ce–Pt sites and the resultant surface peroxo species, the as-prepared ultrafine Pt/CeO2 catalyst exhibits superior catalytic activity (e.g. T50 = 60 °C) in comparison with the one prepared from NH2-Ce-BDC by the impregnation method. The relationship between the structure and the catalytic performance of Pt/CeO2 nanostructures and the mechanistic fundamentals will be investigated and discussed in detail.
Experimental section
Materials
All chemicals used in this work were of analytical grade, and were used without further purification treatment. Sodium hydroxide (NaOH), hexachloroplatinic acid hexahydrate (H2PtCl6·6H2O) and cerium chloride heptahydrate (CeCl3·7H2O) were purchased from Sinopharm Chemical Reagent Co. Ltd. 2-Aminotropic acid (NH2-BDC) and terephthalic acid (H2BDC) were purchased from Macklin.Synthesis of NH2-Ce-BDC
The synthesis of NH2-Ce-BDC was carried out according to the method reported in the literature, with minor modification.27 In a typical procedure, 550 mg of NH2-BDC was dispersed in 110 mL of deionized water, followed by adjusting the pH value to 5–6 using 0.1 M NaOH aqueous solution. Then 484 mg of CeCl3·7H2O was added to the solution, which was kept for 40 min after shaking for several seconds. Finally, the precipitate of NH2-Ce-BDC was obtained after centrifugation and washing in sequence, and drying at 70 °C.Introducing Pt into NH2-Ce-BDC (or Ce-BDC)
100 mg of NH2-Ce-BDC (or Ce-BDC) was dispersed in 20 mL of deionized water and ultrasonicated for 3–5 min to obtain a homogeneous solution, and then 0.18 mL of H2PtCl6·6H2O (1 g·100 mL−1) was added into the solution. The solid samples were separated by centrifugation after reaction at 80 °C for 12 h. Finally, Pt ions anchored onto NH2-Ce-BDC (or Ce-BDC) were prepared, followed by washing three times with water, and drying at 80 °C overnight before any further characterization.Synthesis of N-Pt/CeO2
The as-prepared Pt-decorated NH2-Ce-BDC was placed in a muffle furnace and calcined at 500 °C for 2 h (heating rate: 5 °C min−1) under air. Then the sample was reduced under a H2 atmosphere at 300 °C for 2 h (heating rate: 5 °C min−1). For convenience, this sample was denoted as N-Pt/CeO2.Synthesis of IM-Pt/CeO2
The IM-Pt/CeO2 catalyst was prepared by the impregnation method. The loading amount of Pt was determined by the N-Pt/CeO2 sample. Specifically, the as-prepared NH2-Ce-BDC sample was calcined at 500 °C for 2 h (heating rate: 5 °C min−1) to convert into CeO2. Then, 200 mg of the as-prepared CeO2 was mixed with 5 mL of water, and 0.79 mL of H2PtCl6·6H2O (1 g·100 mL−1) was added, followed by vigorous stirring to obtain a homogeneous mixture. After drying at 80 °C for a few hours, the sample was then calcined at 300 °C for 2 h (heating rate: 5 °C min−1) under air, followed by reduction with H2 (reduction conditions: 300 °C, 2 h, 5 °C min−1). For convenience, this sample was denoted as IM-Pt/CeO2.Sample characterization
The as-prepared samples were characterized by X-ray powder diffraction (XRD) using a Japan Rigaku D/Max-RB rotating anode X-ray diffractometer (Cu Kα radiation, λ = 1.54178 Å). The structure and morphology of the samples were studied using a scanning electron microscope (SEM, Regulus 8100, Hitachi, Japan), a transmission electron microscope (JEOL, JEM 2100F) equipped with an annular dark-field detector and an energy dispersive X-ray spectrometer (EDS). The surface chemical valence states of the samples were characterized using a X-ray photoelectron spectrometer (XPS) with Al Kα radiation. The specific surface area was measured by the Brunauer–Emmett–Teller (BET) method, using a Micromeritics Tristar II 3020 instrument (test temperature: −196 °C). Before the BET test, all the samples were degassed at 150 °C for over 8 h (N2 atmosphere). The pore size distribution was determined by the BJH method using the N2 adsorption data. Fourier transform infrared (FT-IR) spectroscopy was used to analyze the samples, and the analysis was carried out using pressed KBr disks in the range of 4000–500 cm−1. Raman spectroscopy measurements were performed using a LabRAM HR800 spectrometer equipped with an excitation laser of 532 nm. The loading of Pt in the samples was determined by ICP-MS using a Thermo Scientific XSeries-2 system. The in situ DRIFTS characterization was performed on a Bruker Tensor II FT-IR spectrometer. A CaF2 window was selected as the diffuse reflection cell of the in situ diffuse infrared spectroscopy system. The in situ DRIFTS characterization was carried out at 110 °C; the gas flow rate was 50 mL min−1. The CO adsorption was carried out under a 1 vol% CO/N2 atmosphere. Before the test, the samples were activated at 300 °C for 30 min under a 10 vol% O2/N2 atmosphere.Catalyst tests
Catalytic activity was studied using a continuous flow fixed-bed micro-reactor at atmospheric pressure. In a typical procedure, the system was first purged with high purity N2 gas and then a gas mixture of CO/O2/N2 (1![[thin space (1/6-em)]](https://www.rsc.org/images/entities/char_2009.gif) :
:![[thin space (1/6-em)]](https://www.rsc.org/images/entities/char_2009.gif) 10
10![[thin space (1/6-em)]](https://www.rsc.org/images/entities/char_2009.gif) :
:![[thin space (1/6-em)]](https://www.rsc.org/images/entities/char_2009.gif) 89) was introduced into the reactor, which contained 50 mg of samples, at a flow rate of 50 mL min−1 (weight hourly space velocity (WHSV): 60
89) was introduced into the reactor, which contained 50 mg of samples, at a flow rate of 50 mL min−1 (weight hourly space velocity (WHSV): 60![[thin space (1/6-em)]](https://www.rsc.org/images/entities/char_2009.gif) 000 mL g−1 h−1; temperature ramping rate: 2 °C min−1). Gas samples were analyzed using an online infrared gas analyzer (Gasboard-3100, China Wuhan Cubic Co.).
000 mL g−1 h−1; temperature ramping rate: 2 °C min−1). Gas samples were analyzed using an online infrared gas analyzer (Gasboard-3100, China Wuhan Cubic Co.).
Results and discussion
Firstly, XRD was used to characterize the phase and structure of the as-prepared samples. As shown in Fig. 1a, the diffraction peaks of the as-prepared NH2-Ce-BDC are consistent with those reported in the literature,27 suggesting the successful preparation of NH2-Ce-BDC. After the introduction of Pt ions, there is no obvious effect on the structure of NH2-Ce-BDC. Upon calcination at 500 °C, as expected, the NH2-Ce-BDC was converted entirely into CeO2, as shown in Fig. 1b, and its diffraction peaks are all consistent with the face-centered cubic phase (JCPDS no. 34-0394). However, it was hard to detect the diffraction peaks of Pt in both the N-Pt/CeO2 and IM-Pt/CeO2 samples, probably due to the poor crystallinity, small crystal size and/or low loading amount of Pt species.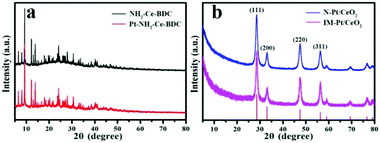 | ||
| Fig. 1 XRD patterns of (a) NH2-Ce-BDC and Pt-decorated NH2-Ce-BDC, and (b) N-Pt/CeO2 and IM-Pt/CeO2 samples. | ||
The size, morphology and surface structure of NH2-Ce-BDC, N-Pt/CeO2 and IM-Pt/CeO2 were characterized by SEM measurement. As shown in Fig. 2a and d, most of the NH2-Ce-BDC particles exhibit a regular cubic shape with a relatively smooth surface. After incorporation of Pt ions and calcination at 500 °C for 2 h, both the obtained N-Pt/CeO2 and IM-Pt/CeO2 samples still maintained the cubic morphology of NH2-Ce-BDC (Fig. 2b, c, e and f). This result was also confirmed by TEM characterization (Fig. S1†). Impressively, a significant porous structure can be observed on the surface of these two samples. It is generally recognized that the porous structure was caused by the removal of organic ligands and the retention of the initial pore structure in NH2-Ce-BDC during the calcination process.
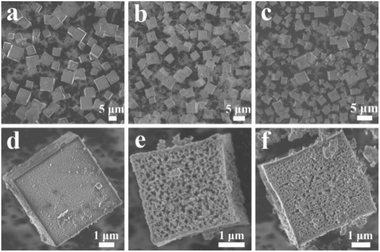 | ||
| Fig. 2 SEM images of the samples: (a and d) NH2-Ce-BDC, (b and e) N-Pt/CeO2, and (c and f) IM-Pt/CeO2. | ||
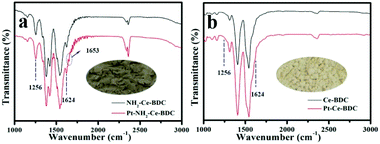
FT-IR characterization was performed to investigate whether there exist an interaction between –NH2 and Pt. According to the literature, the peaks located at ∼3436 and ∼3360 cm−1 in the FT-IR spectra could be assigned to the stretching vibration of the –NH2 group, while the peaks at ∼1260 and ∼1624 cm−1 were assigned to the C–N stretching vibration and N–H scissoring vibration, respectively.28–31 The peaks centred at ∼1541 and ∼1380 cm−1 could be ascribed to carbonyl asymmetric and symmetric stretching vibrations, respectively.29,32,33 As shown in Fig. 3a and b, the appearance of the FT-IR characteristic peaks of the C–N stretching vibration (1256 cm−1) and the N–H scissoring vibration (1624 cm−1) in NH2-Ce-BDC is a good proof of the existence of amino groups, while these vibration peaks do not exist in Ce-BDC.34 After introducing Pt ions, the peak intensities of the C–N stretching vibration and the N–H scissoring vibration in NH2-Ce-BDC decreased slightly. This peak intensity change usually implies an interaction between Pt and –NH2.34 Although the peak intensity change is not obvious due to the low Pt loading, the new peak at 1653 cm−1 split from the N–H scissoring vibration is another evidence of the interaction between Pt and –NH2 (Fig. S2a†). In comparison, under the same reaction conditions, the FT-IR spectrum of Ce-BDC, without the –NH2 group, does not change before and after introducing Pt ions. Moreover, as shown in the DRIFT spectrum (Fig. S2b†), after introducing Pt ions, the intensities of both the N–H asymmetric and symmetric stretching vibration peaks changed obviously, along with a red shift from 3481 and 3366 cm−1 assigned to NH2-Ce-BDC to 3478 and 3365 cm−1 assigned to Pt-NH2-Ce-BDC. These results confirmed that there is a coordination between –NH2 and Pt ions for Pt-NH2-Ce-BDC.34 After calcination, NH2-Ce-BDC was transformed into ceria, accompanied by a significant change in the FT-IR spectrum. The introduction of Pt had no effect on the FT-IR spectrum of the ceria derived from NH2-Ce-BDC (Fig. S3†). The color of the N-Pt/CeO2 derived from Pt-NH2-Ce-BDC became darker than the one derived from Pt-Ce-BDC (insets in a & b). ICP-MS analysis showed that the loading amount of Pt in the Pt/CeO2 derived from the Pt-NH2-Ce-BDC and Pt-Ce-BDC samples is 1.33 and 0.05 wt%, respectively. Clearly, the –NH2 groups in NH2-Ce-BDC acted as anchoring sites for Pt ions, and thus are highly beneficial for the introduction of Pt into the mesoporous CeO2 nanostructure.
The as-prepared samples were further characterized by HAADF-STEM to determine the structure of the tested sample and Pt distribution. As shown in Fig. 4a and g, both the N-Pt/CeO2 and IM-Pt/CeO2 samples show a cubic-like morphology with a porous structure, well consistent with the observation in the SEM images. Interestingly, the sensitivity to atomic number Z-contrast of the magnified HAADF-STEM image revealed that there are a number of bright spots in the N-Pt/CeO2 sample. These highly dispersed bright spots with a size of <1.5 nm could be ascribed to Pt particles (Fig. 4b). In comparison, the size of Pt particles in the IM-Pt/CeO2 sample is between 2.0 nm and 3.5 nm (Fig. 4h). Although the Pt particles are not highly uniform in these two samples, the size of Pt in IM-Pt/CeO2 is obviously larger than that of Pt in N-Pt/CeO2. The interlayer spacings shown in the HRTEM image were found to be ∼0.31 nm and ∼0.27 nm, which could be indexed to the (111) and (200) crystal planes of CeO2 (Fig. 4c and i), respectively. No lattice spacings corresponding to Pt particles were found, indicating their small particle size and/or low crystallinity. Through the elemental mapping of these two samples (Fig. 4d–f and j–l), it can be found that the Pt, Ce and O elements in these two samples were uniformly distributed. The ultra-small size and high dispersion of Pt particles in the N-Pt/CeO2 sample are expected to be favorable for catalytic reactions.
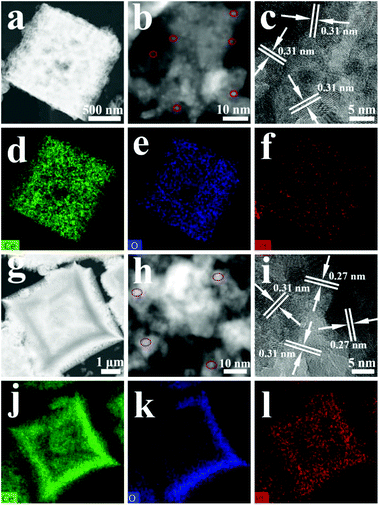 | ||
| Fig. 4 HAADF-STEM (a and b), HRTEM (c), and elemental-mapping (d–f) images of N-Pt/CeO2, and the images (g–l) corresponding to IM-Pt/CeO2. | ||
To study the catalytic performance of the as-prepared catalysts, the CO oxidation reaction was chosen as a model reaction to evaluate the performance of the as-prepared N-Pt/CeO2 and IM-Pt/CeO2 catalysts. The ICP-MS results showed that the loading of Pt in the IM-Pt/CeO2 and N-Pt/CeO2 catalysts was around 1.39 wt% and 1.33 wt%, respectively. As shown in Fig. 5a, the catalytic activity of N-Pt/CeO2 is superior to that of IM-Pt/CeO2. Specifically, the CO conversion reaches 100% at ∼110 °C for the N-Pt/CeO2 catalyst, while the CO conversion is only ∼2% at the same temperature for the IM-Pt/CeO2 catalyst. Even when the reaction temperature was increased to 250 °C, the CO conversion for the IM-Pt/CeO2 catalyst is less than 50%. In addition, the N-Pt/CeO2 catalyst shows excellent stability, evidenced by the fact that the catalytic activity still remains 100% conversion at 110 °C after 5 cycles (Fig. 5b). It is clear that the catalytic activity toward CO oxidation is highly related to O2 concentration. To further confirm the advantageous structure of N-Pt/CeO2, we tested the CO oxidation experiment at low O2 concentrations (3% and 5% O2). As shown in Fig. S4a,† even if the O2 concentration was reduced to 3%, our catalyst still exhibits good catalytic performance with T50 < 80 °C. At the same time, the activation energy (Ea) and reaction rate of the two catalysts for the CO oxidation reaction were calculated according to the Arrhenius equation. According to the calculation results (Fig. S4b†), the N-Pt/CeO2 catalyst has a lower activation energy and a higher reaction rate (N-Pt/CeO2: Ea = 56.12 kJ mol−1, R(100 °C) = 0.0936 molCO molPt−1 s−1; IM-Pt/CeO2: Ea = 67.09 kJ mol−1, R(100 °C) = 0.0022 molCO molPt−1 s−1). Compared with the reported catalysts, the N-Pt/CeO2 catalyst synthesized in this work still has advantages in the catalytic performance of the CO oxidation reaction (Table S1†).
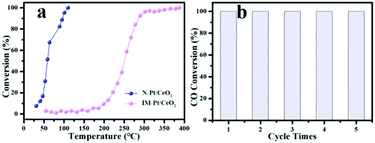 | ||
Fig. 5 (a) CO conversion as a function of temperature for the N-Pt/CeO2 and IM-Pt/CeO2 catalysts, and (b) catalytic cycles of N-Pt/CeO2 (CO/O2/N2 (1![[thin space (1/6-em)]](https://www.rsc.org/images/entities/char_2009.gif) : :![[thin space (1/6-em)]](https://www.rsc.org/images/entities/char_2009.gif) 10 10![[thin space (1/6-em)]](https://www.rsc.org/images/entities/char_2009.gif) : :![[thin space (1/6-em)]](https://www.rsc.org/images/entities/char_2009.gif) 89), total flow rate: 50 mL min−1). 89), total flow rate: 50 mL min−1). | ||
It is well known that the specific surface area and pore size distribution of the catalyst have an important effect on its catalytic performance. The BET surface area was calculated and compared in this work. Based on the N2 adsorption–desorption isotherms (Fig. 6a), the BET surface area of pure CeO2 derived from NH2-Ce-BDC was calculated to be about 59.8 m2 g−1. In contrast, upon the incorporation with Pt, the BET surface areas of N-Pt/CeO2 and IM-Pt/CeO2 are 63.7 and 57.5 m2 g−1, respectively. In addition, there is no significant difference in the pore size and size distribution (Fig. 6b). This is reasonable since both CeO2 supports are derived from the same NH2-Ce-BDC precursor, and the low loading of Pt (∼1.3 wt%) has little effect on blocking the pores in CeO2. Thus, the specific surface area and pore structure are not the main factors determining the difference in the catalytic performance of these two Pt/CeO2 catalysts.
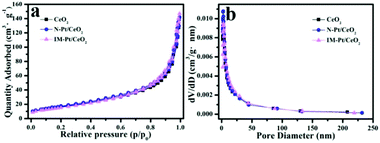 | ||
| Fig. 6 (a) N2 adsorption–desorption isotherms, and (b) pore size distribution curves for pure CeO2 derived from the NH2-Ce-BDC, N-Pt/CeO2 and IM-Pt/CeO2 samples. | ||
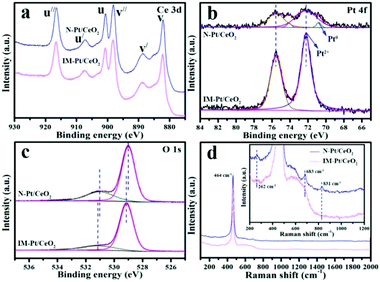
XPS characterization was performed to study the surface composition and elemental chemical states of the catalysts. The data were calibrated with standard peaks of C 1s (284.6 eV). As shown in Fig. 7a, the peaks centred at v (882.2 eV), v′ (888.7 eV), v′′ (898.1 eV), u (900.7 eV), u′ (907.4 eV), and u′′ (916.6 eV) are characteristic of Ce(IV). No significant characteristic peak of Ce(III) was observed, indicating that Ce is mainly present in the form of Ce(IV) in these two catalysts. From the Pt 4f spectrum (Fig. 7b), the peaks of the N-Pt/CeO2 catalyst can be deconvoluted into four contribution peaks. The peaks centred at ∼70.8 eV and ∼72.2 eV are characteristic peaks of Pt0 and Pt2+, respectively.35–37 Clearly, a small amount of Pt0 and Pt2+ species is present in the N-Pt/CeO2 catalyst, while only the Pt2+ species is present in the IM-Pt/CeO2 catalyst, which is well consistent with the H2-TPR result (Fig. S5†). Impressively, compared with the IM-Pt/CeO2 catalyst, the N-Pt/CeO2 catalyst has a weaker Pt 4f XPS signal, which further indicates the high dispersion of Pt species on the catalyst surface.38 In the case of the O 1s spectrum (Fig. 7c), the peaks centred at ∼529.0 eV and ∼531.0 eV could be assigned to the lattice oxygen and surface oxygen species, respectively. Calculated from the peak area, the percentage of the surface oxygen species for the N-Pt/CeO2 and IM-Pt/CeO2 catalysts is 25.9% and 19.5%, respectively.
Raman spectroscopy is another effective technique to study the structure of catalysts. As shown in Fig. 7d, the peak centred at ∼464 cm−1 in both the samples could be attributed to the characteristic peak of the triply degenerate F2g symmetric vibration (Ce–O–Ce stretching). Interestingly, the peaks centred at ∼262, ∼683 and ∼831 cm−1 are present in N-Pt/CeO2, while these peaks are negligible in the case of IM-Pt/CeO2 (inset in Fig. 7d). These peaks are associated with the formation of Frenkel-type oxygen defect sites and surface peroxo (O22−) species, which is assigned to the O–O stretching vibration of dioxygen species bound to two-electron defects on the CeO2 surface.39 This demonstrates that the densities of coordinatively unsaturated Ce sites and surface peroxo species over N-Pt/CeO2 are much higher than those in IM-Pt/CeO2.40
To reveal the active sites of the N-Pt/CeO2 and IM-Pt/CeO2 catalysts in CO oxidation catalytic reactions, the in situ DRIFTS analysis was performed in a “CO-N2” mode at 110 °C. According to the literature, the characteristic peaks of CO2 were centred at ∼2362 and ∼2335 cm−1. As shown in Fig. 8(a and b), the peak positioned at ∼2172 cm−1 is attributed to CO adsorption on Ce4+ in the CO adsorption process. It is noted that there is one dominant vibrational mode at ∼2062 cm−1 in N-Pt/CeO2, and one at ∼2117 cm−1 in IM-Pt/CeO2. The peak located at ∼2062 cm−1 was identified as the carbonyl stretching of CO linearly occupied on the atop geometry of the Pt atom in the Pt–Ce structure,41 while the peak at ∼2117 cm−1 could be assigned to CO adsorbed on ionic Pt species.42 Both dominant peaks increase with the prolongation of time, although their intensities are different. Impressively, the signal of CO2 corresponding to the peaks at ∼2362 and ∼2335 cm−1 appeared. The increase of the CO2 signal could be attributed to the direct reaction between CO and the surface active oxygen species in the N-Pt/CeO2 catalyst via the well-known Mars–van Krevelen mechanism. Of note, the N-Pt/CeO2 catalyst presents a stronger intensity than IM-Pt/CeO2 at the maximum CO2 signal, suggesting a better CO activation ability of N-Pt/CeO2 than that of IM-Pt/CeO2. Upon purging with N2, the adsorption intensity of CO on the Pt species in both the catalysts decreased with time (Fig. 8c and d). However, for the peak at ∼2117 cm−1 in IM-Pt/CeO2, there is not much change in its intensity after CO was stopped and N2 was purged, demonstrating that CO is strongly bound to ionic Pt, consistent with previous studies.41,42
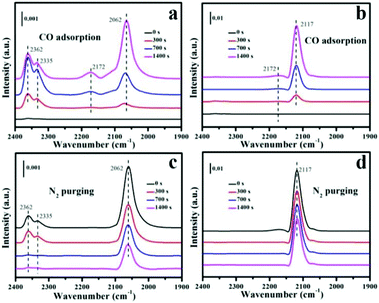 | ||
| Fig. 8 In situ DRIFT spectra of the N-Pt/CeO2 and IM-Pt/CeO2 catalysts. CO adsorption and N2 purging process of catalysts: (a and c) N-Pt/CeO2 and (b and d) IM-Pt/CeO2, respectively. | ||
Based on the above-mentioned Raman and XPS results and in situ DRIFTS analysis, we proposed that the Pt species anchored onto Ce-BDC may be beneficial for the formation of a strong interaction between Ce and Pt during the conversion from Ce-BDC to CeO2. The Pt–Ce sites in the N-Pt/CeO2 catalyst induce a relatively high density of the surface peroxo species, which are more oxidative than molecular O2, and hence boost CO oxidation under the reported conditions. However, for the IM-Pt/CeO2 catalyst, the strongly bound CO likely blocked the access of molecular O2 and made IM-Pt/CeO2 inactive.
Conclusions
In summary, we have successfully prepared CeO2 supported ultrafine Pt particles with a size of <1.5 nm. The newly developed method involves the introduction of Pt species into NH2-modified Ce-MOF through the coordination between –NH2 and Pt, followed by a thermal decomposition process. It was found that the presence of –NH2 in Ce-MOF played a key role in the introduction and dispersion of Pt species. Combining various characterization techniques, we propose that the N-Pt/CeO2 catalysts hold high density surface peroxo species, which may be the main reason for increasing CO oxidation at a low temperature. In the case of IM-Pt/CeO2, the CO strongly adsorbed on ionic Pt blocks the access of substrates, leading to its inferior catalytic performance. This work opens a new path to improve the dispersion of noble metals on CeO2 by introducing noble metal ions in/onto the Ce-MOFs modified by functional groups for better catalytic performance.Conflicts of interest
There are no conflicts to declare.Acknowledgements
The authors acknowledge the financial support from the National Natural Science Foundation of China (Grant No. 21878121), the Natural Science Foundation of Shandong Province (Grant No. ZR2018MB004), and Shandong ShenNa Smart Advanced Materials Co. Ltd.Notes and references
- T. Yu, J. Zeng, B. Lim and Y. Xia, Adv. Mater., 2010, 22, 5188–5192 CrossRef CAS.
- H.-P. Zhou, H.-S. Wu, J. Shen, A.-X. Yin, L.-D. Sun and C.-H. Yan, J. Am. Chem. Soc., 2010, 132, 4998–4999 CrossRef CAS.
- X. Wang, D. Liu, S. Song and H. Zhang, J. Am. Chem. Soc., 2013, 135, 15864–15872 CrossRef CAS.
- Y. Liu, B. Liu, Y. Liu, Q. Wang, W. Hu, P. Jing, L. Liu, S. Yu and J. Zhang, Appl. Catal., B, 2013, 142–143, 615–625 CrossRef CAS.
- C. M. Kalamaras, S. Americanou and A. M. Efstathiou, J. Catal., 2011, 279, 287–300 CrossRef CAS.
- P. Ciambelli, V. Palma and A. Ruggiero, Appl. Catal., B, 2010, 96, 190–197 CrossRef CAS.
- A. M. Ganzler, M. Casapu, F. Maurer, H. Störmer, D. Gerthsen, G. Ferre, P. Vernoux, B. Bornmann, R. Frahm, V. Murzin, M. Nachtegaal, M. Votsmeier and J.-D. Grunwaldt, ACS Catal., 2018, 8, 4800–4811 CrossRef.
- M. Yoo, Y.-S. Yu, H. Ha, S. Lee, J.-S. Choi, S. Oh, E. Kang, H. Choi, H. An, K.-S. Lee, J. Y. Park, R. Celestre, M. A. Marcus, K. Nowrouzi, D. Taube, D. A. Shapiro, W. Jung, C. Kim and H. Y. Kim, Energy Environ. Sci., 2020, 13, 1231–1239 RSC.
- A. Vita, C. Italiano, C. Fabiano, L. Pino, M. Laganà and V. Recupero, Appl. Catal., B, 2016, 199, 350–360 CrossRef CAS.
- F. Dvorak, M. F. Camellone, A. Tovt, N.-D. Tran, F. R. Negreiros, M. Vorokhta, T. Skala, I. Matolınova, J. Myslivecek, V. Matolın and S. Fabris, Nat. Commun., 2016, 7, 10801 CrossRef CAS.
- M. Mao, H. Lv, Y. Li, Y. Yang, M. Zeng, N. Li and X. Zhao, ACS Catal., 2016, 6, 418–427 CrossRef CAS.
- R. K. Singha, S. Ghosh, S. S. Acharyya, A. Yadav, A. Shukla, T. Sasaki, A. M. Venezia, C. Pendem and R. Bai, Catal. Sci. Technol., 2016, 6, 4601–4615 RSC.
- Z. Mei, Y. Li, M. Fan, L. Zhao and J. Zhao, Chem. Eng. J., 2015, 259, 293–302 CrossRef CAS.
- S. Zhang, Z. Xia, T. Ni, Z. Zhang, Y. Ma and Y. Qu, J. Catal., 2018, 359, 101–111 CrossRef CAS.
- J. Jones, H. Xiong, A. T. DeLaRiva, E. J. Peterson, H. Pham, S. R. Challa, G. Qi, S. Oh, M. H. Wiebenga, X. I. P. Hernández, Y. Wang and A. K. Datye, Science, 2016, 353, 6295 CrossRef.
- S. Wei, A. Li, J.-C. Liu, Z. Li, W. Chen, Y. Gong, Q. Zhang, W.-C. Cheong, Y. Wang, L. Zheng, H. Xiao, C. Chen, D. Wang, Q. Peng, L. Gu, X. Han, J. Li and Y. Li, Nat. Nanotechnol., 2018, 13, 856–861 CrossRef CAS.
- L. Lin, H. Liu and X. Zhang, Chem. Eng. J., 2017, 328, 124–132 CrossRef CAS.
- J. Ye, D.-G. Cheng, F. Chen and X. Zhan, Ind. Eng. Chem. Res., 2019, 58, 21972–21982 CrossRef CAS.
- Y. Wang, G. Song, Z. Xu, F. Rosei, D. Ma and G. Chen, J. Mater. Chem. A, 2016, 4, 14148–14154 RSC.
- H.-C. Zhou, J. R. Long and O. M. Yaghi, Chem. Rev., 2012, 112, 673–674 CrossRef CAS.
- J. F. Kurisingal, R. Babu, S.-H. Kim, Y. X. Li, J.-S. Chang, S. J. Cho and D.-W. Park, Catal. Sci. Technol., 2018, 8, 591–600 RSC.
- M. Zhao, K. Yuan, Y. Wang, G. Li, J. Guo, L. Gu, W. Hu, H. Zhao and Z. Tang, Nature, 2016, 539, 76 CrossRef CAS.
- S. Rojas, T. Baati, L. Njim, L. Manchego, F. Neffati, N. Abdeljelil, S. Saguem, C. Serre, M. F. Najjar, A. Zakhama and P. Horcajada, J. Am. Chem. Soc., 2018, 140, 9581–9586 CrossRef CAS.
- L. Jiao, Y. Wang, H.-L. Jiang and Q. Xu, Adv. Mater., 2018, 30, 1703663 CrossRef.
- T. He, S. Chen, B. Ni, Y. Gong, Z. Wu, L. Song, L. Gu, W. Hu and X. Wang, Angew. Chem., Int. Ed., 2018, 57, 3493–3498 CrossRef CAS.
- X. Wang, W. Chen, L. Zhang, T. Yao, W. Liu, Y. Lin, H. Ju, J. Dong, L. Zheng, W. Yan, X. Zheng, Z. Li, X. Wang, J. Yang, D. He, Y. Wang, Z. Deng, Y. Wu and Y. Li, J. Am. Chem. Soc., 2017, 139, 9419–9422 CrossRef CAS.
- P. Shi, Y. Zhang, Z. Yu and S. Zhang, Sci. Rep., 2017, 7, 6500 CrossRef.
- E. Haque, V. Lo, A. I. Minett, A. T. Harris and T. L. Church, J. Mater. Chem. A, 2014, 2, 193–203 RSC.
- Z. Jia, M. Jiang and G. Wu, Chem. Eng. J., 2017, 307, 283–290 CrossRef CAS.
- M. Karabacak, M. Cinar, Z. Unal and M. Kurt, J. Mol. Struct., 2010, 982, 22–27 CrossRef CAS.
- Z.-Q. Bai, L.-Y. Yuan, L. Zhu, Z.-R. Liu, S.-Q. Chu, L.-R. Zheng, J. Zhang, Z.-F. Chai and W.-Q. Shi, J. Mater. Chem. A, 2015, 3, 525–534 RSC.
- V. Safarifard, S. Beheshti and A. Morsali, CrystEngComm, 2015, 17, 1680–1685 RSC.
- X. Cheng, A. Zhang, K. Hou, M. Liu, Y. Wang, C. Song, G. Zhang and X. Guo, Dalton Trans., 2013, 42, 13698–13705 RSC.
- Z. Guo, C. Xiao, R. V. Maligal-Ganesh, L. Zhou, T. W. Goh, X. Li, D. Tesfagaber, A. Thiel and W. Huang, ACS Catal., 2014, 4, 1340–1348 CrossRef CAS.
- R. Peng, X. Sun, S. Li, L. Chen, M. Fu, J. Wu and D. Ye, Chem. Eng. J., 2016, 306, 1234–1246 CrossRef CAS.
- D.-M. Gu, Y.-Y. Chu, Z.-B. Wang, Z.-Z. Jiang, G.-P. Yin and Y. Liu, Appl. Catal., B, 2011, 102, 9–18 CrossRef CAS.
- A. Zhou, J. Wang, H. Wang, H. Li, J. Wang and M. Shen, J. Rare Earths, 2018, 36, 257–264 CrossRef CAS.
- P. Bera, K. R. Priolkar, A. Gayen, P. R. Sarode, M. S. Hegde, S. Emura, R. Kumashiro, V. Jayaram and G. N. Subbanna, Chem. Mater., 2003, 15, 2049–2060 CrossRef CAS.
- W. Lin, A. A. Herzing, C. J. Kiely and I. E. Wachs, J. Phys. Chem. C, 2008, 112, 5942–5951 CrossRef CAS.
- Y. Wei, Z. Zhao, J. Liu, C. Xu, G. Jiang and A. Duan, Small, 2013, 9, 3957–3963 CrossRef CAS.
- J. Li, Y. Tang, Y. Ma, Z. Zhang, F. Tao and Y. Qu, ACS Appl. Mater. Interfaces, 2018, 10, 38134–38140 CrossRef CAS.
- X. I. Pereira-Hernández, A. DeLaRiva, V. Muravev, D. Kunwar, H. Xiong, B. Sudduth, M. Engelhard, L. Kovarik, E. J. M. Hensen, Y. Wang and A. K. Datye, Nat. Commun., 2019, 10, 1–10 CrossRef.
Footnote |
| † Electronic supplementary information (ESI) available. See DOI: 10.1039/d0nr05626j |
| This journal is © The Royal Society of Chemistry 2021 |

