Hydrogen transport property of polymer-derived cobalt cation-doped amorphous silica†
Shotaro
Tada
a,
Shiori
Ando
a,
Toru
Asaka
a,
Yusuke
Daiko
 a,
Sawao
Honda
a,
Samuel
Bernard
a,
Sawao
Honda
a,
Samuel
Bernard
 b and
Yuji
Iwamoto
 *a
*a
aDepartment of Life Science and Applied Chemistry, Graduate School of Engineering, Nagoya Institute of Technology, Gokiso-cho, Showa-ku, Nagoya 466-8555, Japan. E-mail: iwamoto.yuji@nitech.ac.jp
bUniversity of Limoges, CNRS, IRCER, UMR 7315, F-87000, Limoges, France
First published on 21st October 2020
Abstract
The effect of the local structure of Co-doped amorphous silica on the hydrogen transport property was studied with the aim to improve the high-temperature hydrogen-permselectivity of microporous amorphous silica-based membranes. Co-Doped silica materials with measured Co/Si atomic ratios ranging from 0.01 to 0.18 were successfully synthesized through the polymer-derived ceramic (PDC) route. X-ray diffraction (XRD) and high-resolution transmission electron microscopy (HRTEM) analyses confirmed the amorphous state of the polymer-derived Co-doped silica, while both X-ray photoelectron and Fourier transform infrared (FT-IR) spectroscopy analyses revealed that the divalent Co cation (Co2+) modified the matrix amorphous silica network to form hydrogen-bonded silanol. After dehydration treatment at 500 °C in argon, hydrogen (H)/deuterium (D) isotope exchange behavior on the surface silanol groups (Si–OH/OD conversion) of the polymer-derived non-doped and Co-doped amorphous silica was in situ monitored by measuring diffuse reflectance infrared Fourier transform (DRIFT) spectra at 500 °C. The self-diffusion coefficient for OH/OD conversion of free silanol groups of non-doped silica was 6.1 × 10⁻¹⁵ m2 s−1, while that on the hydrogen bonded Si–OH was found to reach 15.6 × 10⁻¹⁵ m2 s−1 by Co-doping at the measured Co/Si atomic ratio of 0.05.The effect of the amount of Co2+ doping on the hydrogen transport property was further studied by scanning transmission electron microscopy and electron energy loss spectroscopy (STEM-EELS) analyses, and it was suggested that a rather small amount of Co-doping, i.e. Co/Si atomic ratio of 0.05 was effective for enhancing high-temperature hydrogen permeance through microporous amorphous silica-based membranes.
Introduction
Microporous silica membranes with molecular sieve-like properties have relatively high gas permeances, and better thermal stability in comparison with polymer membranes.1–5 Thus, they are attractive for application in membrane reactors such as in the steam-reforming reactions of natural gas5–7 and in the dehydrogenation of chemical hydrides.8–11 Recently, amorphous silica-based composite membranes including composite membranes with an oxide system such as zirconium (Zr)-doped silica (Si–Zr–O),12 nickel (Ni)-doped silica (Si–Ni–O)13 and cobalt-doped silica (Si–Co–O)14 have been investigated in order to enhance the thermal and hydrothermal stabilities of silica membranes for practical applications.In this category of materials, doping silica with Co was found to be effective for enhancing hydrogen permeance at 500 °C.15 Nanostructural characterization of the Co-doped amorphous silica-based composite membranes revealed that fine particles having a size range of approximately 5 to 20 nm were formed in situ within an amorphous silica matrix.15 The selected area electron diffraction ring patterns derived from the nanoparticles were mainly assigned to CoO and Co3O4; and metallic Co was found as a minor phase.15 These results suggested that cobalt oxide in the amorphous silica matrix plays an important role in the enhancement of hydrogen transport.
More recently, amorphous silica-based composite membranes were designed and synthesized through an alternative synthesis approach based on inorganic/organometallic polymers, namely polymer-derived ceramic (PDC) route, and their gas permeation properties were investigated. As an illustration, Co-doped ethoxy polysiloxane-derived silica membranes have been reported to show reversible gas molecular sieving property for high temperature gas separation.16 As the polysiloxanes were partly condensed silica precursors, Co-doped silica membranes were prepared by a sol–gel method without any extended hydrolysis time and acidic catalyst such as nitric acid or hydrogen peroxide. As a consequence, condensation results in cluster-cluster growth to form very open fractal structures in the polysiloxane sol–gel process.16 Thus, the proposed reversible gas molecular sieving property was derived from the alternating volume shrinkage/expansion governed by the reducing/oxidizing (redox) state change of the Co oxide particles (Co(OH)2 and CoO/Co3O4) dispersed within the amorphous silica matrix derived from ethoxy polysiloxane.16 The results also revealed that the oxidation state of Co remained II or III under the reducing conditions which is most probably related to the use of polysiloxanes as polymeric precursors. As reported previously,14,15 phase separation and subsequent crystallization of Co oxides from the ternary Si–Co–O system easily proceeds during the thermal conversion of precursors prepared through the conventional sol–gel route. This encouraged us to design Co-doped silica membrane materials via the (i) chemical modification of a non-oxidic preceramic polymer as a silica precursor with a Co source, (ii) detailed characterization of the material at each step of the process (Co-modified precursors, pyrolysis intermediates, …), (iii) investigation of the local structure located at the hetero interface between amorphous silica and Co oxide particles, (iv) study of the relationships between the atomic and/or molecular structure of the ternary amorphous Si–Co–O system and (v) measurement of its hydrogen transport property. Thus, in this study, a series of ternary Si–Co–O amorphous compounds with measured Co/Si atomic ratios ranging from 0.01 to 0.18 were successfully synthesized through the PDC route using polysilazanes as non-oxidic precursors of the silica phase and acetylacetonate precursors as the Co source. The Co-modified polysilazane was characterized in detail and then, thermo-chemically converted into Co-doped silica. The as-pyrolyzed Co-doped silica samples were chemically and structurally analyzed and hydrogen/deuterium isotope exchange behavior on the surface silanol groups of the amorphous Si–Co–O compounds was in situ monitored. The contribution of the dopant Co to accelerate hydrogen transport through microporous amorphous silica membranes was discussed.
Experimental procedure
Synthesis of polymer precursors for Co-doped amorphous silica
Commercially available perhydropolysilazane (PHPS, NN110-20, 20 wt% in xylene solution) was provided by AZ Electronic Materials Co., Ltd, Japan. 1H NMR (300 MHz, C6D6, δ/ppm): 1.6–0.3 (br, NH), 5.8–4.3 (br, SiH); IR (CsI windows/cm−1): ν(N–H) = 3374 (m), ν(Si–H) = 2125 (vs), δ(N–H): 1173 (m), δ(N–Si–N) = 1020–840 (vs). Cobalt(III)-acetylacetonate (Co(acac)3, purity >98.0%, Tokyo Chemical Industry Co., Ltd, Tokyo, Japan), and super-anhydrous toluene (99.5% purity, Wako Pure Chemical Co., Ltd, Osaka, Japan) were used as-received without further purification. The chemical modification of PHPS with Co(acac)3 was carried out under a dry argon (Ar) atmosphere using Schlenk line and glovebox techniques. The synthesis of Co-modified PHPS samples was performed according to various atomic ratios of Co in Co(acac)3 to Si in PHPS (Co/Si) = 1/8; 1/20; 1/40 and 1/80. The resulting synthesized precursors were labeled as CoPHPS1/8; CoPHPS1/20; CoPHPS1/40 and CoPHPS1/80, respectively. Here, we describe the synthesis of the CoPHPS1/8 sample which is well representative of the synthesis process applied to prepare all polymeric samples. In a typical experiment, a 100 mL two-neck round-bottom flask equipped with a magnetic stirrer was charged with as-received PHPS (5 mL, 20 wt% xylene solution) and toluene (10 mL). Co(acac)3 (1.099 g, Co/Si = 1/8) was added to the solution at room temperature. The mixture was then stirred at room temperature for 2 h followed by heating at 110 °C for additional 12 h to give the single source precursor of Co-modified PHPS (CoPHPS1/8 sample) as a gelatinous compound.Conversion to Co-doped amorphous silica
To avoid the vigorous oxidation reaction during the pyrolysis at high temperature, the Co-modified PHPS samples were oxidized at room temperature as follows: after cooling down to room temperature, the reaction mixture was poured into an aluminum tray, and rinsed with acetone, then dried at room temperature. To proceed with further oxidation, the dried residue was exposed to a vapour from aqueous ammonia (NH3) at room temperature for 24 h according to the previously reported procedure.17,18 The resulting solid precursor was ground to a fine powder using a mortar and pestle, then placed in a quartz boat and heat-treated in an electric muffle furnace (Model FUW220PA, Advantec Toyo Kaisha, Ltd, Chiba Japan) under flowing air by heating from room temperature to 600 °C in 6 h, maintaining the temperature at 600 °C for an additional 1 h, and finally furnace cooling down to room temperature to afford Co-doped amorphous silica samples labeled as CoSiO1/8; CoSiO1/20; CoSiO1/40 and CoSiO1/80, respectively.Characterization
The attenuated total reflection-infrared (ATR-IR) spectra were recorded on the as-received Co(acac)3, as-received PHPS and chemically modified PHPSs (CoPHPS1/8, CoPHPS1/20, and CoPHPS1/40) with a diamond prism under an incidence angle of 45° (Model Spectrum 100, PerkinElmer, Waltham, MA, USA).To study the effect of Co2+-doping on the hydrogen transport property on the amorphous silica surface, hydrogen (H)/deuterium (D) isotope exchange in the surface silanol groups (Si–OH/OD conversion) of the polymer-derived Co-doped amorphous silica was in situ monitored by measuring IR absorption spectroscopy adopted diffuse reflectance infra-red Fourier transform spectroscopy (DRIFTS) technique (Model Spectrum 100, PerkinElmer, Waltham, MA, USA) according to the following procedure: the Co-doped silica sample was placed within a diffuse reflection cell (Model STJ900C Diffuse IR Heat Cham, S.T. JAPAN Inc., Tokyo, Japan), and subjected to pre-drying to remove adsorbed water at 500 °C for 20 h under an argon (Ar) flow (4 mL min−1). The sample was subsequently heat-treated at 500 °C for an additional 3 h under a hydrogen flow (4 ml min−1), and the initial IR spectrum was recorded. Then, under flowing 10% deuterium (D2)/Ar (4 mL min−1) at 500 °C, the Si–OH/OD conversion was in situ monitored by measuring DRIFT spectra at a specific time interval of 1, 5, 10, 20, 30, 60, 90, 120, 150 and 180 min. After the background noise removal, the normalized absorption band intensity in each DRIFT spectrum was calculated by shifting the whole spectrum so as to make the peak intensity at 4000 cm−1 zero. Then, the time dependence on the absorption band intensities of free deuteroxyl (Si–OD) and D-bonded Si–OD in the DRIFT spectra was examined.
Elemental analyses for oxygen, nitrogen and hydrogen (inert-gas fusion method, Model EMGA-930, HORIBA, Ltd, Kyoto, Japan), and carbon (non-dispersive infrared method, Model CS844, LECO Co., St Joseph, MI, USA) were performed for the Co-doped and non-doped silica samples. The Co content in the Co-doped silica samples were analyzed by the energy dispersive X-ray spectrometer (EDS) mounted on a scanning electron microscope (SEM, Model JSM-6010LA, JEOL Ltd, Tokyo, Japan), and evaluated as Co/Si atomic ratio. The chemical compositions of the polymer-derived samples after the heat-treatment in air at 600 °C are listed in Table 1.
| Sample | Co/Si ratio (−) | Content (wt%) | |||
|---|---|---|---|---|---|
| Calc. | Obs. | Carbon | Nitrogen | Oxygen | |
| CoSiO1/80 | 0.01 | 0.01 | 0.15 | 0.07 | 45.46 |
| CoSiO1/40 | 0.03 | 0.03 | 0.07 | 0.00 | 37.74 |
| CoSiO1/20 | 0.05 | 0.05 | 0.00 | 0.20 | 41.95 |
| CoSiO1/8 | 0.13 | 0.18 | 0.07 | 0.24 | 32.37 |
Particle size distribution of the samples after heat-treatment in air at 600 °C was characterized by the laser diffraction/scattering method (Model 7995-10 SPA, Nikkiso Co., Ltd, Tokyo, Japan). The average particle size was evaluated as median diameter (D50) and is listed in Table 2.
| Sample | SiO2 | CoSiO1/80 | CosiO1/40 | CoSiO1/20 | CoSiO1/8 |
|---|---|---|---|---|---|
| D 50 (μm) | 20.10 | 21.50 | 20.44 | 23.46 | 23.30 |
X-ray diffraction (XRD) measurement was performed on the 600 °C heat-treated samples (Model X′pert Pro α1, Philips Ltd, Amsterdam, The Netherlands).
X-ray photoelectron spectroscopy (XPS) analysis was performed on the heat-treated samples (Model PHI-5000, Ulvac-phi, Kanagawa, Japan). The photoelectron binding energy was referenced to the C 1s peak (at 284.8 eV) of adventitious carbon. The peak intensity normalization of the XPS spectra was carried out by dividing all intensity at each spectrum to the peak intensity of oxygen 1s in the spectrum.
Transmission electron microscopy (TEM) observations and high-angle annular dark-field-scanning transmission electron microscopy (HAADF-STEM) observations were performed on the heat-treated powder samples (CoSiO1/20 and CoSiO1/8) in a JEOL JEM-ARM200F operated at an acceleration voltage of 200 kV. The size of the electron probe was approximately 0.1 nm. The convergent angle and the detector collection angle were 22 mrad and 68–280 mrad, respectively. Analytical investigations were carried out by electron energy loss spectroscopy (EELS) using a Gatan Quantum ERS with an incident-electron beam-energy of 200 keV.
Results and discussion
Synthesis of cobalt cation-doped amorphous silica
![[double bond, length as m-dash]](https://www.rsc.org/images/entities/char_e001.gif) O) and 1518 cm−1 (δC
O) and 1518 cm−1 (δC![[double bond, length as m-dash]](https://www.rsc.org/images/entities/char_e001.gif) C).20 In addition to the characteristic absorption bands attributed to the Si–H, N–H and Si–N–Si of PHPS, Co-modified PHPS samples exhibited a new absorption band around 930 cm−1 assigned to Si–O–Co(Fig. 1b).21 Moreover, the following changes in the spectra were detected: a new absorption band appeared around 1110 cm−1 assigned to the C–N bond,22 the C–N band intensity increased with increasing the Co/Si atomic ratio. Oppositely, the Si–H band intensity decreased with increasing the Co/Si atomic ratio. The CoPHPS1/8 sample presented absorption bands attributed to the C
C).20 In addition to the characteristic absorption bands attributed to the Si–H, N–H and Si–N–Si of PHPS, Co-modified PHPS samples exhibited a new absorption band around 930 cm−1 assigned to Si–O–Co(Fig. 1b).21 Moreover, the following changes in the spectra were detected: a new absorption band appeared around 1110 cm−1 assigned to the C–N bond,22 the C–N band intensity increased with increasing the Co/Si atomic ratio. Oppositely, the Si–H band intensity decreased with increasing the Co/Si atomic ratio. The CoPHPS1/8 sample presented absorption bands attributed to the C![[double bond, length as m-dash]](https://www.rsc.org/images/entities/char_e001.gif) O and C
O and C![[double bond, length as m-dash]](https://www.rsc.org/images/entities/char_e001.gif) C of the acac ligand. However, the detected C
C of the acac ligand. However, the detected C![[double bond, length as m-dash]](https://www.rsc.org/images/entities/char_e001.gif) O band became broader and shifted toward a higher wavenumber, which suggested that the electron density of a certain number of the C
O band became broader and shifted toward a higher wavenumber, which suggested that the electron density of a certain number of the C![[double bond, length as m-dash]](https://www.rsc.org/images/entities/char_e001.gif) O double bond increased as a result of Si–O–Co bond formation.
O double bond increased as a result of Si–O–Co bond formation.
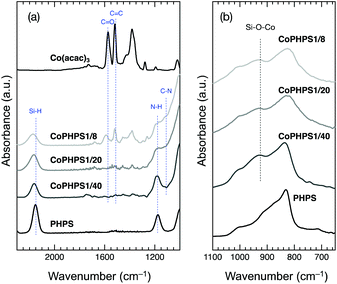 | ||
| Fig. 1 (a) ATR-IR spectra of the as-received PHPS, Co(acac)3 and typical Co-modified PHPS samples (CoPHPS1/8, CoPHPS1/20 and CoPHPS1/40 samples): 2300 to 1000 cm−1 and (b) 1100 to 650 cm−1. | ||
Based on the results obtained by the FTIR spectroscopy analysis, a possible reaction scheme for the present chemical modification of PHPS with Co(acac)3 has been suggested as shown in Fig. 2: the nucleophilic conjugate addition of the N–H group in PHPS to the acac ligand of Co(acac)3 led to the formation of enamine derivative (1) associated with the elimination of (acac)2Co–OH (2). Subsequently, Si–O–Co bond formation proceeded via the dehydrocoupling reaction between the Si–H group in PHPS and the (acac)2Co–OH formed in situ to give the Co-modified PHPS represented by a series of four precursors labeled as CoPHPS1/8, CoPHPS1/20, CoPHPS1/40 and CoPHPS1/80.
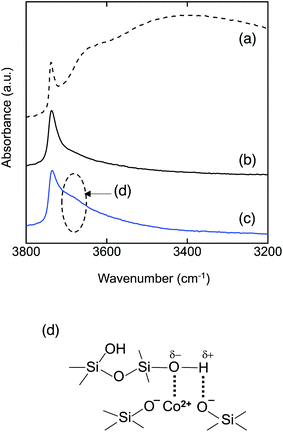
To investigate the bonding state of the sample surface, DRIFT spectra were recorded and are shown in Fig. 4. As shown in Fig. 4(a), the DRIFT spectrum of the as-synthesized amorphous silica presented a very broad absorption band around 3400 cm−1 due to adsorbed water. In order to remove the adsorbed water and to construct the surface conditions of hydrogen transport at high temperature (500 °C),15 an additional heat treatment was performed at 500 °C for 20 h under an Ar flow within the DRIFTS chamber. When the adsorbed water was removed, the spectrum presented one distinct peak at 3732 cm−1 assigned to the Si–OH group (Fig. 4(b)).26,27 As a typical result, the DRIFT spectra of the CoSiO1/80 sample after the dehydration treatment at 500 °C are shown in Fig. 4(c). In addition to the sharp adsorption band assigned to free Si–OH at 3733 cm−1, the spectrum exhibited a broad absorption band around 3690 cm−1 attributed to hydrogen (H)-bonded Si–OH groups.28,29 Such a broad absorption band was observed for all the Co-doped amorphous silica samples (Fig. S1†). This indicates that the divalent Co2+ cation modifies the amorphous silica network to form H-bonded silanol as shown in Fig. 4(d).
Si–OH/OD conversion behaviors
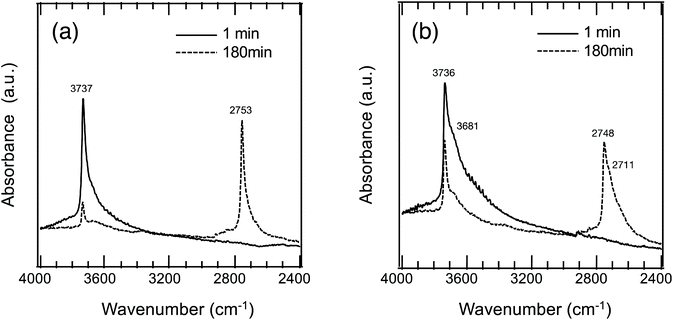
To study the hydrogen transport property, OH/OD conversion behaviors were studied for free Si–OH and H-bonded Si–OH, respectively. After the dehydration treatment at 500 °C, DRIFT spectra were recorded for all the samples at 500 °C under a 10%-D2/Ar flow at the specific time interval from 1 to 180 min. Fig. 5(a) shows the DRIFT spectra for the non-doped amorphous silica measured as a reference sample. Consistent with the D2 exposure time, the intensity of the absorption band due to the free Si–OH at 3732 cm−1 decreased, while a new band at 2752 cm−1 increased in intensity. After 180 min, the new band became dominant.Based on the detected wavenumbers of νOH and νnew as νOD, the isotope shift factor (i) was evaluated:
 | (1) |
The experimental i value was 1.356 and well consistent with the literature data (1.35–1.36).30 Thus, the new band was assigned to deuteroxyl (Si–OD). In addition to the free Si–OH, the OH/OD conversion for H-bonded Si–OH was successfully monitored for all the Co-doped samples (Fig. S1†). As a typical result, the DRIFT spectra for the CoSiO1/20 sample are shown in Fig. 5(b). As listed in Table 3, the i values evaluated for the free Si–OH and the H-bonded Si–OH were in the range of 1.356 to 1.360, and they were also compatible with the above-mentioned literature data.30
| Co-Doped SiO2 analytical Co/Si ratio (−) | Wavenumber (cm−1) | Isotopic shift factor, i | ||||
|---|---|---|---|---|---|---|
| Free OX | X-bonded OX | Free | H-bonded | |||
| OH | OD | OH | OD | |||
| 0 | 3737 | 2753 | — | — | 0.357 | — |
| 0.01 | 3733 | 2747 | 3693 | 2717 | 1.359 | 1.359 |
| 0.03 | 3732 | 2746 | 3689 | 2716 | 1.359 | 1.358 |
| 0.05 | 3736 | 2748 | 3681 | 2711 | 1.360 | 1.358 |
| 0.18 | 3735 | 2750 | 3684 | 2712 | 1.358 | 1.358 |
The OH/OD conversion behaviour was further assessed using the self-diffusion coefficient of deuterium evaluated according to the procedure reported by Fishman et al.31,32 The following equation based on Fick's second law has been derived in order to estimate the diffusion coefficient for the 18O and 16O exchange in oxide-ion conductors:
 | (2) |
In general, the surface diffusion coefficient of oxygen is much higher than the volume diffusion coefficient. For instance, in the case of LaMnO3+δ perovskite, it was found that the surface diffusion coefficient and volume diffusion coefficient were in the order of ∼10−17 m2 s−1 and ∼10−24 m2 s−1, respectively.32 In this modelling expressed in eqn (2), the summation was performed for running indices up to n = 5. This model can be applied for a very fast exchange on the surface of an oxide particle, whereby Δ is around 0.5 nm for typical oxides.33 In the present study, the self-diffusion coefficient (D) was adopted as an index of the Si–OH/OD conversion rate on the non-doped and Co-doped amorphous silica surface. The D values were evaluated for the free Si–OH and the H-bonded Si–OH and were denoted as D(Free) and D(H-bonded), respectively. The D values were estimated by detecting OD generated by exchange on the surface Si–OH group by DRIFTS analysis, and c0 in this study was renamed as cD eq (the equilibrium deuterium concentration of the sample). Moreover, in this isotope exchange reaction, the monolayer (Δ) had a nanometer scale thickness, while the radius of the sample particle synthesized in this study had approximately 10 μm (one half of D50 in Table 2), thus eqn (3) with assuming r ≫ 3Δ in eqn (2) was employed:
 | (3) |
Time dependence on the absorption band intensities of free Si–OD and D-bonded Si–OD in DRIFT spectra was fitted to the non-linear curve using eqn (3) using r as one half of D50 listed in Table 2 with two free parameters, D and cD eq.
As a typical result, Fig. 6 presents the D2 gas exposure time dependence of the absorption band intensity evaluated for the free Si–OD and the D-bonded Si–OD in the CoSiO1/20 sample.
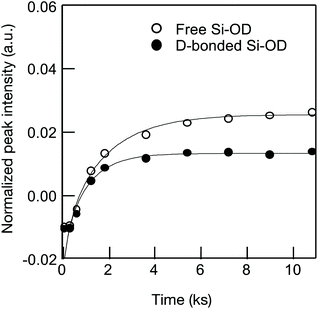 | ||
| Fig. 6 Si–OH/OD conversion of Co-doped amorphous silica with analytical Co/Si = 0.05 (CoSiO1/20 sample). | ||
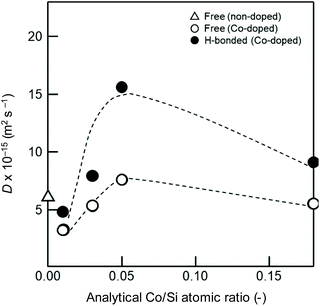
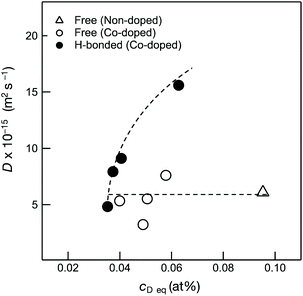
Each fitted line described the experimental data very well, suggesting that OH/OD conversions for both the free and H-bonded Si–OH investigated in this study were diffusion controlled. In the same manner, the D and cD eq were evaluated for both free and H-bonded Si–OH in the Co-doped amorphous silica samples (Fig. SI2†), and the results are listed in Table 4. As shown in Fig. 7, the D(H-bonded) exponentially increased with the Co/Si atomic ratio and reached the maximum at Co/Si = 0.05, then decreased with increasing Co/Si atomic ratio. The D(Free) also exhibited a similar dependency on the Co/Si atomic ratio, however, at all the Co/Si atomic ratios, the D(H-bonded) was higher than D(Free). This suggested that the polar H-bonded Si–OH formed with the doped Co2+ accelerated the OH/OD conversion rate.
| Co-Doped SiO2 analytical Co/Si ratio (−) | D (10−15 m2 s−1) | C D eq (10−2 at%) | ||
|---|---|---|---|---|
| Free OX | H-bonded | Free | H-bonded | |
| 0 | 6.1 | — | 9.5 | — |
| 0.01 | 3.2 | 4.8 | 4.9 | 3.5 |
| 0.03 | 5.3 | 7.9 | 4.0 | 3.7 |
| 0.05 | 7.6 | 15.6 | 5.8 | 6.3 |
| 0.18 | 5.5 | 9.1 | 5.1 | 4.1 |
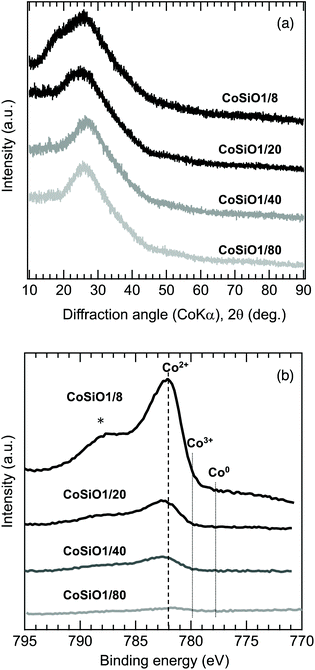
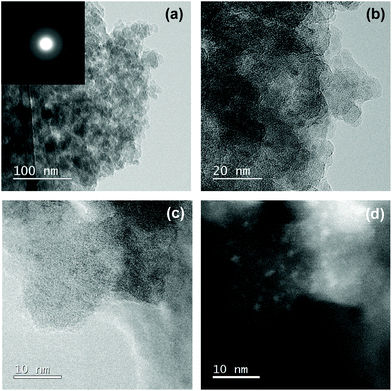
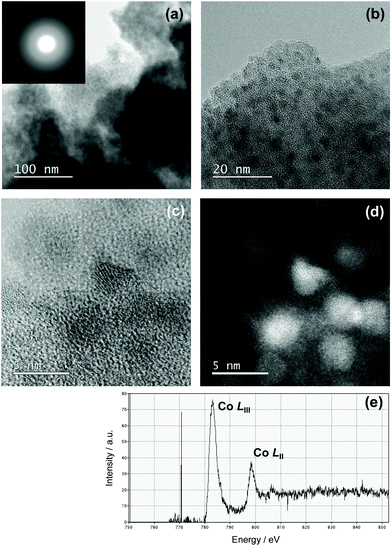
To examine the Co/Si atomic ratio dependency of the D in more details, TEM observations were performed on the samples with measured Co/Si = 0.05 (CoSiO1/20 sample) and 0.18 (CoSiO1/8 sample), and the results were shown in Fig. 8 and 9, respectively. CoSiO1/20 and CoSiO1/8 samples were X-ray amorphous (Fig. 3(a)), and the selected area electron diffraction patterns shown in Fig. 8(a) and 9(a) supported the amorphous state of these materials. However, CoSiO1/20 samples sample exhibited some spots with darker contrast less than approximately 2 nm in size (Fig. 8(b)), and the size of the spots observed for the CoSiO1/8 sample was larger (Fig. 9(b)). As shown in Fig. S3(a),† the CoSiO1/20 sample exhibited a narrow and unimodal spot size distribution, and the mean size was determined as 1.8 nm. On the other hand, the CoSiO1/8 sample showed a wider size distribution with a larger mean size of 3.4 nm (Fig. S3(b)†). Then, STEM observation was performed for further analysis of the spots. The darker spots observed in the bright field (BF)-images (Fig. 8(c) and 9(c)) were highlighted with bright contrast in the annular dark-field (ADF)-STEM images (Fig. 8(d) and 9(d)), and the simultaneous electron energy loss spectroscopy (EELS) analysis for the spots shown in Fig. 9(d) resulted in the detection of Co2+ as indicated by the Co LIII/LII EELS ratio of ∼2 (Fig. 9(e)). This oxidation state of Co was well consistent with the result obtained by the XPS analysis (Fig. 3(b)).
To study the Co(II)-cluster formation in more detail, HRTEM observation was performed on the samples with a lower Co/Si ratio below 0.05. However, these samples exhibited featureless nanostructures. Then, intensive STEM observation was performed. As a result, the CoSiO1/80 sample exhibited a trace amounts of bright spots with a size of about 1–2 nm under the ADF-STEM imaging mode (Fig. SI4†). In the case of the CoSiO1/40 sample, it was also rare to find some spots suggested as Co(II)-cluster approximately 2 nm in size (Fig. SI5†).
As shown in Fig. 7, H-bonded Si–OH groups played a key role in the acceleration of the OH/OD conversion rate. Since the parameter of cD eq reflected the number of Si–OH which was converted to the Si–OD at the sample surface, D values were plotted as a function of cD eq (Fig. 10). Consistent with the cD eq, the D(H-bonded) apparently increased, which indicated that the increase of the number of H-bonded Si–OH accelerated the OH/OD conversion rate of Co2+-doped amorphous silica. Moreover, as shown in Fig. SI6,† the wavenumber of the H-bonded OH (ν(OH)/cm−1) in the Co-doped silica samples detected by the IR spectroscopy analysis (Table 3) decreased consistently with cD eq, i.e. the acidity (polarity) of the H-bonded OH increased with cD eq.
As mentioned above, in the case using the conventional sol–gel technique for the synthesis of Co-doped SiO2, Co3O4 crystallization easily proceeds to afford the binary Co3O4–SiO2 composite.14,15 In the present study, amorphous Co(II)-nanocluster formation proceeded to some extent, however, at the Co/Si ratios ranging from 0.01 to 0.05, the concentration of Co2+ which modified the amorphous silica matrix network increased, i.e. number of hydrogen bonds by the doped-Co2+ (Si–Oδ–Hδ+⋯O–Co2+) shown in Fig. 4 increased consistently with the Co/Si ratio. This relation was successfully achieved through the present PDCs route: during the thermal conversion of polymer to inorganic compound, the molecular structure having the Si–O–Co bond was preserved to afford the Co2+-induced H-bonded OH group within the amorphous silica matrix.
Recently, Nogami et al. reported the hydrogen diffusion coefficient through sodium aluminosilicate glasses (Na2O–Al2O3–SiO2) prepared by the melt-quenching technique.34 The diffusion coefficients of hydrogen at 400–600 °C estimated for this glass with an Al/Na atomic ratio <1 were 10−16–10−15 m2 s−1 order; as a typical example, the diffusion coefficient at 500 °C estimated for 20Na2O·10Al2O3·70SiO2 glass was 1.8 × 10⁻¹⁵ m2 s−1.29 In this study, as listed in Table 4, the D(Free) at 500 °C estimated for non-doped amorphous silica was 6.1 × 10⁻¹⁵ m2 s−1. This value was compatible with the reported value, while the D(H-bonded) value of 15.6 × 10⁻¹⁵ m2 s−1 was approximately one order of magnitude higher than the reported value. Generally, silica-based materials for gas separation membranes are composed of a microporous looser amorphous network which can exhibit molecular sieve property. Thus, hydrogen can permeate through the micropore channels within the amorphous silica, which is recognized as activated diffusion.3 The enhanced value of the D(H-bonded) estimated in this study suggests that Co2+-doping can offer an additional hydrogen facilitate transport property at the surface of the micropore channel wall composed of the Co-doped amorphous silica, i.e. enhancing hydrogen permeance via the surface diffusion mechanism even at the high temperature of 500 °C. Alternatively, applications up to 300 °C will be also attractive; for instance, the hydrogen separation/purification process for the dehydrogenation of chemical hydrides35,36 under reduction conditions in novel hydrogen storage-transportation systems. Further study on the evaluation of membrane performance as well as lifetime of Co-doped amorphous silica is under progress.
Conclusions
In this study, the effect of the local structure of polymer-derived Co-doped amorphous silica on the hydrogen transport property was intensively studied and the results can be summarized as follows:(1) Co2+-doped amorphous silica materials with Co/Si atomic ratios ranging from 0.01 to 0.18 were successfully synthesized through the PDC route.
(2) The doped Co2+ modified the amorphous silica network to afford H-bonded Si–OH. The number of the H-bonded Si–OH increased consistently with the amount of the doped Co2+ and reached the maximum at the Co/Si atomic ratio of 0.05, then decreased with increasing the Co/Si atomic ratio above 0.05.
(3) HRTEM and STEM analyses revealed that the segregation of Co2+ started at the Co/Si atomic ratio of 0.05, and the amount of Co2+ which modified the amorphous silica network deceased with increasing the Co/Si atomic ratio above 0.05.
(4) The OH/OD conversion behavior for surface silanol groups was in situ monitored by measuring the DRIFT spectra, and the self-diffusion coefficient of deuterium at the sample surface (D) was evaluated. The D(H-bonded) at 500 °C estimated in this study was 15.6 × 10⁻¹⁵ m2 s−1. This value was approximately one order of magnitude higher than the reported D value at 500 °C estimated for sodium aluminosilicate glass.
(5) It was found that the enhanced polarity of the H-bonded Si–OH formed by the Co2+-doping accelerated the hydrogen transport at the amorphous silica surface network.
(6) The results obtained in this study suggest that a rather small amount of Co2+-doping, expressed as a Co/Si atomic ratio of 0.05 is effective for enhancing hydrogen permeance through microporous amorphous silica membranes at T ≥ 500 °C.
Conflicts of interest
There are no conflicts to declare.Acknowledgements
This work was partially supported by JSPS KAKENHI Grant Number JP20K05076. Dr Samuel Bernard and Prof. Yuji Iwamoto would like to thank CNRS who financially supported the present work via the International Research Project (IRP) ‘Ceramics materials for societal challenges’.References
- R. M. De Vos and H. Verweij, High-selectivity, high-flux silica membranes for gas separation, Science, 1998, 279, 1710–1711 CrossRef CAS.
- Y. Iwamoto, K. Sato, T. Kato, T. Inada and Y. Kubo, A hydrogen-permselective amorphous silica membrane derived from polysilazane, J. Eur. Ceram. Soc., 2005, 25, 257–264 CrossRef CAS.
- Y. Iwamoto, Precursors-Derived Ceramic Membranes for High-Temperature Separation of Hydrogen, J. Ceram. Soc. Jpn., 2007, 115, 947–954 CrossRef CAS.
- T. Nagano, S. Fujisaki, K. Sato, K. Hataya, Y. Iwamoto, M. Nomura and S.-I. Nakao, Relationship between the Mesoporous Intermediate Layer Structure and the Gas Permeation Property of an Amorphous Silica Membrane Synthesized by Counter Diffusion Chemical Vapor Deposition, J. Am. Ceram. Soc., 2008, 91(1), 71–76 CAS.
- A. K. Prabhu and S. T. Oyama, Highly hydrogen selective ceramic membranes: Application to the transformation of greenhouse gases, J. Membr. Sci., 2000, 176, 233–248 CrossRef CAS.
- S. Kurungot, T. Yamaguchi and S. I. Nakao, Rh/γ-Al2O3 catalytic layer integrated with sol-gel synthesized microporous silica membrane for compact membrane reactor applications, Catal. Lett., 2003, 86, 273–278 CrossRef CAS.
- K. Akamatsu, T. Murakami, T. Sugawara, R. Kikuchi and S. Nakao, Stable equilibrium shift of methane steam reforming in membrane reactors with hydrogen-selective silica membranes, AIChE J., 2011, 57, 1882–1888 CrossRef CAS.
- K. Akamatsu, Y. Ohta, T. Sugawara, N. Kanno, K. Tonokura, T. Hattori and S. Nakao, Stable high-purity hydrogen production by dehydrogenation of cyclohexane using a membrane reactor with neither carrier gas nor sweep gas, J. Membr. Sci., 2009, 330, 1–4 CrossRef CAS.
- K. Akamatsu, Y. Ohta, T. Sugawara, T. Hattori and S. Nakao, Production of hydrogen by dehydrogenation of cyclohexane in high-pressure (1–8 atm) membrane reactors using amorphous silica membranes with controlled pore sizes, Ind. Eng. Chem. Res., 2008, 47, 9842–9847 CAS.
- K. Akamatsu, T. Tago, M. Seshimo and S. Nakao, Long-term stable H2 production from methylcyclohexane using a membrane reactor with a dimethoxydiphenylsilane-derived silica membrane prepared via chemical vapor deposition, Ind. Eng. Chem. Res., 2015, 54, 3996–4000 CrossRef CAS.
- X. L. Zhang, K. Akamatsu and S. Nakao, Hydrogen Separation in Hydrogen-Methylcyclohexane-Toluene Gaseous Mixtures through Triphenylmethoxysilane-Derived Silica Membranes Prepared by Chemical Vapor Deposition, Ind. Eng. Chem. Res., 2016, 55, 5395–5402 CrossRef CAS.
- K. Yoshida, Y. Hirano, H. Fujii, T. Tsuru and M. Asaeda, Hydrothermal Stability and Performance of Silica-Zirconia Membranes for Hydrogen Separation in Hydrothermal Conditions, J. Chem. Eng. Jpn., 2001, 34, 523–530 CrossRef CAS.
- M. Kanezashi and M. Asaeda, Hydrogen permeation characteristics and stability of Ni-doped silica membranes in steam at high temperature, J. Membr. Sci., 2006, 271, 86–93 CrossRef CAS.
- R. Igi, T. Yoshioka, Y. H. Ikuhara, Y. Iwamoto and T. Tsuru, Characterization of co-doped silica for improved hydrothermal stability and application to hydrogen separation membranes at high temperatures, J. Am. Ceram. Soc., 2008, 91, 2975–2981 CrossRef CAS.
- S. Fujisaki, K. Hataya, T. Saito, S. Arai, Y. Iwamoto and K. Kuroda, Nanostructural characterizations of hydrogen-permselective Si-Co-O membranes by transmission electron microscopy, J. Mater. Res., 2009, 24, 372–378 CrossRef CAS.
- C. R. Miller, D. K. Wang, S. Smart and J. C. Diniz da Costa, Reversible redox effect on gas permeation of cobalt doped ethoxy polysiloxane (ES40) membranes, Sci. Rep., 2013, 3, 1–6 Search PubMed.
- T. Kubo and H. Kozuka, Conversion of Perhydropolysilazane-to-Silica Thin Films by Exposure to Vapor from Aqueous Ammonia at Room Temperature, J. Ceram. Soc. Jpn., 2006, 114, 517–523 CrossRef CAS.
- M. N. Mohd Sokri, T. Onishi, Y. Daiko, S. Honda and Y. Iwamoto, Hydrophobicity of amorphous silica-based inorganic-organic hybrid materials derived from perhydropolysilazane chemically modified with alcohols, Microporous Mesoporous Mater., 2015, 215, 183–190 CrossRef CAS.
- M. Mohd Sokri, Y. Daiko, Z. Mouline, S. Honda and Y. Iwamoto, Formation of Micro and Mesoporous Amorphous Silica-Based Materials from Single Source Precursors, Inorganics, 2016, 4, 5 CrossRef.
- C. Zhou, C. Fasel, R. Ishikawa, M. Gallei, Y. Ikuhara, S. Lauterbach, H. J. Kleebe, R. Riedel and E. Ionescu, One-pot synthesis of a C/SiFeN(O)-based ceramic paper with in situ generated hierarchical micro/nano-morphology, J. Eur. Ceram. Soc., 2017, 37, 5193–5203 CrossRef CAS.
- P. J. Launer, Infrared Analysis of Organosilicon Compounds: Spectra-structureCorrelations, Laboratory for Materials, Inc. Burnt Hills, New York, 1987 Search PubMed.
- J. E. Stewart, Vibrational spectra of primary and secondary aliphatic amines, J. Chem. Phys., 1959, 30, 1259–1265 CrossRef CAS.
- Y. Iwamoto, K. Kikuta and S. Hirano, Microstructural development of Si3N4-SiC-Y2O3 ceramics derived from polymeric precursors, J. Mater. Res., 1998, 13, 353–361 CrossRef CAS.
- M. A. Langell, M. D. Anderson, G. A. Carson, L. Peng and S. Smith, Valence-band electronic structure of Co3O4 epitaxy on CoO(100), Phys. Rev. B: Condens. Matter Mater. Phys., 1999, 59, 4791–4798 CrossRef CAS.
- B. A. F. Kengne, A. M. Alayat, G. Luo, A. G. McDonald, J. Brown, H. Smotherman and D. N. McIlroy, Preparation, surface characterization and performance of a Fischer-Tropsch catalyst of cobalt supported on silica nanosprings, Appl. Surf. Sci., 2015, 359, 508–514 CrossRef CAS.
- R. M. Silverstein, G. C. Bassler and T. C. Morrill, Spectrometric Identification of Organic Compounds, J. Wiley & Sons, New York, 1991 Search PubMed.
- Z. Mouline, K. Asai, Y. Daiko, S. Honda, S. Bernard and Y. Iwamoto, Amine-functionalized polycarbosilane hybrids for CO2-selective membranes, J. Eur. Ceram. Soc., 2017, 37, 5213–5221 CrossRef CAS.
- C. Pazé, S. Bordiga, C. Lamberti, M. Salvalaggio, A. Zecchina and G. Bellussi, Acidic Properties of H-β, Zeolite As Probed by Bases with Proton Affinity in the 118–204 kcal mol−1 Range: A FTIR Investigation, J. Phys. Chem. B, 1997, 101, 4740–4751 CrossRef.
- E. Groppo, C. Lamberti, S. Bordiga, G. Spoto and A. Zecchina, The Structure of Active Centers and the Ethylene Polymerization Mechanism on the Cr/SiO2 Catalyst: A Frontier for the Characterization Methods, Chem. Rev., 2005, 105, 115–183 CrossRef CAS.
- K. Chakarova, N. Drenchev, M. Mihaylov, P. Nikolov and K. Hadjiivanov, OH/OD isotopic shift factors of isolated and H-bonded surface silanol groups, J. Phys. Chem. C, 2013, 117, 5242–5248 CrossRef CAS.
- A. B. Gizhevskii, A. Y. Fishman, E. A. Kozlov, T. E. Kurennykh, S.A. Petrova, I. S. Trakhtenberg, E. V. Vykhodets, V. B. Vykhodets and R. G. Zakharov, Oxygen Isotope Exchange between Gaseous Phase Enriched with 18O Isotope and Nanocrystal Oxides LaMnO3+δ, obtained by severe plastic deformation, Defect Diffus. Forum, 2008, 233, 273–276 Search PubMed.
- A. Y. Fishman, T. E. Kurennykh, S. A. Petrova, E. V. Vykhodets, V. B. Vykhodets and R. G. Zakharov, Oxygen isotope exchange in nanocrystal oxide powders, J. Nano Res., 2009, 7, 33–41 CAS.
- E. R. Trejo and J. A. Kilner, Oxygen diffusion and proton conduction in La1−xSrxYO3−d, Solid State Ionics, 1997, 97, 529–534 CrossRef.
- M. Nogami, V. X. Quang, S. Ohki, K. Deguchi and T. Shimizu, Reduction Mechanisms of Cu2+-Doped Na2O-Al2O3-SiO2 Glasses during Heating in H2 Gas, J. Phys. Chem. B, 2018, 122, 1315–1322 CrossRef CAS.
- K. Oda, K. Akamatsu, T. Sugawara, R. Kikuchi, A. Segawa and S. Nakao, Dehydrogenation of Methylcyclohexane To Produce High-Purity Hydrogen Using Membrane Reactors with Amorphous Silica Membranes, Ind. Eng. Chem. Res., 2010, 49, 11287–11293 CrossRef CAS.
- K. Kida, Y. Maeta, T. Kuno and K. Yogo, Hydrogen Purification from Chemical Hydride Using Pure Silica Zeolite Membranes, Chem. Lett., 2017, 46, 1724–1727 CrossRef CAS.
Footnote |
| † Electronic supplementary information (ESI) available: Fig. S1–S3. See DOI: 10.1039/d0qi01035a |
| This journal is © the Partner Organisations 2021 |


