 Open Access Article
Identification of key lipid metabolites during metabolic dysregulation in the diabetic retinopathy disease mouse model and efficacy of Keluoxin capsule using an UHPLC-MS-based non-targeted lipidomics approach†
Nan Gea,
Ling Konga,
Ai-hua Zhanga,
Ye Suna,
Man-qian Zhaob,
Bo Zhanga,
Lei Xub,
Xiao Keb,
Hui Suna and
Xi-jun Wang *a
*a
aNational Chinmedomics Research Center, National TCM Key Laboratory of Serum Pharmacochemistry, MetabolomicsLaboratory, Department of Pharmaceutical Analysis, Heilongjiang University of Chinese Medicine, Heping Road 24, Harbin 150040, Heilongjiang Province, China. E-mail: xijunw@sina.com; Fax: +86-451-82110818; Tel: +86-451-82110818
bChengdu Kanghong Pharmaceutical Co. Ltd, Tengfei Second Road No. 355, Shuangliu District, Chengdu 610036, Sichuan Province, China
First published on 1st February 2021
Abstract
Diabetic retinopathy (DR) is an important complication of diabetes, and is currently the main cause of blindness among young adults in the world. Previous studies have shown that Keluoxin (KLX) capsules have a significant effect on DR in C57BL/KsJ/db−/− mice (db/db mice), however the unclear mechanism limits its further clinical application and actual value. Further research is urgently needed for the treatment of DR disease. Discovery of key lipid biomarkers and metabolic pathways can reveal and explore the molecular mechanisms related to DR development and discover the effect of Keluoxin (KLX) capsule against DR in db/db mice. Lipidomics has been used for characterizing the pathological conditions via identification of key lipid metabolites and the metabolic pathway. In this study, the high-throughput lipidomics using UHPLC-Q-TOF/MS combined with multivariate statistical analysis, querying multiple network databases and employing ingenuity pathway analysis (IPA) method for molecular target prediction. A total of 30 lipid biomarkers were identified and 7 metabolic pathways including arachidonic acid metabolism and steroid hormone biosynthesis were found. The preventive effect of KLX intervention can regulate 22 biomarkers such as LysoPA(16:0/0:0), prostaglandin D2, cortisol and γ-linolenic acid, etc. IPA platform has predicted that PI3K/MAPK pathway are closely related to DR development. It also showed that high-throughput lipidomics combined with multivariate statistical analysis could deep excavate of the biological significance of the big data, and can provide molecular targets information about the disease treatment.
1. Introduction
Diabetes is one of the most important chronic non-communicable diseases in the world. As the prevalence rises year by year, the disease burden caused by diabetes is also getting heavier. In the meantime, diabetes and its complications have seriously affected the quality of human life. Diabetic retinopathy (DR) is one of the most common complications in diabetic patients. It is the primary cause of blindness for young and middle-aged workers in the world. It has gradually become a global problem worthy of our attention. DR can be subdivided into nonproliferative diabetic retinopathy (NPDR) and proliferative diabetic retinopathy (PDR) according to whether there is neovascularization.1 The pathogenesis of DR is complex, and the common starting point is hyperglycemia, which is generally thought to be caused by damage to the retinal microvascular system. Hyperglycemia stimulates vascular endothelial cells to generate a large amount of reactive oxygen species (ROS), and at the same time reduces the activity of antioxidant enzymes.2–4 Hyperglycemia interferes with inositol metabolism and causes excessive accumulation of advanced glycation end products (AGEs) in the body, leading to selective loss of retinal microvascular pericytes, which in turn damages retinal microvascular.5 Changes in microvascular function can cause microvascular occlusion and microvascular leakage, leading to fundus bleeding, etc. Retinal ischemia and hypoxia will induce the formation of new blood vessels and eventually lead to DR.6Extensive epidemiological studies have shown an important link between serum triglycerides or major cholesterol types and the severity of DR, and some specific lipoprotein substances may be important targets for controlling DR.7 Lipid is the skeleton component of biomembrane, and it is an essential material to participate in biological activities and provide energy for organisms. Lipidomics is an important branch of metabolomics. It is a new branch of science that systematically analyzes lipid substances in organisms, studies their interactions and interactions with other biomolecules, which reveals the relationship between lipid metabolism and physiological and pathological processes of organisms.8 In recent years, lipidomics has been used as a method to find biomarkers of diseases, and many achievements have been made. Including the study of lipid biomarkers of Alzheimer's disease,9,10 colorectal cancer,11 coronary heart disease12 and etc. From the perspective of lipidomics, it can seek lipid biomarkers and related pathways for DR and provides a comprehensive and accuratetreatment evaluation.
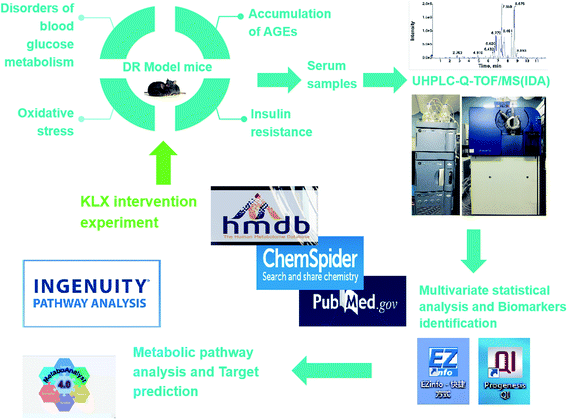
Keluoxin (KLX) is a clinical prescription, and it approved by the China Food and Drug Administration for the treatment of diabetes. It combined with benazepril,13 olmesartanaxetil,14 compound α-ketoacids,15 ARB drugs16 in the treatment of diabetic nephropathy has clinical efficacy. In a study, the prevention and treatment effect of KLX on STZ-induced DR in rats,17 it was found that the use of preventive and therapeutic modes of administration, all dose groups of KLX can significantly increase the retinal CRA blood flow velocity of model rats, and reduce rat whole blood viscosity and plasma viscosity. In the study of the preventive effects of KLX on early DR in db/db mice, it was found that KLX could significantly regulate the thickness of retinal ganglion layer and inner plexiform layer, remarkably reduce the quantity of diabetic microvessel. Meanwhile, KLX could notably improve retinal function, observably modulate the cell arrangement and edema in each layer.18 These studies have shown that KLX has a significant preventive effect on DR. However, its metabolic mechanisms remain unclear. In this study, KLX intervention experiment was performed to discover the key lipid molecules as potential therapeutic targets to explore the effect and mechanism of KLX on DR. The experimental design of this study has shown in Fig. 1.
2. Materials and methods
2.1 Chemical reagents
Methanol and acetonitrile (HPLC grade) were obtained from Fisher Scientific Corporation (Trinidad). Formic acid (HPLC grade) was supplied by Sigma-Aldrich (Darmstadt, Germany). Distilled water was from Watsons (A. S. Watson Group (Hong Kong) Ltd). And 0.9% sodium chloride solution was provided by Harbin Sanlian Pharmaceutical Co., Ltd (China). APCI Positive Calibration Solution and APCI Negative Calibration Solution were obtained from AB SCIEX Company (American). KLX sample is provided by Chengdu KanghongPharmaceutical Co., Ltd (China). Astragaloside IV standardwas purchased from Shanghai Chunyou Biotechnology Co., Ltd (China). The other reagents and chemicals were analytical grade.2.2 Quality control of KLX sample
We used a high performance liquid chromatography-evaporative light scattering detector (HPLC-ELSD) to accurately determine the content of astragaloside IV in the KLX samples. Accurately weigh an appropriate amount of astragaloside IV standard, add methanol to make the concentration 0.25 mg ml−1, and get a precise concentration of standard solution. Chromatographic conditions and system suitability tests, used octadecylsilane bonded silica gel as filler. Acetonitrile–water (32![[thin space (1/6-em)]](https://www.rsc.org/images/entities/char_2009.gif) :
:![[thin space (1/6-em)]](https://www.rsc.org/images/entities/char_2009.gif) 68) was the mobile phase. The number of theoretical plates should not be less than 4000 based on the peak of astragaloside IV. Precisely draw 10 μL and 20 μL of the reference solution and 20 μL each of the test solutions and inject them into HPLC for determination. The external standard is two-point logarithmic equation was used to calculate the astragaloside IV content in KLX samples.
68) was the mobile phase. The number of theoretical plates should not be less than 4000 based on the peak of astragaloside IV. Precisely draw 10 μL and 20 μL of the reference solution and 20 μL each of the test solutions and inject them into HPLC for determination. The external standard is two-point logarithmic equation was used to calculate the astragaloside IV content in KLX samples.
2.3 Animal handing and drug
Twenty 8 week-old male db/db mice were used in this experiment, and they were randomly divided into model group and KLX intervention group, ten in each group. Simultaneously, ten wild littermate C57BL/KsJ/db+/+ mice (db/m mice) were used as control group. Mice were purchased from Nanjing Institute of Biomedicine, Nanjing University. Following the experimental animal management regulations of the Experimental Animal Center of Heilongjiang University of Chinese Medicine, mice were housed in SPF-free experimental animal rooms, 12 h light and 12 h dark alternate, ambient temperature 20–25 °C, relative humidity 50–60%, drink purified water freely for standard feeding. All animal procedures were performed in accordance with the Guidelines for Care and Use of Laboratory Animals of Heilongjiang University of Chinese Medicine and approved by the Animal Ethics Committee of Heilongjiang University of Chinese Medicine.For the gavage solution, weighed 11.7 g of KLX sample, added 150 ml of distilled water, and sonicate for 10 min until it was completely dissolved, with final concentration for 0.078 g ml−1. The KLX intervention group was given 0.780 g kg−1 (clinical equivalent dose) gavage solution (10 ml kg−1). The control group and model group were given the same volume of 0.9% sodium chloride solution. Gavage solution was given at 8 o'clock every morning for 24 weeks. At the end of the experimental period, 0.3% pentobarbital sodium (30 mg kg−1) was injected intraperitoneally, and blood samples were collected from the eyes. An average of 700 microliters blood was collected from each mouse. Centrifuging at 3500 rpm for 10 minutes to collect the supernatant, an average 300 microliters of plasma was obtained from each mouse. The serum was stored in −80 °C for UHPLC-MS analysis.
2.4 Preparation of serum samples
Plasma samples were dissolved at room temperature (25 ± 2 °C). Pipetted 100 μL into a centrifuge tube accurately, and added 400 μl of refrigerated methanol (4 °C, ice-water bath) to inactivate and precipitate the protein. After vortex for 30 s and standing for 10 min, the plasma samples were centrifuged at 13![[thin space (1/6-em)]](https://www.rsc.org/images/entities/char_2009.gif) 000 rpm for 10 min (4 °C). The supernatant was collected and passed through a 0.22 μm filter membrane. Biological quality control samples (QCs) were prepared by taking equal amounts of plasma from each sample and mixed them thoroughly and the preparation method of the QCs was consistent with the above-mentioned.
000 rpm for 10 min (4 °C). The supernatant was collected and passed through a 0.22 μm filter membrane. Biological quality control samples (QCs) were prepared by taking equal amounts of plasma from each sample and mixed them thoroughly and the preparation method of the QCs was consistent with the above-mentioned.
2.5 Histopathology
After intraperitoneal injection of 0.3% sodium pentobarbital (30 mg kg−1), the mice were anesthetized. The eyeball was cut in a circle 0.5 mm behind the membrane margin along the equator, the anterior segment was removed, and a glutaraldehyde solution was placed at 4 °C and fixed for 2 h. The retina was dissected under the microscope, and the supratemporal and subtemporal retinal tissues were taken and cut into 1.5 mm × 2.0 mm rectangular tissue pieces. Rinsed with PBS buffer, fixed with osmium tetroxide for 2 h, and dehydrated with gradient ethanol and acetone. Retinal tissue was soaked and embedded with EPON812. First cut into 1 μm thick half slice for optical positioning, then prepared ultra-thin sections, then used double staining with uranyl acetate and lead citrate, and observed visual cells with Philips EM 208s transmission electron microscope.2.6 Instrument condition
Chromatographic analysis was performed using an Acquity™ UHPLC. The column was ACQUITY UHPLC BEH C18 (2.1 × 100 mm, 1.7 μm). The injection volume was 5.0 μl in both positive and negative ion mode (full loop injection). The column was maintained at 40 °C, and the optimal mobile phase was consisted of a linear gradient system of (A) 0.1% formic acid in acetonitrile and (B) 0.1% formic acid in water, as follows: 0–2.0 min, 1–20% eluent A; 2.0–4.0 min, 20–50% eluent A; 4.0–7.0 min, 50–70% eluent A; 7.0–9.0 min, 70–85% eluent A; 9.0–11.0 min, 85–100% eluent A; the flow rate was set at 0.4 ml min−1, and sample room temperature was kept at 10 °C, QCs were run every five injections once.Mass spectrometry was performed using the AB SCIEX Triple TOF™ 5600+ mass spectrometry system (UHPLC-Q-TOF/MS (IDA)) and the workstation was Analyst TF 1.6.2. We used the information dependent acquisition (IDA) mode to help select the best ion-triggered MS/MS data acquisition in real time. The main purposewere to get as much information about useful ions as possible with each injection. With one injection, MS and MS/MS tests could be performed simultaneously on the relevant ions. At the same time, dynamic background subtraction (DBS) and Multiple Mass Defect Filter (MMDF) was turned on. DBS refers to MS/MS that helped us avoid collecting background ions related to the UHPLC eluent during MS/MS analysis. MMDF meant that for the compounds with low intensity, the instrument will preferentially select the ions in line with its mass loss window to collect MS/MS, which can ensure the high quality MS/MS of low content compounds in complex matrix, so as to further infer the chemical structure of metabolites. The mass spectrum related parameters were set as follows: capillary spray voltage (ISVF): 5000 V/−4000 V. MS scanning declustering potential (DP): 100 V/−100 V, collision energy (CE): 10 eV, cumulative time 100 ms; MS/MS collision energy (CE): 40 V/−40 V, collision energy range (CES): 15 V. The other parameters were the same for positive and negative ions. Atomizing gas (Gas 1): 60 psi, auxiliary heating gas (Gas 2): 60 psi, curtain gas: 25 psi, auxiliary heating gas temperature (TEM): 600 °C. Both MS and MS/MS mass scan ranges are 50–1200 Da. The automatic calibration infusion system (CDS, Calibrate Delivery System) used atmospheric pressure chemical ionization source (APCI) and external standard calibration method to automatically adjusted and calibrated MS and MS/MS.
2.7 Multivariate statistical analysis
Data dimensionality reduction in omics research is an important step to visualize biological information. This experiment import blood metabolic profile data (wiff) collected by UHPLC-Q-TOF/MS(IDA) into the Progenesis QI platform (Waters Corp, Version: 2.2) for processing and analysis, including peak alignment, peak extraction, data normalization, and other data pre-processing. The pre-processed three matrix information (retention time (Rt), mass to charge ratio (m/z), peak area) was imported into EZinfo 3.0 (Waters, USA) software for multivariate data analysis, and the principal component analysis (PCA) was used to observe the overall distribution between each group and analyze the clustering of each group. Orthogonal partial least squares discriminant analysis (OPLS-DA) was performed on the control group and model group, and the data were fitted using S-plot and VIP-plot (Variable Importance for the Projection-plot). The VIP-plot was to rummage the difference variables which made great contributions to datasets of classification. In the meantime, VIP-plot analysis can directly output comparable numerical results based on the group contribution rate. Combined with the results of the student t-test on the relative intensity (peak area) of the two groups, the metabolites with p < 0.05 and VIP > 1 were selected as the screening range for the next step to find biomarkers for the DR.2.8 Biomarkers identification and metabolic pathway analysis
The Rt and m/z derived from Progenesis QI platform software, and the molecular formula determined by elemental composition analysis were combined with Lipidomics Gateway (http://www.lipidmaps.org/), Human Metabolome Databases (http://www.hmdb.ca/), Chemspider (http://www.chemspider.com/) and other online databases for further characterization and screening. Using the most critical MS/MS fragments as clues, the biomarkers associated with DR were finally identified based on the general possibility of chemical structure cleavage and the mass cleavage law. The HMDB information of the identified lipid biomarkers of DR was imported into MetaboAnalyst 4.0 (https://www.metaboanalyst.ca/) for pathway enrichment analysis. Information on the main lipids pathways related to the DR had been obtained based on the impact value. Heat map analysis of biomarkers and correlation analysis between biomarkers were performed simultaneously. Kyoto Encyclopedia of Genes and Genomes (https://www.kegg.jp/) network database was used to analyze the correlation between the main pathways, and a lipid network pathway map related to DR could be constructed.2.9 Ingenuity pathway analysis
Ingenuity pathway analysis (IPA) was a cloud computing-based graphical interface bioinformatics software. The experimental data such as gene expression, lipidomics, metabolomics, and proteomics could be analyzed and interpreted to further explore the hidden biological significance in the experimental data. IPA analysis could predict molecular information and pathway information such as upstream regulatory factors related to disease, as well as information on the interaction between molecules and between molecules and pathways. In this experiment, the identified biomarkers information was imported into the IPA software for further target prediction.3. Results
3.1 Quality control analysis of KLX
The results of astragaloside IV in KLX samples measured by HPLC-ELSD were as follows: we prepared a reference of astragaloside IV standard with a precise concentration, injected 10 μL and 20 μL respectively, and the corresponding chromatogram shown in Fig. S1(A and B).† Two KLX samples were prepared in parallel, and each sample was measured twice, injected 20 μL. The chromatogram obtained has shown in Fig. S1(C).† Astragaloside IV peaks at about 12.9 minutes. The specific peak area information and content determination results (Table S1†) indicated that the content of astragaloside IV in the KLX sample complies with the requirements of relevant standards (standard: the KLX sample contains astragali radix (Astragalus membranaceus (Fisch.) based on astragaloside IV (C41H68O14), which should not be less than 0.061%).3.2 Immunohistochemistry analysis
The histopathological results showed in Fig. S2.† In the control group, the ganglion cells were arranged in a single row to form the innermost layer of the retina. The nucleus was uniform, the organelle structure was clear, and the shape, size and structure of the mitochondrion were normal (Fig. S2A†). In the model group, the number of mitochondria was significantly decreased, and a large number of mitochondria appeared swelling and vacuole degeneration. The number of organelles such as nucleus pyknosis, a large number of vacuoles, polyribosomes, and rough endoplasmic reticulum in the cytoplasm were significantly reduced (Fig. S2B†). The number of mitochondria seen in the ganglion cells of the KLX intervention group was relatively higher than that in the model group. A few mitochondria were swelling and vacuole degeneration. The number of organelles also increased, the structure became clearer, and the morphology gradually returned to normal (Fig. S2C†). In summary, comparison of three groups showed that KLX could significantly alleviate the DR.3.3 Global lipid profile analysis of DR
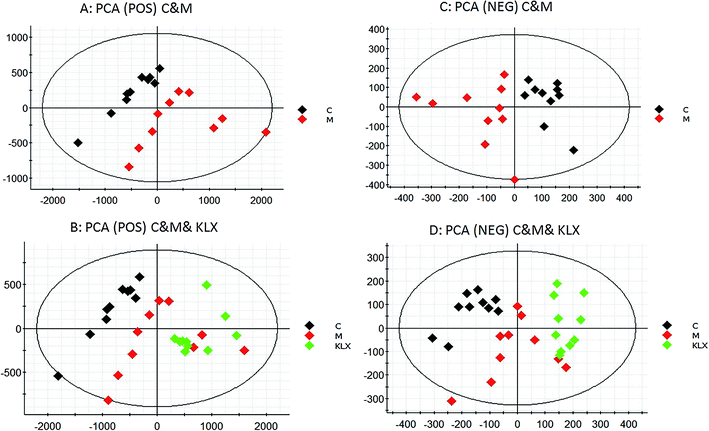
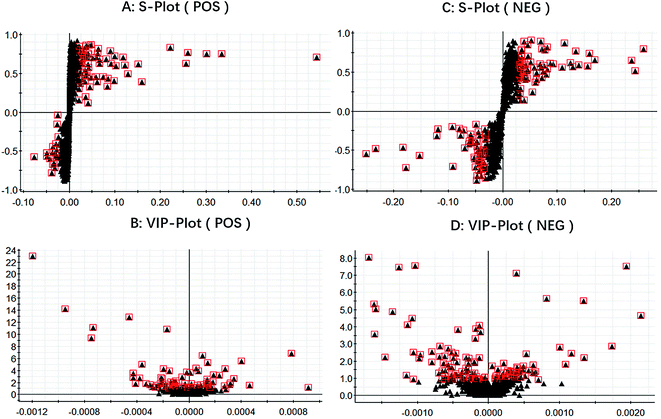
In ESI+ and ESI− modes, according to the above parameter settings of UHPLC-Q-TOF/MS (IDA), the serum samples were analyzed by full scan, and the base peak chromatogram (BPI) metabolic profile of the control group (C), model group (M) and KLX intervention group (KLX) were obtained, as shown in Fig. 2. We imported the obtained blood metabolic profile data (.wiff) into Progenesis QI software to obtain a data file in .usp format. In order to reduce the data dimension, we first conducted a PCA of the control group and the model group by EZinfo 3.0 software. We could see that the control group and the model group were obvious differences (Fig. 3A and C). The intervention of KLX can significantly affect the metabolic profile of DR mice (Fig. 3B and D). Based on the PCA analysis, in order to find potential biomarkers for DR, we performed OPLS-DA analysis on the control group and the model group. The two groups could be clearly separated (Fig. 4A and B).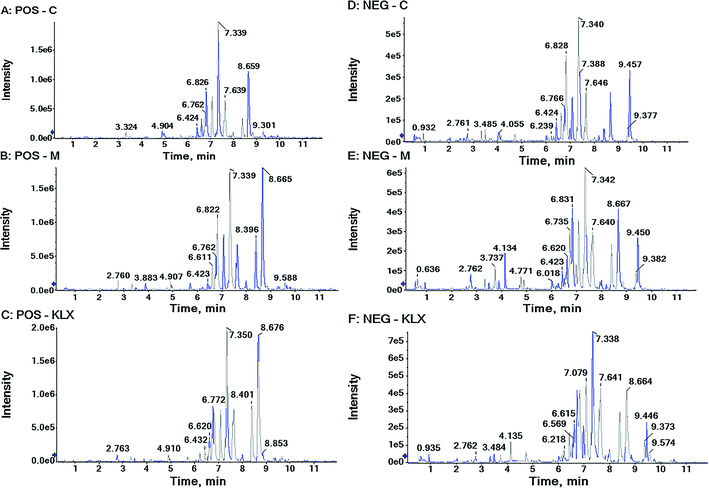 | ||
| Fig. 2 The BPI chromatograms of plasma samples from control group (C), model group (M) and KLX intervention group (KLX), acquired by UHPLC-Q-TOF/MS (IDA) in positive and negative ion mode. | ||
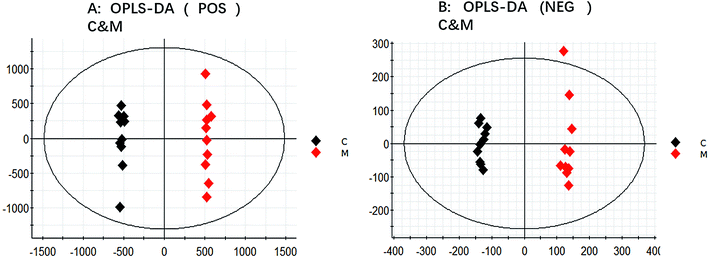 | ||
| Fig. 4 The orthogonal partial least squares discriminant analysis (OPLS-DA) of control group (C), model group (M) in both positive and negative ion modes (A and B). | ||
3.4 Nontargeted lipidomics for identification of potential lipid biomarkers
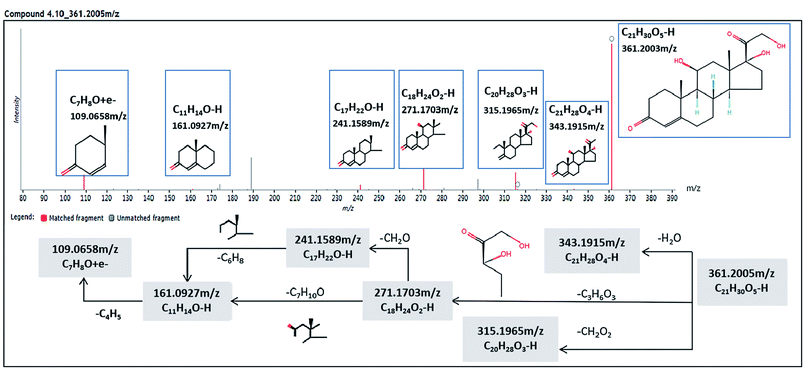
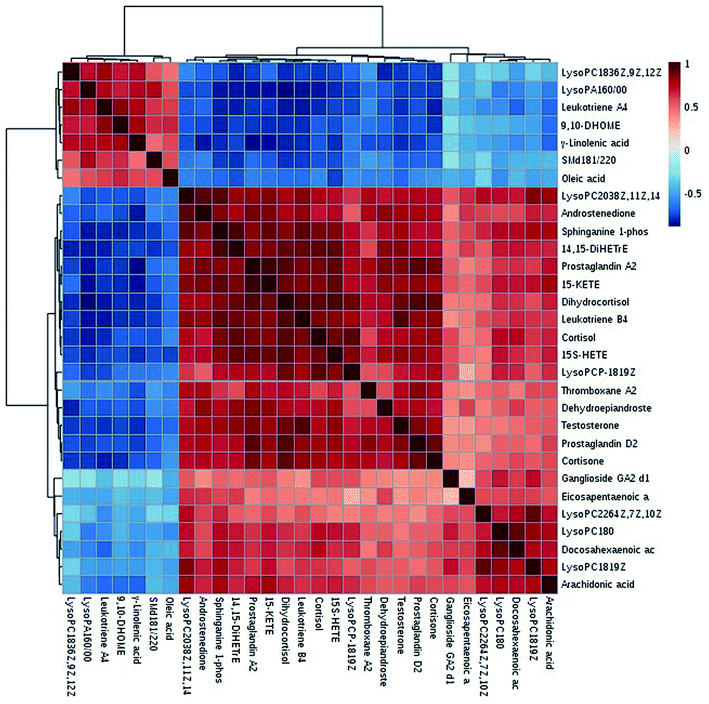
We got the S-plot (Fig. 5A and C) and VIP-plot (Fig. 5B and D) by OPLS-DA. The farther away the ions were from the origin, the greater their contribution to the change of metabolic trajectories. VIP values (VIP > 1) combined with the student t-test analysis results (p < 0.05),we roughly screened out 65 and 74 candidate biomarkers in the positive and negative ion mode as the further screening range. Based on the MS/MS fragmentation information in Progenesis QI software and the above-mentioned network database, we finally characterized 30 biomarkers related to DR. Take the identification of cortisol as an example. The m/z of cortisol was 361.2005 and the molecular formula was C21H30O5. The parent ion and corresponding fragment ions were detected by the mass spectrometer and the speculative molecular structure showed in Fig. 6. From the fragmentation regularity of the ion, we identified this compound as cortisol. Among these DR potential biomarkers, 10 biomarkers were identified in positive ion mode, including LysoPC (18:0), docosahexaenoic acid, arachidonic acid, etc.; 20 biomarkers were identified in negative ion mode, including prostaglandin D2, cortisol, leukotriene B4, γ-linolenic acid, etc. Specific biomarkers information showed in Table S2.† The classification of biomarkers and their VIP values output through EZinfo 3.0 software showed in Fig. 7. It could be found that among the potential biomarkers of DR, 14 belonged to fatty acyl, 7 belonged to glycerophospholipids, 6 belonged to sterol lipids, and 3 belonged to sphingolipids. Simultaneously, the glycerophospholipid biomarkers had relatively higher VIP values compared to other classes. This showed that class glycerophospholipid metabolites had been greatly affected during the occurrence and development of DR, and they might be more important biomarkers. The relative intensity of the biomarkers in the control group and the model group showed in the form of a heat map in Fig. 8. The higher the content, the darker the color. Through the heat map, it could be found that the relative intensity of DR potential biomarkers was significantly different between the control group and the model group. In the control group, the content of LysoPC(18:3(6Z,9Z,12Z)), γ-linolenic acid, 9,10-DHOME, leukotriene A4, oleic acid, SM(d18:1/22:0) and LysoPA(16:0/0:0) is relatively high, and the content of other biomarkers was relatively low. The content of the model group is opposite to that of the control group. The correlation analysis among the 30 identified biomarkers related to DR showed in Fig. 9. The stronger the correlation between the markers, the darker the color. We could find the magnitude of the correlation between two different biomarkers, which helped us to infer whether they had a certain relationship between superiors and subordinates in the occurrence and development of DR, and the interaction and influence of metabolites of the same category were stronger.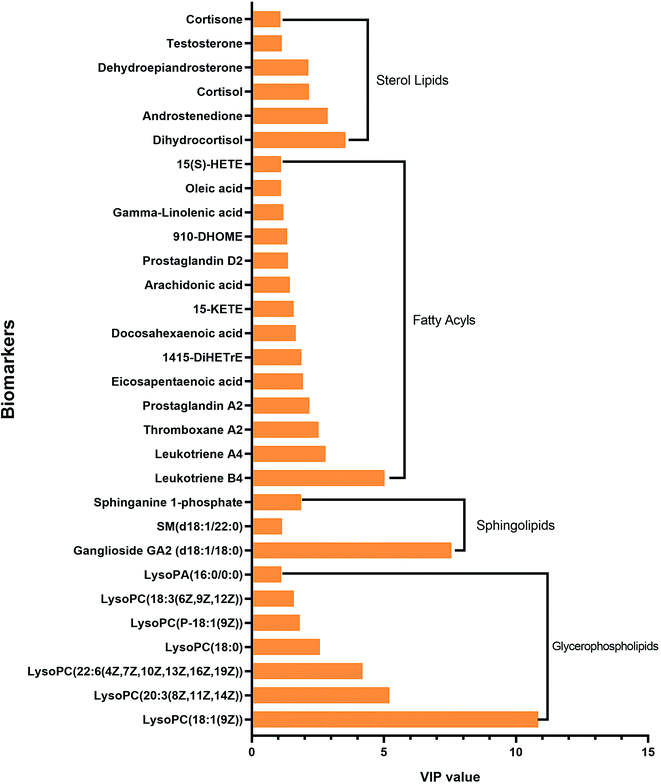 | ||
| Fig. 7 Classification of biomarkers and VIP (Variable Importance for the Projection-plot) values output by EZinfo 3.0 software through statistical analysis. | ||
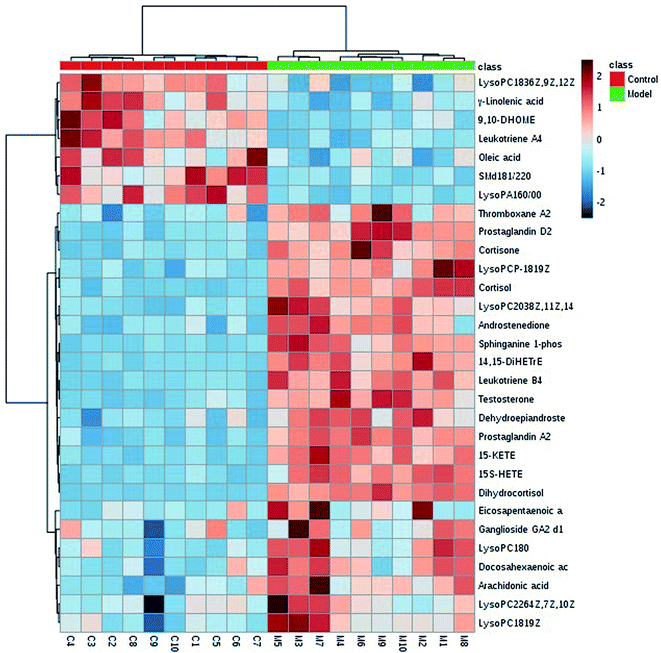 | ||
| Fig. 8 A heat map of the relative intensity of the biomarkers in the control group (C) and the model group (M). | ||
3.5 The perturbed metabolic pathway analysis
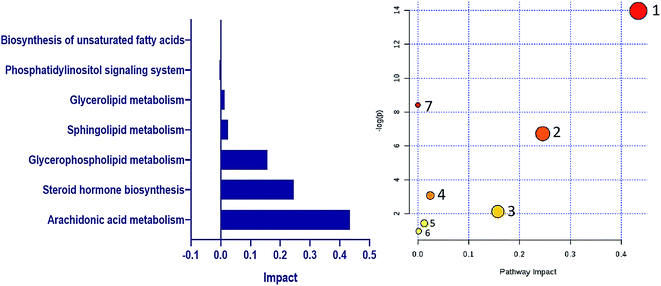
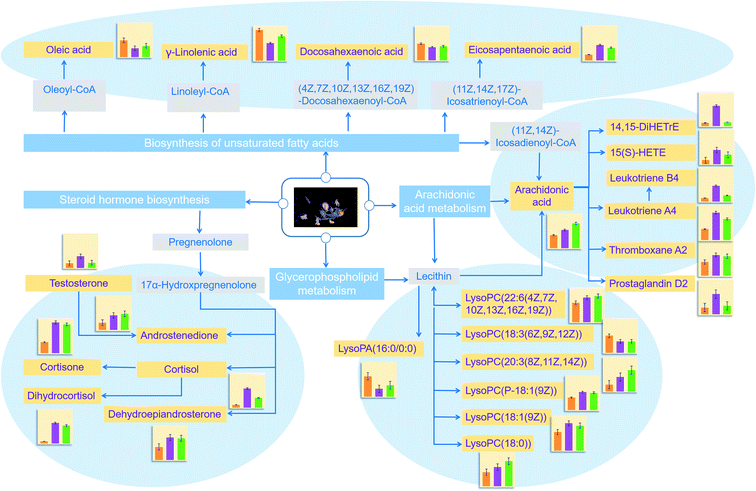
The identified lipid biomarkers were introduced into MetaboAnalyst 4.0 for metabolic pathway analysis to exploreDR-related lipid metabolic pathway information. We obtained 7 lipid metabolic pathway, the impact value from the largest to the smallest namely: arachidonic acid metabolism, steroid hormone biosynthesis, glycerophospholipid metabolism, sphingolipid metabolism, glycerolipid metabolism, phosphatidylinositol signaling system, biosynthesis of unsaturated fatty acids (Fig. 10). Through KEGG network database retrieval and analysis, explore the internal relationship and mutual influence of biomarkers between pathways. Finally, the constructed network of lipid metabolism pathways related to DR (Fig. 11).3.6 Molecular target predictions of DR
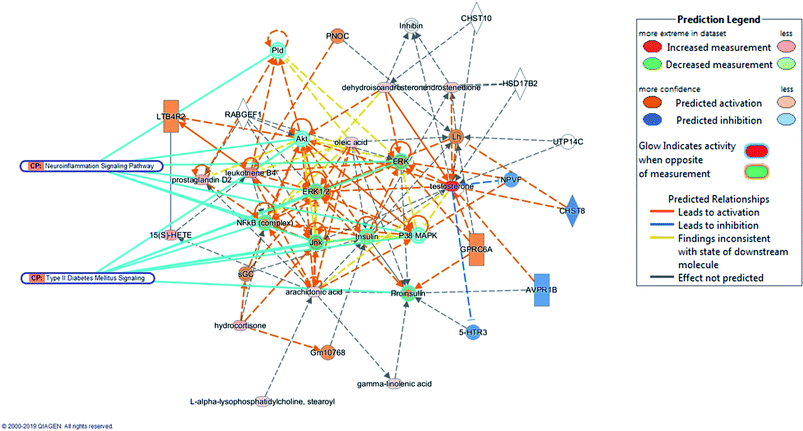
The HMDB information of the identified biomarkers was imported into the IPA software. Through core analysis, related parameters were set. Then, we chosen Molecular Activity Prediction (MAP) to predict the molecular activity of the biomarker upstream and downstream related molecules (Fig. 12). The result was based on the interactions of known molecules, predicting which molecules and functions were activated or inhibited upstream and downstream. Activated molecules or functions were painted orange and inhibited molecules or functions were painted blue. The orange and blue line colors represented IPA's prediction of surrounding molecules and functions. As the distance from a node with a known active state increases, the prediction became uncertain. The intensity of the color indicated the confidence of the prediction. If the confidence was high, the node would become brighter orange or brighter blue; otherwise, it would become darker. The results showed that molecules such as ERK, ERK1/2 and NFκB were activated, and molecules such as 5-HTR3, AVPR1B and NPVF were suppressed. Canonical Pathway (CP) in the figure indicated the association between the classical pathway in the literature library and the prediction result. In the type II diabetes mellitus signaling pathway, the targets that coincided with this prediction were Akt, ERK, ERK1/2, insulin, Jnk, NF-κB (complex), P38 MAPK and proinsulin. In the neuroinflammation signaling pathway, the molecular targets that coincided with this prediction were Akt, ERK, ERK1/2, Jnk, NF-κB (complex), P38 MAPK and Pld. The above analysis showed that the above targets might be related to the occurrence and development of DR.3.7 Discovering key lipid molecules of KLX against DR
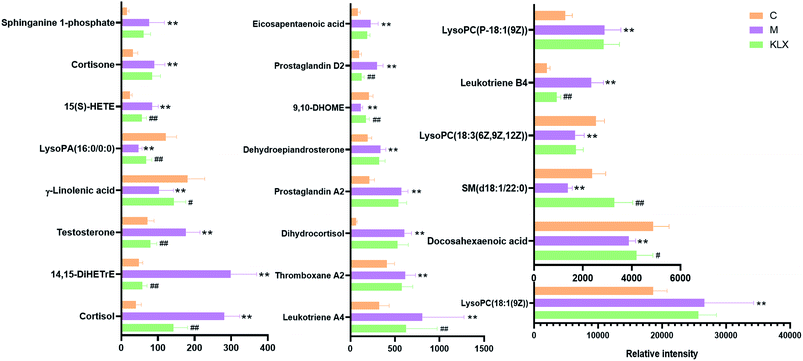
Through histopathological results, we could clearly find the effect of KLX on the delay of onset and treatment of DR. Through PCA of the control group, model group, and KLX intervention group, we could find that the three groups could be clearly distinguished (Fig. 3B and D). It also showed that KLX had a significant intervention effect on the metabolic profile of DR model mice. Among the 30 key lipid biomarkers, KLX could reverse 22 of them (Fig. 13), including leukotriene A4, thromboxane A2, dihydrocortisol, prostaglandin A2, dehydroepiandrosterone, 9,10-DHOME, prostaglandin D2, cortisol, 14,15-DiHETrE, testosterone, γ-linolenic acid, lysoPA(16:0/0:0), 15(S)-HETE, cortisone, lysoPC(18:1(9Z)), docosahexaenoic acid, SM(d18:1/22:0), lysoPC(18:3(6Z,9Z,12Z)), leukotriene B4, lysoPC(P-18:1(9Z)), sphinganine 1-phosphate, and eicosapentaenoic acid. We could conclude that the metabolites were reversed obviously, and cortisol, leukotriene A4, lysoPA(16:0/0:0), prostaglandin D2, etc. were significant differences. It showed that these substances might be more important metabolites for KLX to intervene the development process of DR, which should be worth further attention and research.4. Discussion
In this work, the identified biomarkers were mainly divided into the following categories: fatty acyl, glycerophospholipids, sterol lipids, sphingolipids. The fatty acyl pathways were mainly arachidonic acid metabolism and unsaturated fatty acid biosynthesis. Arachidonic acid and its derivatives were very important for inflammation and body immunity.19,20 Therefore, disorders of arachidonic acid metabolism occurred in many diseases. The biomarker arachidonic acid identified in this experiment refered to all-cis 5,8,11,14-icosatetraenoic acid, which was an ω-6 polyunsaturated fatty acid (PUFA). At the same time, arachidonic acid and its derivatives and various ω-3 polyunsaturated fatty acids were also called eicosanoids. Arachidonic acid has two sources. One is exogenous and we can obtain it from various food, which related to the unsaturated fatty acid biosynthetic metabolic pathway. We obtain arachidonic acid by ingesting docosahexaenoic acid (DHA), eicosapentaenoic acid (EPA), oleic acid and γ-linolenic acid. DHA (ω-3) is a long-chain polyunsaturated fatty acid derived from the ocean. It has been reported to play an important role in the formation and function of the nervous system, especially the human brain and retina. It is well known that DR is closely related to the optic nervous system. At the same time, DHA and its derivative neuroprotectin D-1 (NPD-1) also have neuroprotectiveeffects.21,22 EPA (ω-3) has many benefits for cardiovascular and has made important progress in the research of cardiovascular disease. It lowers serum triglyceride (TG) and non-high-density lipoprotein cholesterol (non-HDL-C) levels and reduces the formation of atherosclerosis.23,24 γ-Linolenic acid, as a precursor of arachidonic acid, also plays an important role in the inflammatory response,25 which deserves our further attention and research. In this experiment, the fatty acids mentioned above were all identified as potential lipid biomarkers of DR. Through the intervention of KLX, we could find that the relative intensity of γ-linolenic acid and DHA have a tendency to approach the control group and have statistical significance. This showed that KLX had a certain inhibitory effect on the inflammatory response of the model mice. Meanwhile, endogenous arachidonic acid is also produced in the body, which is mainly released from cell membrane phospholipids. The promoting enzymes involved mainly include phospholipase A2 (PLA2) family, phospholipase C (PLC) and phospholipase D (PLD).26 They all can promote the production of arachidonic acid and its derivatives. Among them, the biomarkers thromboxane A2 and prostaglandin D2 are derivatives of arachidonic acid with different functions. Thromboxane A2 is closely related to platelet aggregation and smooth muscle contraction, as well as neovascularization and metastasis.27 Thromboxane A2 can promote microvascular thrombosis and angiogenesis.28 Prostaglandin D2 plays an important role in maintaining the normal function of blood vessels, and it can mediate vasodilation and increase vascular permeability, inhibit platelet aggregation and chemotaxis of inflammatory cells, and also reduce intraocular pressure.29 Therefore, our data were consistent with the reports, and the content of arachidonic acid increased in the KLX intervention group. Leukotrienes are closely related to many inflammatory diseases, including tuberculous meningitis (TBM),30 tumors,31 and nervous system inflammation.32 The 15-LO-1/15-HETE system has been reported to promote angiogenesis by up-regulating ischemic cerebral vascular endothelial growth factor.33 From the relative intensity change, we could find that the biomarkers including thromboxane A2, prostaglandin D2, leukotriene A4, leukotriene B4 and 15(S)-HETE in the model group were significantly different from the control group. In the KLX intervention group, the key lipids also were adjusted back. It showed that KLX has a certain intervention effect on DR model mice. In summary, the discussion on arachidonic acid metabolism and unsaturated fatty acid biosynthesis showed that the two metabolic pathways were closely related to inflammatory response, neuropathy and vascular disease. Simultaneously, DR was a microvascular disease, which must also be accompanied by inflammatory response. Therefore, the two lipid metabolism pathways and key biomarkers in these pathways might become new targets for future DR treatment research.Six sterol lipid biomarkers were involved in the steroid hormone biosynthetic metabolism pathway. Plasma cortisol has been reported to increase significantly in the early and late stages of retinopathy, indicating that elevated plasma cortisol levels may be involved in the occurrence and development of DR.34 5β-Dihydrocortisol has been reported to enhance the role of glucocorticoid activity in glaucoma.35 In this study, compared with the control group, the cortisol and dihydrocortisol level of the model group was significantly increased, and was identified as a potential biomarker of DR. After KLX intervention, the level of cortisol and dihydrocortisol was significantly decreased. Seven glycerophospholipid biomarkers were mainly involved in glycerophospholipid metabolism. Of all the lipid biomarkers identified, the VIP value of the glycerophospholipid biomarkers was relatively high, and the VIP value of LysoPC (18:1 (9Z)) was the highest, indicating that LysoPC (18:1 (9Z)) was essential for disease development in DR model mice. Under the intervention of KLX, the relative intensity of the identified biomarkers, such as, LysoPA (16:0/0:0) and LysoPC (18:1 (9Z)), also tended to approach the control group. This further showed that KLX could control DR by regulating steroid hormone biosynthesis and glycerophospholipid metabolism. According to literatures, metabonomic studies of gestational diabetic women and their offspring have found disorders in glycerophospholipid metabolism and fatty acid metabolism, and steroid hormone biosynthesis.36 Some studies have shown that there was a correlation between advanced glycation end products related to hyperglycemia and changes in phosphatidylcholine metabolism in patients with diabetic osteoarthritis.37 In reviewing relevant studies on lipidomics and metabolomics, we could often find that in certain disease states, the glycerophospholipid metabolism pathway can interfere, such as coronary artery disease, Alzheimer's disease, etc38–40. However, there were relatively few studies on the relationship between glycerophospholipid metabolism and DR. Because of glycerophospholipid metabolism played an important role in many diseases, it was believed that it might also have an important influence in the development of DR. This requires our further exploration and research. In summary, the above four main metabolic pathways and the potential biomarkers of DR contained in them have not only been reported in the relevant literature, but also were consisted with the results of this experiment. But at the same time, the analysis results of lipidomics may only focus on the changes in lipid metabolism profile of DR model mice, which may have some limitations. In the following research, we will combine the experimental ideas of blood metabolomics, urine metabolomics and other multi-omics analysis to conduct the next experimental research.
Through the analysis of IPA software, we can obtain target activity information related to DR biomarkers. Among them, p38 MAPK/NF-κB has been proposed in many studies as a therapeutic target for DR. It is reported that curcumin can partially reduce diabetic retinal vascular leukopenia and leakage by inhibiting the p38 MAPK/NF-κB signaling pathway and inhibiting the induction of proinflammatory mediators downstream of the pathway.41 LncRNA HOTTIP can improve DR by regulating the p38 MAPK pathway.42 Through the study of glucocorticoids triamcinolone acetonide in the treatment of DR, it was found that the anti-inflammatory and anti-apoptotic effects of glucocorticoids may be mediated by inhibiting the p38 MAPK pathway of DR.43 The role of adrenocortical hormone-releasing hormone (CRH) in diabetic retinal microangiopathy and its possible mechanism studies has found that down-regulation of CRH can improve the visual impairment and retinal inflammatory response caused by diabetes. In addition, down-regulation of CRH can also lead to a decrease in p38 phosphorylation.44 The PI-3K/Akt and MAPK/Erk pathways are also very important for DR. Diabetic macular edema is the main cause of vision loss caused by DR. In exploring the role of endogenous ligand Apelin-13 in dimethyl ether vascular permeability and its mechanism, it was found that Apelin-13 can pass PI-3K/Akt and MAPK/Erk signaling pathways mediate early cytoskeleton and tightly linked promoters in diabetic macular edema.45 According to literatures, in order to investigate the interaction of carnosine with the MAPK/ERK signaling pathway and its therapeutic effect on DR, it was found that the expression of ERK and p-ERK was significantly inhibited after carnosine treatment, suggesting that the inhibition of MAPK/ERK signaling pathway activation may carnosine plays an important role in the prevention and treatment of DR.46 Chebulagic acid Tripbula's active ingredients chebulagic acid and gallic acid inhibit the angiogenesis and proinflammatory activity of retinal capillary endothelial cells induced by tumor necrosis factor-α (TNF-α) by inhibiting phosphorylation of p38, ERK and NF-κB.47 According to thestudies, miR-21-5p inhibits high glucose-induced proliferation and angiogenesis of retinal microvascular endothelial cells, and its role may depend in part on the regulation of the PI3K/Akt and ERK pathways by the target protein maspin.48 Saffron can inhibit the oxidative stress and pro-inflammatory response of diabetic retinopathy microglia by activating the PI3K/Akt signaling pathway.49 It has been reported that caffeic acid alkylamide derivatives can improve DR in rats by regulating ERK1/2 and Akt signaling pathways.50 In summary, we could find that the p38 MAPK/NF-κB signaling pathway, PI-3K/Akt, and MAPK/Erk pathway are closely related to DR, which is consistent with the results of our experiments. In this experiment, by importing the HMDB information of DR potential biomarkers into the IPA analysis software, relevant important target information and activity information was obtained. The research of biomarkers and target bioenzymes of diseases has become a research hotspot. However, in the disease state, the body's multiple metabolic pathways and various enzymes have all changed to some extent. And how to focus on the key targets from the huge amount of data that can be detected and observed is a problem we have been constantly exploring and digging. Lipidomics is just one aspect of omics research. The combination of multiple omics such as metabolomics, and functional omics may become the future development trend, which requires our researchers in biological science to make an effort.
5. Conclusions
In this study, UHPLC-Q-TOF/MS was used to characterize the key lipid biomarkers in DR model db/db mice plasma. Through lipidomics analysis combined with network database resources, a total of 30 biomarkers highly related to DR were identified. The main metabolic pathways included arachidonic acid metabolism, steroid hormone biosynthesis, and glycerophospholipid metabolism, etc. We first found that KLX delayed DR that could reverse 22 key lipid molecules as the potential targets to delay the occurrence of DR. Digging deeply the biological significance by IPA analysis, we found that the p38 MAPK/NF-κB signaling pathway, PI-3K/Akt, and MAPK/Erk pathway were closely related to DR. In conclusion, it showed that high-throughput lipidomics with the combination of multivariate statistical analysis, and deep excavating of the biological significance, could provide key target information for the future treatment of the global disease.Conflicts of interest
There are no conflicts to declare.Acknowledgements
This work was supported by grants from the Key Program of Natural Science Foundation of State (Grant No. 81830110, 81861168037, 81973745), Natural Science Foundation of Heilongjiang Province (YQ2019H030), Foundation of Heilongjiang University of Chinese Medicine (2018jc01, 201808), and Heilongjiang Touyan Innovation Team Program.References
- Y. Cui, Y. Zhu and J. C. Wang, et al. Imaging Artifacts and Segmentation Errors With Wide-Field Swept-Source Optical Coherence Tomography Angiography in Diabetic Retinopathy, Transl. Vis. Sci., 2019, 8(6), 18 CrossRef.
- P. Newsholme, V. F. Cruzat and K. N. Keane, et al. Molecular mechanisms of ROS production and oxidative stress in diabetes, Biochem. J., 2016, 473(24), 4527–4550 CrossRef CAS.
- S. K. Panigrahy, R. Bhatt and A. Kumar, Reactive oxygen species: sources, consequences and targeted therapy in type 2 diabetes, J. Drug Targeting, 2017, 25(2), 93–101 CrossRef CAS.
- M. E. Assar, J. Angulo and L. Rodríguez-Mañas, Diabetes and ageing-induced vascular inflammation, J. Physiol., 2016, 594(8), 2125–2146 CrossRef.
- D. L. Sheela, P. A. Nazeem and A. Narayanankutty, et al. Coconut phytocompounds inhibits polyol pathway enzymes: Implication in prevention of microvascular diabetic complications, Prostaglandins Leukot. Essent. Fatty Acids, 2017, 127, 20–24 CrossRef CAS.
- T. Y. Wong, C. M. Cheung and M. Larsen, et al. Diabetic retinopathy, Nat. Rev. Dis., 2016, 2, 16012 Search PubMed.
- Q. Liang, H. Liu and Y. Jiang, et al. Discovering lipid phenotypic changes of sepsis-induced lung injury using high-throughput lipidomic analysis, RSC Adv., 2016, 6(44), 38233–38237 RSC.
- C. Liu, W. J. Zong and A. H. Zhang, et al. Lipidomic characterisation discovery for coronary heart disease diagnosis based on high-throughput ultra-performance liquid chromatography and mass spectrometry, RSC Adv., 2018, 8(2), 647–654 RSC.
- A. H. Zhang, Z. M. Ma and L. Kong, et al. High-throughput lipidomics analysis to discover lipid biomarkers and profiles as potential targets for evaluating efficacy of Kai-Xin-San against APP/PS1 transgenic mice based on UPLC-Q/TOF-MS, Biomed. Chromatogr., 2020, 34(2), e4724 CAS.
- H.-L. Gao, A.-H. Zhang and Y. Jing-Bo, High-throughput lipidomics characterize key lipid molecules as potential therapeutic targets of Kaixinsan protects against Alzheimer’s disease in APP/PS1 transgenic mice, J. Chromatogr. B, 2018, 1092, 286–295 CrossRef CAS.
- H. L. Zhang, A. H. Zhang and X. H. Zhou, et al. High-throughput lipidomics reveal mirabilite regulating lipid metabolism as anticancer therapeutics, RSC Adv., 2018, 8, 35600–35610 RSC.
- C. Liu, W. J. Zong and A. H. Zhang, et al. Lipidomic characterisation discovery for coronary heart disease diagnosis based on high-throughput ultra-performance liquid chromatography and mass spectrometry, RSC Adv., 2018, 8(2), 647–654 RSC.
- S. Chen, H. Cheng, H. Yan and X. Liu, Clinical study of Keluoxin capsule combined with benazepril in the treatment of diabetic nephropathy, Mod. Med. Clin., 2020, 35(09), 1763–1766 Search PubMed.
- Yi Fu, W. Lin, F. Wang, Z. Wu and Yi Fu, Observation on the efficacy of Keluoxin capsule and Olmesartanmedoxomil in the treatment of diabetic nephropathy, J. Tradit. Chin. Med., 2020, 12(10), 116–118 Search PubMed.
- L. B. GuoFei, S. Liu, J. Du and X. Liu, Clinical study of Keluoxin capsule combined with compound α-keto acid in the treatment of diabetic nephropathy, Mod. Med. Clin., 2019, 34(11), 3413–3416 Search PubMed.
- Y. Zhao, Y. Wu and D. Song, A systematic review of the effectiveness and safety of Keluoxin capsules combined with ARB drugs in the treatment of diabetic nephropathy, Chin. J. Integr. Med., 2017, 18(07), 610–613 Search PubMed.
- X. Shen, N. Ma, J. Wu, J. Hu, Ke Xiao and X. Gao, Prevention and treatment of Keluoxin Capsules on STZ-induced diabetic retinopathy in rats, Chin. J. Exp. Tradit. Med. Formulae, 2014, 20(12), 188–192 Search PubMed.
- Y. Luo, S. Lu, L. Liu and L. Xu, et al. Study on the prevention and treatment of Keluoxin Capsules on early diabetic retinopathy in db/db mice, J. Tradit. Chin. Med., 2019, 44(11), 2324–2330 Search PubMed.
- J. M. Lu, Z. Z. Zhang and X. Ma, et al. Repression of microRNA-21 inhibits retinal vascular endothelial cell growth and angiogenesis via PTEN dependent-PI3K/Akt/VEGF signaling pathway in diabetic retinopathy, Exp. Eye Res., 2019, 107886 Search PubMed.
- A.-H. Zhang, H. Sun and G.-L. Yan, et al. Metabolomics study of type 2 diabetes using ultra-performance LC-ESI/quadrupole-TOF high-definition MS coupled with pattern recognition methods, J. Physiol. Biochem., 2014, 70(1), 117–128 CrossRef CAS.
- S. Afshordel, S. Hagl and D. Werner, et al. Omega-3 polyunsaturated fatty acids improve mitochondrial dysfunction in brain aging--impact of Bcl-2 and NPD-1 like metabolites, Prostaglandins Leukot. Essent. Fatty Acids, 2015, 92, 23–31 CrossRef CAS.
- Y. Nan, X. Zhou and Q. Liu, et al. Serum metabolomics strategy for understanding pharmacological effects of ShenQi pill acting on kidney yang deficiency syndrome, J. Chromatogr. B: Anal. Technol. Biomed. Life Sci., 2016, 1026, 217–226 CrossRef CAS.
- E. A. Brinton and R. P. Mason, Prescription omega-3 fatty acid products containing highly purified eicosapentaenoic acid (EPA), Lipids Health Dis, 2017, 16(1), 23 CrossRef.
- X. Wang, Q. Wang and A. Zhang, et al. Metabolomics study of intervention effects of Wen-Xin-Formula using ultra high-performance liquid chromatography/mass spectrometry coupled with pattern recognition approach, J. Pharm. Biomed. Anal., 2013, 74, 22–30 CrossRef CAS.
- J. K. Innes and P. C. Calder, Omega-6 fatty acids and inflammation, Prostaglandins, Leukotrienes Essent. Fatty Acids, 2018, 132, 41–48 CrossRef CAS.
- T. Sonnweber, A. Pizzini and M. Nairz, et al. Arachidonic Acid Metabolites in Cardiovascular and Metabolic Diseases, Int. J. Mol. Sci., 2018, 19(11), 3285 CrossRef.
- S. Sun, S. Chai, F. Zhang and L. Lu, Overexpressed microRNA-103a-3p inhibits acute lower-extremity deep venous thrombosis via inhibition of CXCL12, IUBMB Life, 2019, 72(3), 492–504 CrossRef.
- N. Nakahata, Thromboxane A2: physiology/pathophysiology, cellular signal transduction and pharmacology, Pharmacol. Therapeut., 2008, 118(1), 18–35 CrossRef CAS.
- W. L. Song, E. Ricciotti and X. Liang, et al. Lipocalin-Like Prostaglandin D Synthase but Not Hemopoietic Prostaglandin D Synthase Deletion Causes Hypertension and Accelerates Thrombogenesis in Mice, J. Pharmacol. Exp. Ther., 2018, 367(3), 425–432 CrossRef CAS.
- N. T. T. Thuong, D. Heemskerk and T. T. B. Tram, et al. Leukotriene A4 Hydrolase Genotype and HIV Infection Influence Intracerebral Inflammation and Survival From Tuberculous Meningitis, J. Infect. Dis., 2017, 215(7), 1020–1028 CrossRef CAS.
- T. T. L. Vo, W. J. Jang and C. H. Jeong, Leukotriene A4 hydrolase: an emerging target of natural products for cancer chemoprevention and chemotherapy, Ann. N. Y. Acad. Sci., 2018, 1431(1), 3–13 CrossRef.
- Y. Chiba, A. Shimada and M. Satoh, et al. Sensory system-predominant distribution of leukotriene A4 hydrolase and its colocalization with calretinin in the mouse nervous system, Neuroscience, 2006, 141(2), 917–927 CrossRef CAS.
- L. Chen, Y. M. Zhu and Y. N. Li, et al. The 15-LO-1/15-HETE system promotes angiogenesis by upregulating VEGF in ischemic brains, Neurol. Res., 2017, 39(9), 795–802 CrossRef CAS.
- R. P. Bhatia, Adarsh and R. H. Singh, Cortisol in diabetic retinopathy, Ann. Ophthalmol., 1983, 15(2), 128–130 CAS.
- B. I. Weinstein, G. G. Gordon and A. L. Southren, Potentiation of glucocorticoid activity by 5 beta-dihydrocortisol: its role in glaucoma, Science, 1983, 222(4620), 172–173 CrossRef CAS.
- Q. Chen, E. Francis, G. Hu and L. Chen, Metabolomic profiling of women with gestational diabetes mellitus and their offspring: Review of metabolomics studies, J. Diabetes Complicat., 2018, 32(5), 512–523 CrossRef.
- W. Zhang, E. W. Randell and G. Sun, et al. Hyperglycemia-related advanced glycation end-products is associated with the altered phosphatidylcholine metabolism in osteoarthritis patients with diabetes, PLoS One, 2017, 12(9), e0184105 CrossRef.
- Q. Liang, Y. Zhu and H. Liu, et al. High-throughput lipidomics enables discovery of the mode of action of huaxian capsule impacting the metabolism of sepsis, RSC Adv., 2017, 7(71), 44990–44996 RSC.
- Q. Liang, H. Liu and T. Zhang, et al. Untargeted lipidomics study of coronary artery disease by FUPLC-Q-TOF- MS, Anal. Methods, 2016, 8(6), 1229–1234 RSC.
- Q. Liang, H. Liu and T. Zhang, et al. Discovery of serum metabolites for diagnosis of progression of mild cognitive impairment to Alzheimer's disease using an optimized metabolomics method, RSC Adv., 2016, 6(5), 3586–3591 RSC.
- Y. Cai, W. Li and H. Tu, et al. Curcumolide reduces diabetic retinal vascular leukostasis and leakage partly via inhibition of the p38MAPK/NF-κB signaling, Bioorg. Med. Chem. Lett., 2017, 27(8), 1835–1839 CrossRef CAS.
- Y. Sun and Y. X. Liu, LncRNA HOTTIP improves diabetic retinopathy by regulating the p38-MAPK pathway, Eur. Rev. Med. Pharmacol. Sci., 2018, 22(10), 2941–2948 CAS.
- X. Zhang, D. Lai and S. Bao, et al. Triamcinolone acetonide inhibits p38MAPK activation and neuronal apoptosis in early diabetic retinopathy, Curr. Mol. Med., 2013, 13(6), 946–958 CrossRef CAS.
- C. Huang, H. J. Zhu and H. Li, et al. p38-MAPK pathway is activated in retinopathy of microvascular disease of STZ-induced diabetic rat model, Eur. Rev. Med. Pharmacol. Sci., 2018, 22(18), 5789–5796 CAS.
- Y. Li, Y. J. Bai and Y. R. Jiang, et al. Apelin-13 Is an Early Promoter of Cytoskeleton and Tight Junction in Diabetic Macular Edema via PI-3K/Akt and MAPK/Erk Signaling Pathways, BioMed Res. Int., 2018, 2018, 3242574 Search PubMed.
- Y. Guo, C. Guo, W. Ha and Z. Ding, Carnosine improves diabetic retinopathy via the MAPK/ERK pathway, Exp. Ther. Med., 2019, 17(4), 2641–2647 CAS.
- S. Shanmuganathan and N. Angayarkanni, Chebulagic acid Chebulinic acid and Gallic acid, the active principles of Triphala, inhibit TNFα induced pro-angiogenic and pro-inflammatory activities in retinal capillary endothelial cells by inhibiting p38, ERK and NFkB phosphorylation, Vasc. Pharmacol., 2018, 108, 23–35 CrossRef CAS.
- F. Qiu, H. Tong and Y. Wang, et al. Inhibition of miR-21-5p suppresses high glucose-induced proliferation and angiogenesis of human retinal microvascular endothelial cells by the regulation of AKT and ERK pathways via maspin, Biosci., Biotechnol., Biochem., 2018, 82(8), 1366–1376 CrossRef CAS.
- X. Yang, F. Huo and B. Liu, et al. Crocin Inhibits Oxidative Stress and Pro-inflammatory Response of Microglial Cells Associated with Diabetic Retinopathy Through the Activation of PI3K/Akt Signaling Pathway, J. Mol. Neurosci., 2017, 61(4), 581–589 CrossRef CAS.
- M. Fathalipour, M. Eghtedari and F. Borges, et al. Caffeic Acid Alkyl Amide Derivatives Ameliorate Oxidative Stress and Modulate ERK1/2 and AKT Signaling Pathways in a Rat Model of Diabetic Retinopathy, Chem. Biodiversity, 2019, 16(12), e1900405 CrossRef CAS.
Footnote |
| † Electronic supplementary information (ESI) available. See DOI: 10.1039/d0ra00343c |
| This journal is © The Royal Society of Chemistry 2021 |

