DOI:
10.1039/D0RA10285G
(Paper)
RSC Adv., 2021,
11, 5506-5511
Highly sensitive and selective detection of PCB 77 using an aptamer-catalytic hairpin assembly in an aquatic environment†
Received
6th December 2020
, Accepted 25th January 2021
First published on 1st February 2021
Abstract
Polychlorinated biphenyls (PCBs) are synthetic organic compounds that are extremely difficult to break down in water and can accumulate in human fat and organisms. However, methods that can be used to detect large amounts of PCBs remain unsatisfactory, as they are generally overly sensitive and involve complex operations. An aptamer-based catalytic hairpin assembly (aptamer-CHA) reaction for the selective detection of 3,3′,4,4′-tetrachlorobiphenyl (PCB 77) was developed. It combines the advantages of aptamers and signal amplification reactions. The aptamer selectivity recognizes the target, PCB 77, which triggers the sensitive CHA reaction to produce a fluorescence signal. CHA is a sensitive enzyme-free signal amplification method suitable for on-site detection. Therefore, the identification aptamer is the basis for the quantitative detection of PCB 77, with a detection range of 0.01 μg L−1 to 500 μg L−1 and a detection limit of 0.01 μg L−1. In this study, the aptamer was used to improve the selectivity of the reaction, and the CHA reaction improved the sensitivity of the detection system. Such high-sensitivity PCB detection capabilities with simplified procedures may be useful for real-time field detection and other monitoring tasks. This method can be used as a rapid fluorescence detection strategy for other targets in aquatic environments.
1. Introduction
Polychlorinated biphenyls (PCBs) are one of the 27 classes of environmental persistent organic pollutants controlled by the United Nations Environment Program (UNEP).1 PCBs are listed as carcinogens by the International Agency for Research on Cancer (IARC) because of their persistence, high biological toxicity, carcinogenicity and damage to the biological environment.2 According to the number and position of chlorine atoms, there are 209 homologues in theory, and more than 100 PCBs have been detected in the real environment.3 Despite the gradual elimination, reduction and control of PCBs, they still exist in the electric power, plastic processing, chemical, printing and other industries and widely exist in nature due to their good chemical inertia, heat resistance, incombustibility and high dielectric constant.4,5 Among them, PCB 77 is a typical coplanar polychlorinated biphenyl homologue with high biological toxicity and carcinogenicity; this PCB can cause cancer and other adverse health effects.6 Currently, the traditional monitoring of PCBs in samples is usually performed by gas chromatography-mass spectrometry (GC-MS)3,7,8 and high-performance liquid chromatography-mass spectrometry (HPLC-MS).9 These methods have high sensitivity, accuracy and repeatability, but their utility in field sampling for a target compound is limited due to the expensive instruments and professional technicians required and the high cost of analysis. Alternatively, immune-based detection methods are based on the immune polymerase chain reaction detection method, immune-based surface plasmon resonance detection, and immune-based electrochemical magnetic sensor detection.10–12 However, the sensitivity of these monitoring methods is average, and the procedures are generally complex. Therefore, it is necessary to further improve the sensitivity of PCB detection methods and the convenience of their procedures. PCB 77 detection methods with high sensitivity and simplified operating procedures may be helpful for field inspections and other work.
Compared with instrumental analysis or immunoassays, aptamer-CHA detection based on fluorescence spectroscopy has the advantages of simplicity, high selectivity and high sensitivity. At present, monoclonal antibodies are still the key identification element for the rapid detection of PCB 77. However, the preparation is time consuming, and the identification of small molecules is limited.13 Due to their highly flexible two-dimensional and three-dimensional structure and good selectivity, high sensitivity and high affinity for small and medium-sized molecules in the environment, aptamers have become ideal substitutes for antibodies. CHA is an isothermal cyclic amplification reaction that does not produce polymerization products but does produce a stable DNA double-chain structure. This reaction is different from other enzyme signal amplification methods,14–17 as it does not result in a polymeric product but rather produces a double strand of DNA18 and relies on only hybridization and chain substitution reactions to realize amplification, thus amplifying chemical signals and improving detection sensitivity.
Herein, we report a new fluorescence detection strategy based on aptamer-CHA reactions for PCB 77. The presence of PCB 77 led to the separation of the primer chain and aptamer, and the replaced primer chain triggered CHA to open hairpins and generate fluorescence signals. This detection method was applied to actual samples and showed high sensitivity and selectivity. Moreover, the method can be applied as a fluorescent sensor in the analysis of actual environmental water samples.
2. Experimental section
2.1. Chemicals
3,3′,4,4′-Tetrachlorobiphenyl (PCB 77), 2,3,4-trichlorobiphenyl (PCB 22), 2,2′,5,5′-tetrachlorobiphenyl (PCB 52), 2,3,3′,4,4′-pentachlorobiphenyl (PCB 105), 2,2′,3,3′,4,4′,5,5′,6,6′-decachlorobiphenyl (PCB 209), naphthalene, chloramphenicol, HgCl2, CuCl2, FeCl3, CoCl2, CaCl2 and H3AsO3 were purchased from Aladdin (Shanghai, China). The binding buffer (100 mM NaCl, 20 mM Tris–HCl (pH 7.6), 2 mM MgCl2, 5 mM KCl, 1 mM CaCl2, and 0.02% Tween 20) used in this research was purchased from Shanghai Sangon Biotechnology (Shanghai, China). The other reagents (acryl/bis solution (29![[thin space (1/6-em)]](https://www.rsc.org/images/entities/char_2009.gif) :
:![[thin space (1/6-em)]](https://www.rsc.org/images/entities/char_2009.gif) 1), urea, ammonium persulfate, 1× TAE buffer, N,N′,N,N′-tetramethyl ethylenediamine) used in the electrophoretic analysis were purchased from Shanghai Sangon Biotechnology (Shanghai, China). All reagents used in this work were of biomolecular grade, purchased and used without further purification. The aqueous solutions were all prepared with reverse osmosis water. DNA was ordered from Takara Biotechnology Co., Ltd. (Dalian, China) with HPLC purification, and the sequences are shown in Table 1.
1), urea, ammonium persulfate, 1× TAE buffer, N,N′,N,N′-tetramethyl ethylenediamine) used in the electrophoretic analysis were purchased from Shanghai Sangon Biotechnology (Shanghai, China). All reagents used in this work were of biomolecular grade, purchased and used without further purification. The aqueous solutions were all prepared with reverse osmosis water. DNA was ordered from Takara Biotechnology Co., Ltd. (Dalian, China) with HPLC purification, and the sequences are shown in Table 1.
Table 1 The DNA sequences
| Name |
Sequence (5′–3′) |
| Aptamer |
GGCGGGGCTACGAAGTAGTGATTTTTTCCGATGGCCCGTG |
| I |
ACGGGCCATCGGAAAAAATCACTA |
| H1 |
CACGAGACTGTTCACATCGGAAAAAATCACTAAGATGTGTACCTAGTGATTTTTTCCGATGGCCCGT |
| H2 |
/Cy-5/AGATGTGTACCTCGGAAAAAATCACTAGGTACACATC/BHQ-2/TTAGTGATT |
2.2. Apparatuses
All fluorescence assay measurements were performed on an RF-5301PC system (Shimadzu, Japan). The apparatuses used to prepare the aptamer and H1 and H2 hairpins included a Mini-7k (Allsheng, Shanghai), an M-Microcentrifuge (AndyBio, Beijing), an XW-80A vortex mixer (Qilinbeier, Jiangsu) and a T100™ thermal cycler (Bio-Rad, USA). The instruments used for gel electrophoresis were a DYY-2C system (LIUYI, Beijing) and a DYCZ-24EN system (LIUYI, Beijing). Electrophoresis imaging was performed with a Bio-Rad gel Doc 2000 imaging system for gel analysis.
2.3. Fluorescence assay
Primer chains and aptamers (1![[thin space (1/6-em)]](https://www.rsc.org/images/entities/char_2009.gif) :
:![[thin space (1/6-em)]](https://www.rsc.org/images/entities/char_2009.gif) 1 ratio) were added to the binding buffer (100 mM NaCl, 20 mM Tris–HCl (pH 7.6), 2 mM MgCl2, 5 mM KCl, 1 mM CaCl2, and 0.02% Tween 20), heated to 80 °C for 3 min, and then cooled to room temperature slowly to form a stable structure. H1 and H2 were added to binding buffer separately, followed by heating to 95 °C for 5 min, sitting on ice for 5 min, and finally sitting at room temperature for 1 h before further use.
1 ratio) were added to the binding buffer (100 mM NaCl, 20 mM Tris–HCl (pH 7.6), 2 mM MgCl2, 5 mM KCl, 1 mM CaCl2, and 0.02% Tween 20), heated to 80 °C for 3 min, and then cooled to room temperature slowly to form a stable structure. H1 and H2 were added to binding buffer separately, followed by heating to 95 °C for 5 min, sitting on ice for 5 min, and finally sitting at room temperature for 1 h before further use.
For feasibility assay experiments, different doses of aptamer, H1, H2 and PCB 77 were added to binding buffer. In the reaction, the added doses of aptamer, H1 and H2 were 100 nM, 100 nM and 150 nM, respectively. An aptamer-CHA reaction without aptamer or H1 or H2 was used as a negative control. Samples were incubated at 37 °C for 3 h, and fluorescence spectra were acquired. For quantitative assay experiments, 100 nM aptamer, 100 nM H1, and 150 nM H2 were added to binding buffer, and then different concentrations of PCB 77 were added into the binding solution. Samples were incubated at 37 °C for 3 h, and fluorescence spectra were acquired. For selectivity assay experiments, different targets (PCB 77, PCB 22, PCB 52, PCB 105, PCB 209, naphthalene, chloramphenicol, HgCl2, CuCl2, FeCl3, CoCl2, CaCl2 and H3AsO3) in equal amounts were used. Then, 100 nM aptamer, 100 nM H1, and 150 nM H2 were added to the binding buffer, and the different targets at 20 μg L−1 were added to the binding buffer. Samples were incubated at 37 °C for 3 h, and fluorescence spectra were obtained. All fluorescence data were obtained on an RF-5301PC system using 635 nm excitation and 660 nm emission.
2.4. Optimal assay
In the CHA reaction system, the doses of aptamer, H1 and H2 can affect the sensitivity of the reaction. The optimal doses of aptamer, H1, and H2 were determined according to Wu et al.19 Finally, the optimal reaction temperature and time were determined by a single-variable experiment.
2.5. Detection of PCB 77 in real samples
In this study, water samples were taken from the Jinan west sewage treatment plant, China. The collected water samples were filtered to remove suspended pollutants and eliminate their interfering fluorescence signals. Then, the filtered water samples (10 μL) and PCB 77 at different concentrations were added to binding buffer. The concentration range of the PCB 77 standard in the binding buffer was 0, 2, 4, 8, 12, and 20 μg L−1. The aptamer-CHA reaction system was used to measure fluorescence intensity and construct calibration curves.
3. Results and discussion
3.1. Principle of the fluorescence amplification reaction system
As shown in Scheme 1, in this fluorescence amplification reaction system based on aptamer-CHA analysis, the aptamer is the key not only as the recognition unit of the target but also as the starting unit of the CHA reaction. In the presence of PCB 77, the aptamer opens, and a target aptamer chain combines with PCB 77 to form a stable structure and releases another primer chain (I). Primer chain (I) is the starting strand that triggers CHA amplification of the two hairpins (H1 and H2). In the absence of PCB 77, and therefore any binding to aptamers to produce primer chains (I), H1 and H2 remain intact because their intramolecular hybridization prevents cross reactions to form rings. Once the target is added, the primer chain (I) is released and triggers the CHA amplification response, forming toeholds to assist H1 hybridization to produce a stranded structure (I–H1). The generated single-stranded portion on H1 then serves as a second toehold to initiate strand displacement to produce an intermediate structure (I–H1–H2), at which time H2 is turned on to generate the fluorescence signal. As a result of forming a stronger double-stranded structure (H1–H2), the primer chain (I) is released from H1 and catalyses the next round of the CHA reaction to achieve the signal amplification initiated by PCB 77.
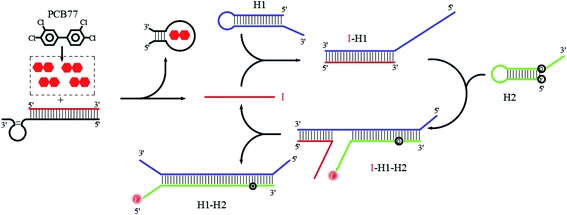 |
| | Scheme 1 Aptamer-CHA analysis for PCB 77 detection. | |
3.2. Feasibility and characterization
The results validating the feasibility of the aptamer-CHA reaction in binding buffer are shown in Fig. 1. In the absence of PCB 77, the fluorescence spectra show a low background value. In the presence of 20 μg L−1 PCB 77, the fluorescence signal increased ∼2-fold, indicating that PCB 77 caused aptamer-specific cleavage and generated primer chains to initiate the CHA reaction. The aptamer-CHA reaction without aptamer or H1, used as negative controls, showed low signals. The aptamer-CHA reaction without H2 was used as a negative control with no fluorescence signal. The above results were confirmed by evaluating the aptamer-CHA reaction system using 12% (w/w) denatured polyacrylamide gel electrophoresis (PAGE) (Fig. S1†).
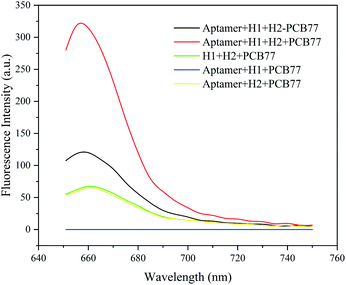 |
| | Fig. 1 Fluorescence spectra of the aptamer, H1 and H2 in buffer without PCB 77 and with PCB 77 (20 μg L−1). In the presence of 20 μg L−1 PCB 77, the aptamer-CHA reaction without aptamer or H1 or H2 was used as a negative control. | |
3.3. Optimization assay
The results show that there are many factors affecting the sensitivity of the reaction system, including reaction time and reaction temperature under the CHA reaction conditions. Fig. 2A and B present the optimal temperature and time for the CHA reaction, determined in the single-variable experiment. After 3 h, the added value of the fluorescence signal slows down, which may be due to the high consumption of H1 and H2 hairpins, which slows down the CHA reaction. Therefore, the optimal response time was determined to be 3 h (Fig. 2A and S2†). At 37 °C, the response of the fluorescence signal was maximal, so 37 °C was determined to be the optimal reaction temperature of the whole system (Fig. 2B and S3†).
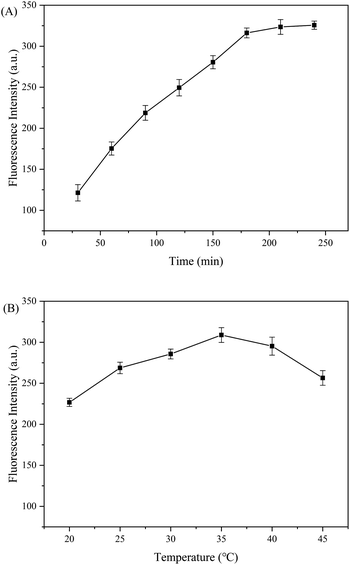 |
| | Fig. 2 Optimization analysis of the aptamer-CHA reaction. (A) The optimum reaction time curve of the reaction system. (B) The optimum reaction temperature curve of the reaction system. | |
3.4. Fluorescence signal response of the aptamer-CHA reaction
To determine whether the aptamer-CHA reaction system could quantitatively detect PCB 77 in buffer, the fluorescence spectra of PCB 77 at different concentrations were acquired. Fig. 3A shows the fluorescence signals of the aptamer-CHA reaction system measured at different concentrations of PCB 77, ranging from 0 μg L−1 to 500 μg L−1. The fluorescence signal intensity at 660 nm increased linearly with the PCB 77 concentration from 0.1 μg L−1 to 20 μg L−1, with a correlation coefficient of 0.993 (Fig. 3B). The LOD was 0.01 μg L−1 (3σ/slope rule), which is below the maximum level of 0.5 ppb allowed in drinking water by the Environmental Protection Agency (EPA). Thus, the proposed assay has a good advantage over the previously reported PCB 77 detection methods (Table 2). The results of this work are better than the results for most of the current detection methods.
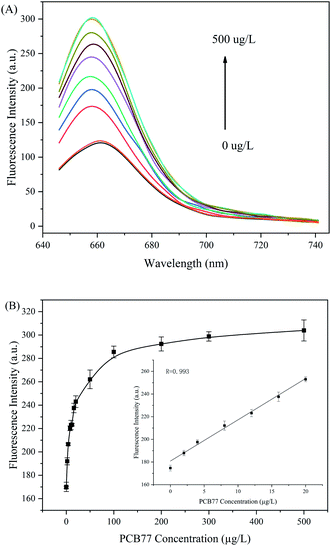 |
| | Fig. 3 Optimization of the aptamer-CHA reaction. (A) Fluorescence signal increase in the aptamer-CHA reaction as the concentration of PCB 77 increased from 0, 0.1, 1, 10, 20, 50, 100, 200, 300, 500 μg L−1. (B) The relationship between fluorescence intensity and PCB 77 concentration. The illustration shows an enlarged view of the linear region. | |
Table 2 Comparison of the detection limit obtained with the aptamer-CHA reaction with those of previously reported methods
| Target |
Detection platform |
LOD [nM] |
Detection range [nM] |
Ref. |
| PCB 77 |
GC |
— |
3.9 × 10⁻² |
9.2 × 10⁻² |
20 |
| Fluorescence |
3.4 × 10⁻¹ |
3.4 × 10⁻¹ |
3.4 × 10² |
21 |
| Colorimetric |
5.0 × 10⁻² |
5.0 × 10⁻¹ |
9.0 × 10² |
22 |
| SERS |
1.0 × 10⁻³ |
1.0 × 10⁻³ |
1.0 × 100 |
23 |
| SERS |
1.0 × 10⁻² |
1.0 × 10⁻² |
1.0 × 10² |
24 |
| SERS |
3.3 × 10⁻² |
3.3 × 10⁻² |
1.0 × 10⁴ |
25 |
| SERS |
2.4 × 10⁻⁷ |
1.0 × 10⁻⁶ |
1.0 × 10⁻² |
26 |
| Electrochemical |
3.4 × 10⁻² |
1.0 × 10³ |
1.2 × 100 |
27 |
| Electrochemical |
3.4 × 10⁻¹ |
3.4 × 100 |
3.4 × 101 |
28 |
| Electrochemical |
2.0 × 10⁻³ |
3.4 × 10⁻⁸ |
3.4 × 10⁻¹ |
29 |
| Electrochemical |
2.7 × 10⁻⁷ |
1.0 × 10⁻³ |
3.4 × 10⁻¹ |
30 |
| LC |
5.0 × 10⁻⁵ |
5.0 × 10⁻⁵ |
5.0 × 101 |
31 |
| Fluorescence |
3.4 × 10⁻² |
3.4 × 10⁻² |
1.7 × 10³ |
This work |
3.5. Selectivity of the aptamer-CHA assay
PCBs and other interfering toxic organic pollutants are often present in polluted aquatic environments. The selectivity of the aptamer-CHA reaction was evaluated with four structural analogues (PCB 22, PCB 52, PCB 105 and PCB 209) and two functional analogues (naphthalene and chloramphenicol) in equal doses. The results in Fig. 4 and S4† show that the fluorescence signal of PCB 77 was the highest, and the fluorescence signals of PCB 22, PCB 52 and PCB 105 were half that of PCB 77. Among the tested analogues, tetrachlorobiphenyls produced high fluorescence signal responses, which may be due to their structural similarity to PCB 77. However, because the structures of PCB 209, naphthalene and chloramphenicol are different from that of PCB 77, they produced almost no increase in the fluorescence signal. To avoid interferences from heavy metal ions or metal-like ions that affect the experimental selectivity, Hg2+, Cu2+, Fe3+, Co2+, Ca2+ and As3+ were evaluated, and almost no fluorescence signal was generated by these ions. These results suggest that the compatibility and selectivity of the aptamer to PCBs need further improvement. To use the aptamer-CHA reaction as a biological detection system for pollutant analysis in an aquatic environment, its sensitivity and reproducibility must be greatly improved.
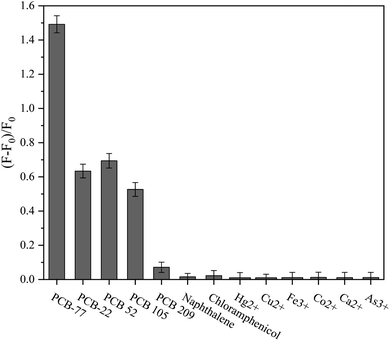 |
| | Fig. 4 Selectivity of the aptamer-CHA reaction. The dose of disruptors was 20 μg L−1. An error bar represents the error for three independent experiments. | |
3.6. Reproducibility, repeatability and long-term stability
The reproducibility, repeatability and long-term stability of the developed aptamer-CHA reaction to detect PCB 77 were evaluated. Fig. S5A† shows the detection of PCB 77 was prepared by seven aptamer-CHA reactions under the same conditions. Fig. S5B† shows the aptamer-CHA reaction detection of seven PCB 77 was prepared under the same conditions. For reproducibility and repeatability, the fluorescence intensity of the same concentration sample did not change significantly. Fig. S5C† represents the detection of PCB 77 from 2, 4, 8, 12, 24, 48, 72 h. Within 72 h, the fluorescence intensity of the sample at the same concentration was measured, and the fluorescence attenuation value was less than 95%. The results show that the reactivity system has good reproducibility, repeatability and long-term stability in detecting PCB 77.
3.7. Water sample analysis
To further evaluate the detection accuracy of the system in natural polluted water samples, we measured the concentration of PCB 77 in a water sample using the established method. As indicated in Fig. 5 and S6,† the fluorescence intensity increased significantly with increasing PCB 77 concentration in the range of 0–20 μg L−1. In addition, the relative fluorescence intensity showed a good linear correlation with the concentration of PCB 77. The correlation equation was y = 4.103x + 12.512, and the correlation coefficient was R2 = 0.993. The content of PCB 77 estimated by the standard addition method was 15.28 μg L−1 in a real sample containing 10 μL of polluted water in a volume of 50 μL. The linear dependence of the fluorescence intensity on the PCB 77 concentration indicates that this method can quantitatively determine the content of PCB 77 in actual water samples. In order to further verify its accuracy, the recovery experiment was supplemented (Table S1†).
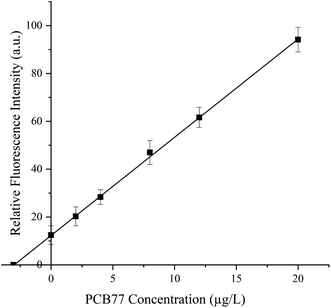 |
| | Fig. 5 Detection of PCB 77 in a real wastewater sample. The fluorescence curves for the detection of 10 μL of a wastewater sample containing 0, 2, 4, 8, 12, or 20 μg L−1 PCB 77. | |
4. Conclusion
In conclusion, an aptamer-CHA reaction system for detecting PCB 77 was developed, and its performance was demonstrated. This method has high sensitivity and selectivity, proving the validity of this aptamer identification strategy. It makes use of aptamers to identify PCB 77, which triggers the reaction, thus simplifying the experimental operation. It has the advantages of high sensitivity, good selectivity, simple operation and a wide detection range. The system has broad application prospects in the detection of harmful substances in aquatic environments because of the absence of a complex pretreatment process. Our subsequent experiments will increase the versatility and stability of the reaction system, making it more suitable for on-site aquatic environmental detection.
Conflicts of interest
There are no conflicts to declare.
Acknowledgements
This work was supported by the Project of Green Manufacturing System, the Open Subject of Jiangsu Key Laboratory of Anaerobic Biotechnology (JKLAB201605 and JKLAB201703), the Young Doctorate Cooperation Fund Project of Advanced Materials Institute, Shandong Academy of Science (2018QNHZ04), and the Shandong Key Scientific and Technical Innovation Project (2018YFJH0902).
References
- X. P. Wang, P. Gong, T. D. Yao and K. C. Jones, Environ. Sci. Technol., 2010, 44, 2988–2993 CrossRef CAS.
- T. Vasko, J. Hoffmann, S. Gostek, T. Schettgen, N. Quinete, C. Preisinger, T. Kraus and P. Ziegler, Sci. Rep., 2018, 8, 16903 CrossRef.
- L. K. Ackerman, G. R. Wilson and S. L. Simonich, Anal. Chem., 2005, 77, 1979–1987 CrossRef CAS.
- G. G. Ying, C. A. Rawson, R. S. Kookana, M. S. Warne, P. A. Peng, X. M. Li, E. Laginestra, L. A. Tremblay, J. C. Chapman and R. P. Lim, J. Environ. Monit., 2009, 11, 1687–1696 RSC.
- G. O. Thomas, Encyclopedia of Ecology, 2008, vol. 85, pp. 2872–2881 Search PubMed.
- J. Liu, D. Hu, G. Jiang and J. L. Schnoor, Environ. Sci. Technol., 2009, 43, 7503–7509 CrossRef CAS.
- O. S. Olatunji, Sci. Rep., 2019, 9, 538 CrossRef.
- S. Josefsson, K. Leonardsson, J. S. Gunnarsson and K. Wiberg, Environ. Sci. Technol., 2010, 44, 7456–7464 CrossRef CAS.
- C. Bandh, R. Ishaq, D. Broman, C. Näf, Y. Rönquist-Nii and Y. Zebühr, Environ. Sci. Technol., 1996, 30, 214–219 CrossRef CAS.
- Y. Wang, J. Bai, B. Huo, S. Yuan, M. Zhang, X. Sun, Y. Peng, S. Li, J. Wang and B. Ning, Anal. Chem., 2018, 90, 9936–9942 CrossRef CAS.
- H. Y. Chen and H. S. Zhuang, Anal. Bioanal. Chem., 2009, 394, 1205–1211 CrossRef CAS.
- S. Hong, T. Kang, S. Oh, J. Moon, I. Choi, K. Choi and J. Yi, Sens. Actuators, B, 2008, 134, 300–306 CrossRef CAS.
- C. C. Huang, S. H. Chiu, Y. F. Huang and H. T. Chang, Anal. Chem., 2007, 79, 4798–4804 CrossRef CAS.
- P. Yin, H. M. Choi, C. R. Calvert and N. A. Pierce, Nature, 2008, 451, 318–322 CrossRef CAS.
- M. Liu, Q. Zhang, D. Chang, J. Gu, J. D. Brennan and Y. Li, Angew. Chem., 2017, 56, 6142–6146 CrossRef CAS.
- L. L. Tian, T. M. Cronin and Y. Weizmann, Chem. Sci., 2014, 5, 4153–4162 RSC.
- H. Y. Liu, T. Tian, Y. H. Zhang, L. H. Ding, J. H. Yu and M. Yan, Biosens. Bioelectron., 2017, 89, 710–714 CrossRef.
- F. C. Simmel, B. Yurke and H. R. Singh, Chem. Rev., 2019, 119, 6326–6369 CAS.
- Z. Wu, H. Fan, N. S. R. Satyavolu, W. Wang, R. Lake, J. H. Jiang and Y. Lu, Angew. Chem., Int. Ed., 2017, 8721–8725 CrossRef CAS.
- T. Ali, S. Ozcan and M. E. Aydin, Anal. Chim. Acta, 2009, 647, 182–188 CrossRef.
- S. M. Xu, H. Yuan, S. P. Chen, A. Xu, J. Wang and L. J. Wu, Anal. Biochem., 2012, 423, 195–201 CrossRef CAS.
- R. Cheng, S. Liu, H. Shi and G. Zhao, J. Hazard. Mater., 2018, 341, 373–380 CrossRef.
- Y. Lu, Q. Huang, G. Meng and L. Wu, Analyst, 2014, 139, 3083–3087 RSC.
- C. Fu, Y. Wang, G. Chen, L. Yang, S. Xu and W. Xu, Anal. Chem., 2015, 87, 9555 CrossRef CAS.
- K. Sun, Q. Huang, G. Meng and Y. Lu, ACS Appl. Mater. Interfaces, 2016, 8, 5723–5728 CrossRef CAS.
- X. Fang, Y. Song, Y. Huang, G. Yang, C. Han, H. Li and L. Qu, Analyst, 2020, 145 Search PubMed.
- L. D. Wu, P. P. Qi, X. C. Fu, H. Liu, J. C. Li, Q. Wang and H. Fan, J. Electroanal. Chem., 2016, 771, 45–49 CrossRef CAS.
- B. Zhang, P. Tian, L. Lv, L. Xie, H. Chen and B. He, Anal. Methods, 2020, 12, 4579–4587 RSC.
- L. Wu, X. Lu, X. Fu, L. Wu and H. Liu, Sci. Rep., 2017, 7, 5191 CrossRef.
- A. Mohammadi, E. Heydari-Bafrooei, M. M. Foroughi and M. Mohammadi, Microchem. J., 2020, 155, 104747 CrossRef CAS.
- A. Verdian, Z. Rouhbakhsh and E. Fooladi, J. Hazard. Mater., 2020, 402, 123531 CrossRef.
Footnote |
| † Electronic supplementary information (ESI) available. See DOI: 10.1039/d0ra10285g |
|
| This journal is © The Royal Society of Chemistry 2021 |
Click here to see how this site uses Cookies. View our privacy policy here.  Open Access Article
 *a and
Fengshan Zhang*b
![[thin space (1/6-em)]](https://www.rsc.org/images/entities/char_2009.gif) :
:![[thin space (1/6-em)]](https://www.rsc.org/images/entities/char_2009.gif) 1), urea, ammonium persulfate, 1× TAE buffer, N,N′,N,N′-tetramethyl ethylenediamine) used in the electrophoretic analysis were purchased from Shanghai Sangon Biotechnology (Shanghai, China). All reagents used in this work were of biomolecular grade, purchased and used without further purification. The aqueous solutions were all prepared with reverse osmosis water. DNA was ordered from Takara Biotechnology Co., Ltd. (Dalian, China) with HPLC purification, and the sequences are shown in Table 1.
1), urea, ammonium persulfate, 1× TAE buffer, N,N′,N,N′-tetramethyl ethylenediamine) used in the electrophoretic analysis were purchased from Shanghai Sangon Biotechnology (Shanghai, China). All reagents used in this work were of biomolecular grade, purchased and used without further purification. The aqueous solutions were all prepared with reverse osmosis water. DNA was ordered from Takara Biotechnology Co., Ltd. (Dalian, China) with HPLC purification, and the sequences are shown in Table 1.
![[thin space (1/6-em)]](https://www.rsc.org/images/entities/char_2009.gif) :
:![[thin space (1/6-em)]](https://www.rsc.org/images/entities/char_2009.gif) 1 ratio) were added to the binding buffer (100 mM NaCl, 20 mM Tris–HCl (pH 7.6), 2 mM MgCl2, 5 mM KCl, 1 mM CaCl2, and 0.02% Tween 20), heated to 80 °C for 3 min, and then cooled to room temperature slowly to form a stable structure. H1 and H2 were added to binding buffer separately, followed by heating to 95 °C for 5 min, sitting on ice for 5 min, and finally sitting at room temperature for 1 h before further use.
1 ratio) were added to the binding buffer (100 mM NaCl, 20 mM Tris–HCl (pH 7.6), 2 mM MgCl2, 5 mM KCl, 1 mM CaCl2, and 0.02% Tween 20), heated to 80 °C for 3 min, and then cooled to room temperature slowly to form a stable structure. H1 and H2 were added to binding buffer separately, followed by heating to 95 °C for 5 min, sitting on ice for 5 min, and finally sitting at room temperature for 1 h before further use.


