 Open Access Article
The degradation of cellulose in ionic mixture solutions under the high pressure of carbon dioxide
Sumarno *a,
Prida Novarita Trisantia,
Bramantyo Airlanggaa,
Novi Eka Mayangsarib and
Agus Haryonoc
aChemical Engineering Department, Insitut Teknologi Sepuluh Nopember, Kampus ITS, Sukolilo, Surabaya, Indonesia. E-mail: onramus@chem-eng.its.ac.id
bWaste Treatment Engineering Department, Politeknik Perkapalan Negeri Surabaya (PPNS), Surabaya, Indonesia
cPolymer Chemistry Group, Research Center for Chemistry, Indonesian Institute of Sciences (LIPI), Kawasan Puspiptek Serpong 15314, Indonesia
First published on 20th January 2021
Abstract
This work aims to study the product characteristics of cellulose degradation not only by a hydrothermal process but also in combination with a sonication process. Herein, 4.3 mL of oxalic acid (H2C2O4)–sodium chloride (NaCl) solution containing cellulose was placed into a stainless steel reactor (or the mixture was placed into the reactor after the sonication process for 1 hour); then, carbon dioxide (CO2) was released for pressurization. Degradation was performed under certain pressures (70 and 200 bar) and temperatures (125 °C and 200 °C) at various times. Scanning Electron Microscopy (SEM) results indicated that the sonication pretreatment process affected the solid cellulose, making it rougher or fibrous than the non-sonicated process. XRD characterization results indicated that both process types caused changes in the crystallinity and composition of cellulose I and II with pressure, temperature, and time. The combination of sonication and hydrothermal processes resulted in lower crystallinity. Changes in crystallinity showed different characteristics in swelling, reduced the interaction between chains, and even broke the polymer chains inside the particles. In a hydrothermal process at 200 bar and 200 °C, a maximum reducing sugar concentration of 5.1 g L−1 was obtained, while 3.2 g L−1 was obtained in the combined sonication and hydrothermal process under the same operating condition, which is below the value attained at 200 °C and 70 bar. These results indicated the existing competition between the formation and further degradation of the reducing sugar, a phenomenon explained by the presence of a monomer (reducing sugar), an oligomer (cellotriose), and 5-HMF (5-hydroxymethyl-2-furaldehyde) in a liquid product processed under hydrothermal conditions.
1. Introduction
Depending on the plant species, cellulose is widely present in nature as the main ingredient of biomass. In plants, cellulose is bound to two other main ingredients: lignin and hemicellulose. In general, biomass contains 35–50% cellulose, 25–35% hemicellulose, and 10–25% lignin.1 Therefore, cellulose is believed to be a material sourced from the biomass derived from sustainable resources. Among the various components of biomass, cellulose is the most abundant and inexhaustible organic raw material that meets the need for environmentally friendly and biocompatible natural products.2 As a raw material, cellulose is an important ingredient in making other organic products. Cellulose can be obtained from industrial timber harvest, agricultural waste, plantation, and forest crops. The biomass processing into a high-value derivative material is very important and should be a priority. All countries have the potential to produce such plants as a source of cellulosic feedstock. Currently, economically acceptable processes for sustainable raw materials (such as cellulose), mostly consisting of abundant available biomass even from forest wood processing residues, and agricultural and plantation waste are developed.3Cellulose is a linear homopolysaccharide of D-glucopyranose units linked through β-(1,4) linkages.4 This structure is a linear polyreducing sugar as in amylose. The anhydrous reducing sugar unit is connected via an α-1,4-glycosidic bond. Humans can digest amylose, but not cellulose. Natural cellulose is a semicrystalline polymer with crystalline sections formed by polymer alignment and held together by strong hydrogen bonding (in-plane) and van der Waals interactions (between planes).4 The long chain of cellulose molecules ranges from 100 to 14![[thin space (1/6-em)]](https://www.rsc.org/images/entities/char_2009.gif) 000 units. Therefore, cellulose has an average molecular weight of about 300
000 units. Therefore, cellulose has an average molecular weight of about 300![[thin space (1/6-em)]](https://www.rsc.org/images/entities/char_2009.gif) 000–500
000–500![[thin space (1/6-em)]](https://www.rsc.org/images/entities/char_2009.gif) 000 and is the constituent component of all plant cell walls. Double hydroxyl groups in the reducing sugar chain form hydrogen bonds with oxygen molecules in the same reducing sugar chain or in the closest reducing sugar chain, forming strong bonds with high tensile strength.5 Strong bond changes between molecules in cellulose occur due to processing with ethanolamine (under atmospheric conditions). As reported by Segal et al., it was concluded that there was a decrease in the degree of polymerization (DP) and of crystallization.6
000 and is the constituent component of all plant cell walls. Double hydroxyl groups in the reducing sugar chain form hydrogen bonds with oxygen molecules in the same reducing sugar chain or in the closest reducing sugar chain, forming strong bonds with high tensile strength.5 Strong bond changes between molecules in cellulose occur due to processing with ethanolamine (under atmospheric conditions). As reported by Segal et al., it was concluded that there was a decrease in the degree of polymerization (DP) and of crystallization.6
The controlled process of cellulose degradation will provide monomers, oligomers, and other useful products and reduce the occurrence of unwanted products, such as further degradation of monomers. Cellulose (polysaccharides) can be degraded to smaller chemical compounds such as reducing sugars, maltose, cellobiose, maltotriose, and cellotriose. Degradation involves breaking the glycosidic bonds (primary covalent bonds) between the monomer residues and breaking the intra- and intermolecular hydrogen bonds in the middle of and between polymer chains. The intramolecular hydrogen bond in cellulose is responsible for the stiffness of the chain, while the intermolecular hydrogen bond renders crystallinity.7 These bonds make cellulose difficult to decompose and difficult to dissolve in water and most organic solvents.8 Therefore, cellulose is not used in industries such as medicine, food, and others.
There are several known methods to degrade or decompose cellulose to oligomers, monomers, or smaller molecules, even gases, one of which is cellulose hydrolysis using a liquid acid catalyst, which is efficient. Although the acid used in cellulose hydrolysis is simple, there are some serious problems, such as use of water, corrosion of equipment, generation of huge amounts of waste, disposal of waste, and recycling of solvents, making this method unattractive.9,10 Moreover, long exposure of cellulosic materials to mineral acids can lead to further degradation. Another method widely applied in industries is enzymatic cellulose degradation, although it requires a long processing time. It is carried out by direct means or by the other pretreatments such as sonication.11 The initial treatment of the sample affects the result of the enzymatic cellulose degradation. Khodaverdi et al. (2012) reported the kinetic modeling study of enzymatic hydrolysis of commercial cellulose.12 Hydrolysis of cellulose with high yield selectivity to reducing sugars and cellobiose products has been carried out in ionic liquids.13
Some methods are processing with sub- and supercritical water.14,15 Currently, cellulose degradation in sub- or supercritical water is very efficient, which occurs within a short reaction time. This is because water acts as a solvent and a strong reaction medium under these conditions.16 However, this process provides a less directional distribution of the product; therefore, some researchers apply a catalyst to have a high selectivity of the reaction product.3 Cellulose reactions in sub- and supercritical water are affected by the catalyst and operating conditions, which determine the resulting product.17
Sasaki et al.15 reported that the results of hydrolysis in near-sub- and supercritical water (250 bar, 320–400 °C, and 0.05–10.0 s) have proved that the decomposition of reducing sugars and cellobiose is much faster than the rate of hydrolysis of cellulose. Rogalinski et al.18 reported a study of the hydrolysis kinetics of biopolymers (cornstarch and cellulose) in subcritical water, where the liquid surface of water is pressed with carbon dioxide (CO2). They explained that the use of CO2 that is dissolved in water as a gas suppressor resulted in a significant increase in the reaction speed. CO2 acts as a catalyst for hydrolysis reactions. The application of the sonication method to process cellulose was studied and reported by Pinjari and Pandit.19 They reported that the sonication process can reduce the size of highly crystalline cellulose. X-ray diffraction (XRD) and differential scanning calorimetry (DSC) analyses obtained a decrease in crystallinity from 86.56% to 37.76% and a decrease in the melting temperature from 101.78 °C to 60.13 °C. The utilization of sodium chloride (NaCl) salts in combination with oxalic acid (H2C2O4) and maleic acid for cellulose decomposition was studied by Stein et al.20 This research was carried out at 30 bar and 125 °C using CO2 for gas pressurization. They concluded that the combination of NaCl and dicarboxylic acids produced a more soluble oligomer than the acid alone. The reducing sugar concentration in the products was 2.80–3.90 g L−1. They also reported that 6 hours processing resulted in a 14- to 20-fold increase in the concentration of glucose yielded without NaCl, which was originally 0.2 g L−1.
In this study, cellulose decomposition by hydrothermal processes (pressurized with CO2) with and without the initial pretreatment of sonication was performed. The sonication pretreatment process was applied to convert hard bulk solid cellulose into more crushed and fibrous cellulose by increasing the reaction surface area to enhance the chemical reaction under hydrothermal conditions. The fibrous state allows easy and quick diffusion of ions from acid and salt catalysts to the central part of the fibrous material. The process of the formation of acoustic cavitation bubbles is as follows (in sequence and simultaneously): bubble formation, successive growth, collapse, and microjet formation.21–23 The theoretical estimation of the bubble collapse temperature and pressure can reach 5300 °C and 310 bar, respectively, and the H and OH radical fraction produced per collapse event is higher24,25 (the value set for the sonication frequency was 20 kHz). The microjets intensively pierce and attack the cellulose surface, damaging the cellulose solids. The H and OH radicals that are formed will help break the glycosidic bond. (Savitri et al. reported the application of the sonication method in the degradation of chitosan by sonication at low concentrations of acetic acid.26 The chitosan morphology becomes porous, and fiber-like parts and layer areas were formed. The acetic acid concentration affects the substances produced during the sonication process.) The next step is the hydrothermal process, where H2C2O4 and NaCl are added as simple ions to increase the ability of the solution medium to break the glycosidic bonds under subcritical conditions. The two materials work together: salt ions will break the intra- and hydrogen bonds of the cellulose, while H2C2O4 helps break the intermolecular glycosidic bonds.20 This paper studies the morphological changes in solid cellulose due to the effects of temperature (125 °C and 200 °C) and pressure (70 and 200 bar) at various times of degradation under hydrothermal conditions. The results were compared with products obtained by the combination of the sonication pretreatment and hydrothermal process under the same operating conditions. The liquid products are analyzed for the reducing sugar concentration and the solid products for the crystallinity. The SEM photographs are also obtained and analyzed to understand the changes in the microstructure.
2. Experimental method
2.1 Materials
The Avicel microcrystalline cellulose PH 102 with DP 100–300 (Asahi Kasei Chemical Corp.) was used. NaCl, H2C2O4, sodium hydroxide, and potassium sodium tartrate were purchased from Merck (both NaCl and H2C2O4 were used as simple ionic liquids). CO2 as a gas pressurizer was supplied by PT. Ginta Prima and 3,5-dinitrosalicylic acid (DNS) were purchased from Sigma Aldrich.2.2 Experimental apparatus and procedures
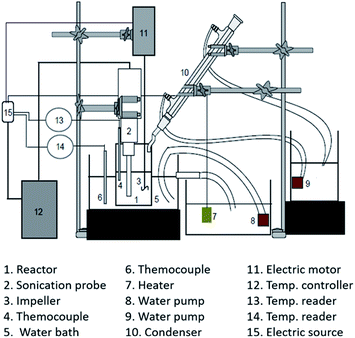
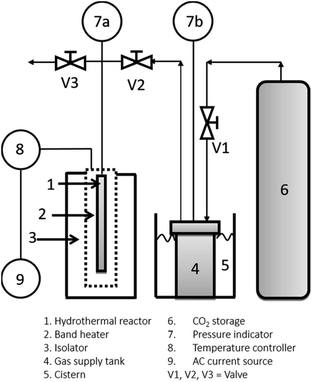
Two experimental apparatus schema were used for cellulose degradation in this work: (1) sonication and (2) hydrothermal apparatus. Fig. 1 shows the setup of the experimental apparatus used for cellulose degradation by a sonication method. A 200 mL stainless steel reactor equipped with a water condenser was used. A cellulose suspension was prepared as follows: first, 100 mL of a mixture containing 0.1 M H2C2O4 and 20% NaCl (w/w) was prepared. Cellulose (2 g) was added into the mixture, and the cellulose concentration in the liquid was made up to 20 g L−1 (w/v). The mixture was gently agitated to ensure that the homogeneous cellulose particles were suspended in the bulk mixture, and then delivered into the sonication reactor. Sonication (high-intensity ultrasonic processor VCX 500, 500 W, 20 kHz, 50% amplitude; Sonics and Materials, Inc., USA) was conducted at 40 °C for 1 hour.Fig. 2 shows the apparatus used for cellulose degradation by the hydrothermal method. The reactor shown in Fig. 2 is the bath reactor made with a stainless tubing system from Swagelok with dimensions of 0.25 inch diameter, 34.5 cm height, and about 4.3 mL internal volume. The reactor was then loaded with 3 mL of the solution (sample mixture after gentle agitation only). When the combined sonication and hydrothermal process was performed, the sonication process was applied to the suspended solution before loading into the hydrothermal reactor. CO2 was delivered into the reactor up to a desired processing temperature and pressure. Under the high pressure of CO2, the solution consists of carbonic acid, NaCl, and H2C2O4. We called this ionic mixture solution (IMS). The hydrothermal process was conducted with temperature (125 °C; 200 °C) and pressure (70 bar; 200 bar) variation with the processing time up to 180 minutes.
After achieving the processing time, the reactor was immediately immersed into an ice bath to stop the reaction and slowly decompressed to the atmospheric condition. The samples were taken out from the reactor, and the liquid (analysed with DNS and LC-MS) and solid (analysed with SEM and XRD) portions were separated for characterization.27,28
2.3 Product characterization
 | (1) |
3. Result and discussion
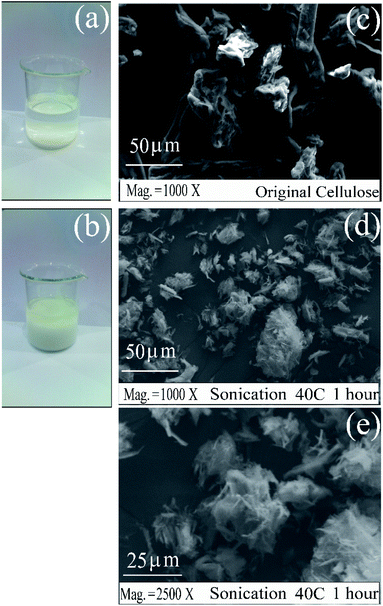
We have investigated the cellulose solid material after processing in the IMS by normal stirring and a sonication process. The cellulose was introduced into and stirred in the mixture solution of H2C2O4 and NaCl, with two different mixing treatments: (a) a mixing process using a magnetic stirrer and (b) mixing under sonication at 40 °C for 1 hour. The results are shown in Fig. 3. Under stirring using a magnetic stirrer, cellulose was well separated or deposited at the base of the glass beaker (Fig. 3(a)). After sonication, cellulose swelled and floated inside the solution thoroughly (Fig. 3(b)). The sonication process affected the physical conditions as shown by the swelling appearance, which indicated that its bulk volume expanded. SEM analysis results indicated that the cellulose that has been sonicated contained a surface that is rougher than the one without sonication, as depicted in Fig. 3(c)–(e). The acoustic cavitation of high-frequency (20–25 kHz) ultrasound caused the formation, expansion, and implosion of microbubbles in aqueous solutions. The violent bubbles that collapse induced microjets and shock waves on the surfaces of the cellulose fibers, causing strong erosion of the surface of the fibers to split along the axial direction.33Fig. 3(d) and (e) have proven that the cellulose solids have degraded (become fibrous) from the surface to the inside of the material. This form will show that the formation of saccharide pieces during sonication has occurred.34 After the sonication process, the liquid portion was analyzed using the DNS method for the reducing sugar content; however, no reducing sugar was formed. The fibers of the solid cellulose will facilitate the glycosidic reaction process between the cellulose chains or oligomers formed with hydrogen radicals to become reducing sugars. This will change the degree of crystallinity of cellulose. Further processing (by hydrothermal) will facilitate the degradation reaction to produce oligomers and other monomers (reducing sugars).35
3.1 Hydrothermal processing
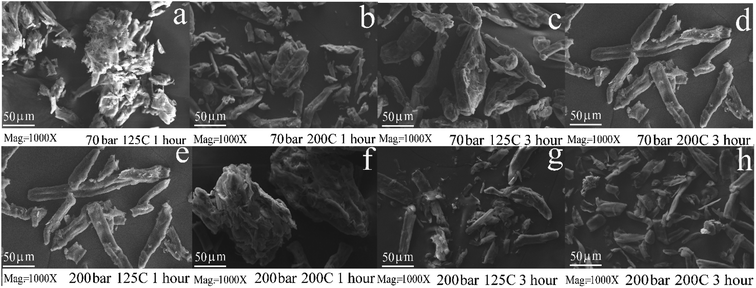
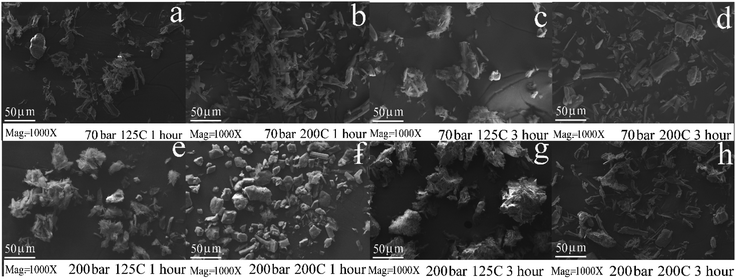
In this work, samples are first processed in a hydrothermal reactor without sonication. The hydrothermal process is carried out under two different operating conditions: at temperatures of 125 °C under pressurization with CO2 at 70 and 200 bar and at 200 °C under the same pressurization conditions. Each condition was conducted for various degradation times. After the processing time is over, the reactor was cooled immediately followed by decompression to the atmospheric condition. The sample was removed, and the solid and liquid parts were separated. The liquid part was investigated for reducing sugars, while the solid part was analyzed by SEM and for comparison between the original cellulose sample (Fig. 3(c)) and the hydrothermally processed ones, as shown in Fig. 4. Fig. 4(a) and (b) show the sample micrographs processed at 70 bar, for 1 hour, at processing temperatures 125 °C and 200 °C, respectively. Fig. 4(c) and (d) show the samples processed at 70 bar, for 3 hours, at the same processing temperatures. For processing pressures at 200 bar, with other processing variables remaining the same, the results of SEM investigations are shown in Fig. 4(e)–(h). The higher the temperature and pressure, and the longer the processing time, the rougher and smaller the surface structure of the cellulose becomes. The changes in the solid surface and size mean that there is a loss of some parts of the surface layer (peeling and erosion) of the cellulose solids when dissolved into the solution.34 Because peeling occurs throughout the particle, the particle size becomes smaller or shrank. When the particle surface erosion is more severe and when processed at higher pressures and temperatures and longer processing times, the size becomes smaller. The micrograph in Fig. 4 shows all the phenomena that the treatment process has an impact on the residual characteristics of solid cellulose.The increase in the processing pressure and temperature leads to an increase in the reactivity of water, since the amount of ionized hydrogen is increased.16 The pressurization with CO2 causes an increase in acidity by increasing the amount of hydrogen ions for hydrolysis,18 which resulted from the dissociation of the carbonic acid formed. Moreover, H2C2O4 contributes hydrogen ions and also facilitates glycosidic reactions.20 It is clear that the surface depletion is caused by the hydrothermal conditions rich in hydrogen ions from a variety of sources (from IMS). Moreover, high-pressure conditions cause swelling of the surface of cellulose. The strong penetration of the solution to the bulk cellulose resulted in glycosidic reaction processes, and the process of breaking the intra- and intermolecular hydrogen bonds in the middle of and between polymer chains becomes more effective. An increase in the temperature decreases the dielectric constant values and the density of water. An increase in temperature decreases the dielectric constant values and the density of water.16,36 The presence of NaCl helps weaken the bond between the polymer chain and destroys the inter-/intramolecular hydrogen bond of the cellulose molecules.20,37 Micrographs showed that the longer the reaction time and the higher the temperature and the pressure, the smaller the particle size becomes, as shown in Fig. 4. The difference in particle shape between the original cellulose sample and that after the hydrothermal process can be clearly distinguished. Processing phenomena and the mechanism of kinetic changes in the size of solid cellulose particles might be an alternative to the nanocrystalline cellulose formation.38
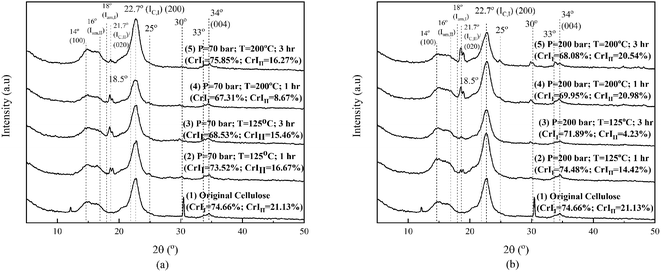
Fig. 5 shows the XRD analysis results of the original cellulose sample and that after the hydrothermal process. We need to explore the effect of changing operating conditions (temperature and pressure) and interactions with various ions on crystallinity. In this study, the crystallinity of cellulose and its changes were calculated based on Segal's method, as is widely applied in cellulose research.6 Fig. 5 shows the XRD patterns of the original cellulose sample and the processed ones. Original cellulose (cellulose I) has diffraction peaks at 14.7°, 16.3°, 20.8°, 22.5°, and 34.6°.39
Fig. 5 shows that two peaks exist in the original cellulose sample (namely, at 12.2° and 30.4°) and then disappeared after the hydrothermal process under operating conditions, as depicted in the figures. On further processing (1 hour), the two peaks disappeared, and then, there were changes in the crystallinity of cellulose I and II under all operating conditions. Internal restructuration might have occurred, showing that the crystallinity of the two types of cellulose was changed. The crystallinity of cellulose I and II for the samples processed at 70 bar and 125 °C for 1 hour decreased and continued to decrease for a longer time of 3 hours. Processing at a higher temperature of 200 °C for an hour decreased the crystallinity of cellulose II, but processing for 3 hours increased the crystallinity of cellulose I to be even higher than the original cellulose sample. At high temperatures (processing time, 3 hours), the effect on crystallinity is opposite to processing at low temperatures. The swelling due to the high temperature allows restructuring due to the movement of the chain becoming more regular (the crystallinity of cellulose I is higher than that of the original cellulose sample and cellulose II which is higher than that obtained in the 1 hour process and others). This means that the crystal restructuring at 70 bar pressure is significant for high temperatures and their impact on reducing sugar products (Fig. 6). Any change in the crystallinity can imply that amorphous degradation occurred and/or the cellulose chains draw closer to form new crystals. Crystal movement can occur due to the diffusion of solvent molecules/diluents into the particle at a certain temperature and pressure. The decrease in crystallinity of cellulose II from its original value is due to the low temperature under these operating conditions, and the lack of diffused solvent media (ions) entering the crystal body renders the chain of cellulose I and II unable to change/move to be more organized, even a decline due to degradation,40 as shown in Fig. 5(a).
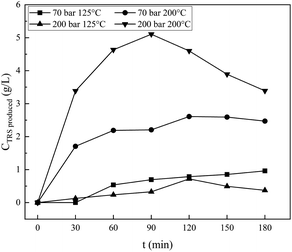 | ||
| Fig. 6 Effect of operating conditions on reducing sugar for various reaction times, and CO2 as a pressurization gas. | ||
Processing at 200 bar causes the crystallinity of cellulose I to decrease at temperatures of 125 °C and 200 °C, for both 1 and 3 hours, respectively. For the samples processed at 125 °C, the crystallinity of cellulose II decreased, but at 200 °C, it just dropped a little for both processing times of 1 and 3 hours. High pressure and temperature facilitate the penetration of some ions into the crystalline structures, which causes swelling. Parts of the cellulose chain (mostly amorphous chains) might be degraded (explained further in Fig. 6) first assisted by H+ (from the dissociation of water,16 carbonic acid formed,41 and carboxylic acid20) and NaCl.20 Carbonic acid was formed by high solubility of CO2 in water (solution).42,43 The NaCl weakens the hydrogen interaction of intra- and intermolecular chains. It will affect the mobility of chains that interact with all the ions, rearranging and then changing the crystallinity of cellulose I and II. This phenomenon is similar in other systems, as reported by Nanta et al.44 The results differ with cellulose processed solely under water. The change in the crystallographic pattern shows the existence ionic penetration and changes the crystallinity of both cellulose I and II.
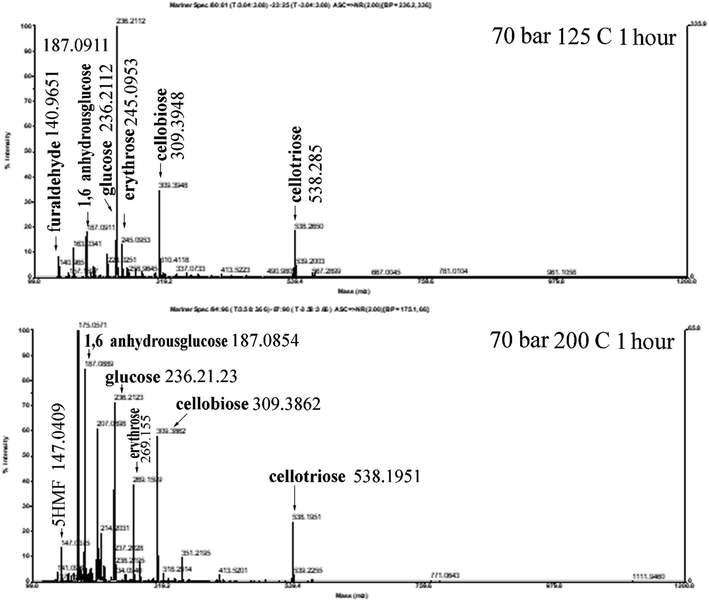
The effect of the operating conditions on the resulting reducing sugars is analysed by the DNS method.27,28 The standard solution of reducing sugars used is glucose. Fig. 6 shows the result of DNS analysis for various degradation times, for samples processed at 70 bar, and 125 °C and 200 °C, respectively, and for samples processed at 200 bar, and 125 °C and 200 °C, respectively. For processing at 70 bar and 125 °C, the reducing sugar concentration increases continuously with the increase in time for the hydrothermal process, up to the longest processing time of 180 minutes. Processing at 200 °C produces reducing sugars, the concentration of which increases with the increase in time (almost three times compared with 125 °C processing) of the hydrothermal process and reaches a maximum value of 2.6 g L−1 at 120 minutes. Processing the material under hydrothermal conditions at higher temperatures results in higher concentrations of reducing sugars because the higher the temperature, the greater the glycosidic reaction. The results of the analysis with DNS at 70 bar and 125 °C and 200 °C are compared, as shown in Fig. 7. The reducing sugar formed is represented by the components of glucose, cellobiose, and erythrose; the intensity of each of these components shown in Fig. 7(b) is higher than that shown in (a). This is because the higher the water ion product, the lower the dielectric constant. This is in agreement with the paper presented by Kruse et al.16 Moreover, the availability of ions (ionic mixture solution, IMS) that penetrated into the inner particles (as diluent) leads to particle swelling and causes chain mobility, as well as exfoliation of saccharides (in the surface) for the degradation in solution media to become reducing sugars.
Hydrothermal processing of cellulose at 200 bar at temperatures of 125 °C and 200 °C, respectively, results in different phenomena than that resulting from processing at 70 bar at the same temperatures. Processing at 200 bar at a temperature of 200 °C produces reducing sugars whose concentration is higher than that produced at a pressure of 200 bar and a temperature of 125 °C. Higher temperatures facilitated the degradation process of cellulose, and the time required would be even shorter. In this work, higher temperatures and pressures achieved a maximum concentration of 5.1 g L−1 at 90 minutes. It is shown in Fig. 6 that processing at a temperature of 200 °C at both pressures of 70 and 200 bar, respectively, produces reducing sugars whose concentration is significantly higher than that produces at 125 °C, while processing at 200 bar and 125 °C produces reducing sugars whose concentration is slightly lower than that produced by processing at 70 bar and 125 °C. The high pressure should increase the penetration power of ions (from IMS) against the cellulose surface and facilitate the release of cellulose so that easier to be degraded into the reducing sugar, but this effect is insignificant at low temperature.
The work conducted at 70 bar at temperatures of 125 °C and 200 °C is slightly below the critical condition of CO2, while it is in the area of supercritical state of CO2 when conducted with a pressure of 200 bar at 125 °C and 200 °C. The two pairs of operating conditions differ in the solubility of CO2 in water,43 and the concentration of the carbonic acid formed differs. It will affect the physical and chemical properties of the mixture under pressurization by CO2. At 70 bar, the solubility of CO2 in water at 125 °C is far higher than at 200 °C. Conversely, the solubility of CO2 in water at 200 bar and at temperatures of 125 °C and 200 °C shows a solubility that is similar and is higher (two fold) than at 70 bar and 125 °C. The production of reducing sugars by a process at a pressure of 70 bar and a temperature of 125 °C is higher than that by a process at 200 bar and at 125 °C, as shown in Fig. 6. It is seen that reducing sugar production at low temperatures (125 °C) is insignificantly affected by the high degree of acidity in the solution. Dissolved CO2 acts as a catalyst38 together with H2C2O4, and NaCl increases its degradation power at high temperatures.18 It is shown in Fig. 5(a) that processing at 70 bar and 200 °C for 1 hour causes a bigger crystallinity change than processing at 125 °C for 1 hour. There are some amorphous cellulose chains, and both cellulose I and II might be degraded since the value is decreased. The reducing sugar formed is under both higher operating conditions at higher temperatures, as shown in Fig. 6 and 7.
3.2 Combination of sonication and hydrothermal processes
In this part of the study, all samples were first processed by sonication (the processing effects are shown in Fig. 3(b) and (d) as explained briefly above) and then by a hydrothermal process. The hydrothermal operating conditions and product characterization applied are similar to those mentioned in the previous section. Fig. 3(d) shows the result of SEM analysis and shows the surface structure of cellulose after the initial treatment by sonication. It is shown that the surface sample becomes more damaged (fibrous) than the original one (Fig. 3(d)). It is caused by the microjet attack and the chemical effects originating from water degradation/dissociation along the sonication process. Moreover, the presence of H2C2O4 and NaCl salt ions causes many exfoliated and released polysaccharide flakes. This situation will facilitate the process of forming reducing sugars due to the degradation of polysaccharide flakes. Based on these initial conditions, this slurry mixture sample will be easier for the degradation process in a hydrothermal reactor. The initial sonication treatment has caused the phenomenon of degradation in this section to be very different from hydrothermal processing alone as mentioned in the above section.Fig. 8 shows the SEM images of the samples processed by the combined sonication and hydrothermal processes. The original cellulose/pure cellulose sample is depicted in Fig. 3(d). The sample images processed at 70 bar at temperatures 125 °C and 200 °C for 1 hour, respectively, are shown in Fig. 8(a) and (b). Fig. 8(c) and (d) show the sample images for the processing time of 3 hours at temperatures 125 °C and 200 °C, respectively. It appeared in Fig. 3(d) that the surface structure of the cellulose becomes more damaged and destroyed if preliminary sonication treatment was given. Processing at 70 bar at 125 °C for 1 hour caused the sample to lose surface fibers due to sonication pretreatment. During that 1 hour, the entire fibrous surface disappears due to media reaction (Fig. 8(a)). When the operating temperature is 200 °C, the surface of the sample becomes smoother because of surface reactions, and the particles becomes smaller (Fig. 8(b)) than the original material, as shown in Fig. 3(c). When the duration of the process is extended to 3 hours at 125 °C, the surface becomes rougher and swollen, meaning that, after the surface of the fiber has finished reacting, there is the penetration of ions (IMS) into the particles (Fig. 8(c)). When the operating temperature is 200 °C, the fibrous surface reaction is faster, which is followed by a normal surface reaction and then a fast one, without penetration, so the particles are smooth (Fig. 8(d)). Processing at 200 bar at 125 °C for 1 hour produces products with a fibrous surface. At a pressure of 200 bar, the surface fibers decrease, but swelling occurs. The reaction occurs throughout the fiber but also penetrates into its core particles (Fig. 8(e)). When the operating temperature is 200 °C, the surface of the sample becomes smoother because the part of the fiber has completely reacted causing swelling of the particles (Fig. 8(f)). When the duration of the process is extended to 3 hours at 125 °C, the surface becomes rougher and swollen, meaning that, after the fiber surface has finished reacting, there is ion penetration (IMS) into the particle (Fig. 8(g)). When the operating temperature is 200 °C, the fibrous surface reaction is faster, followed by a normal and fast surface reaction and less penetration, and hence, the particles are smooth (Fig. 8(h)). In this work, the fibrous part might accelerate the process of penetration and peeling of saccharides, which eventually turn into reducing sugars. However, it carries a great risk for the next rapid reaction, which is the subsequent reaction of reducing sugars to degradation products such as HMF.
Trache et al.38 explained that the presence of NaCl ions in water can reduce gas solubility, increase the viscosity of the solution, and reduce the coalescence of bubbles. This system is able to produce bubbles with small diameters and large quantities per volume. The number of bubbles generated becomes more and produces a microjet attack to the cellulose particles more intensive. The sonication system has the ability to attack the surface of the solid material for degradation of solid structures. Merouani et al.24 reported that different ultrasonic frequencies produce bubbles with varying diameters, temperatures, and pressures. Based on this potential, sonication was able to turn the cellulose shape into smaller flakes and produce some fibril, as shown in Fig. 3(d). Some of them were converted into polysaccharides and oligosaccharides, and then become monomers. Sonication might have participated in cellulose structure breaking. This reinforces the problem stated by Wong et al., which proves that sonication is able to modify the structure of cellulose.45
The samples processed by sonication pretreatment, followed by hydrothermal process, at 200 bar for 1 hour at processing temperatures of 125 °C and 200 °C, respectively, are shown in Fig. 8(e) and (f). The samples processed for 3 hours at processing temperatures of 125 °C and 200 °C, respectively, are shown in Fig. 8(g) and (h). The increase in pressurization with CO2 increases the system acidity,41 which also leads to strong penetration of the ionic component of the ionic solution to the bulk materials. The IMS (of NaCl, H2C2O4, carbonic acid, and dissociated water) at high pressures and temperatures swells the particles and breaks or weakens the hydrogen bonds in the intra- and intercellular chains. From Fig. 4, it can be observed that hydrothermal processing alone produces larger and more intact cellulose particles. However, in Fig. 8, the particles even become destroyed. These changes will affect the internal structure of cellulose, as indicated by changes in the crystallinity of the material. Providing sonication energy followed by the hydrothermal process made the degradation effect on polysaccharide cellulose more effective.
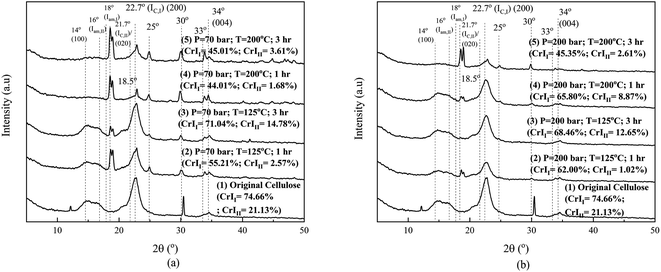
Fig. 9 is the crystallinity change of cellulose after the hydrothermal process with sonication pretreatment. As in Fig. 5, we compared the original cellulose sample with those that had been hydrothermally processed without sonication pretreatment. Sonication as explained in Fig. 3 did not shattered the particles to become fibrous only but changed the crystalline structure.46 Two peaks exist in the original cellulose sample (namely, at 12.2° and 30.4°), which then disappeared after for 1 hour of sonication. Since the fibrous product resulted, as depicted in Fig. 3(b) and the SEM in (d), further processing under hydrothermal process changed the crystallinity of cellulose I and cellulose II under all operating conditions. When compared to the original cellulose sample, the peak change in the XRD pattern varies at pressures of 70 and 200 bar as a result of swelling by temperature or the presence of components in the media that enter the cellulose fibrous and/or particle. The crystallinity change might be caused by the following reasons: (i) cellulose I is transformed into cellulose II, (ii) part of both cellulose types released/uprooted into the solvent media at high pressure and then partially decomposed, and (iii) amorphous portion decomposes into oligomers and/or monomers after uprooting into solvent media. These three possibilities can occur due to the swelling of cellulose polymer under penetration by the presence of shared components racing to enter the bulk and fibrous cellulose. The combination of sonication and hydrothermal processes causes drastic changes in the crystalline structure, as shown in Fig. 9, in particular at a higher pressure of 200 bar (Fig. 8(b)). The change in crystallinity might be followed by the change in the structural composition of cellulose type inside the particle.
At a pressure of 70 bar and a temperature of 125 °C for 1 hour processing, the crystallinity of cellulose I and II dropped dramatically, and after 3 hours, it rose again. After 3 hours, the destruction of the amorphous part increases the movement of the cellulose chain toward the crystal order, making the crystallinity of cellulose I and II higher than the 1 hour one. However, when the temperature is 200 °C, processing for 1 and 3 hours causes the crystallinity to decrease dramatically on cellulose I (almost half of the original) and II (about 15% of the original). Overall, the short diffusion distance of the mixture of solution ions due to the shape of the fibers of cellulose particle surface after the sonication process is able to change the crystalline structure of cellulose especially at high temperatures of 200 °C. At a pressure of 200 bar and a temperature of 125 °C, for 1 hour processing, the crystallinity of cellulose I decreased slightly, while that of cellulose II dropped dramatically. After 3 hours, the event is equal to 70 bar pressure; the destruction of the amorphous part increases the movement of the cellulose chain toward the crystal order, so that the crystallinity of cellulose I and II is higher than that after 1 hour. However, when the temperature is 200 °C, processing for 1 and 3 hours causes the crystallinity to decrease dramatically for cellulose I and II. High pressure helps the penetration of ions as diluents and facilitates the movement of cellulose chains, so that the crystallinity of cellulose is relatively stable. At a temperature of 200 °C, the glycosidic bond cutting reaction is so large that the crystallinity decreases, leading to an increase in the reducing sugar production rate.
In Fig. 10, two lower curves are processing at pressures of 70 and 200 bar and both are carried out at 125 °C. Processing at a pressure of 200 bar produces reducing sugars in slightly higher concentrations than that at 70 bar and has a maximum value of 120 minutes. While under the same operating conditions, processing with hydrothermal process alone produces a closer reducing sugar, but the pressure of 70 bar is slightly higher than at 200 bar when the time is more than 30 minutes (Fig. 5). The ionic strength of shared materials in the penetration process will be stronger at a higher pressure but insignificant at low temperatures. Therefore, below the water critical point, the effect of temperature on water as the reactant might affect the reducing sugar products, which is greater than the pressure effects, as reported in Kruse et al.16 This result is due to the fibrous state of the sample after sonication causing the penetration of diffuse ions to enter and interact with the cellulose chain, which is greater, and a high-rate glycosidic reaction occurs.
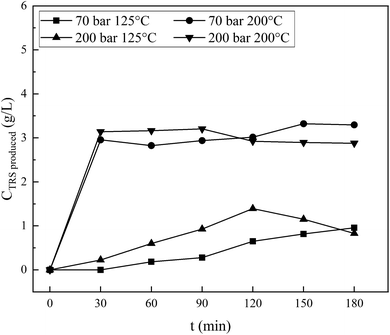 | ||
| Fig. 10 Total reducing sugars produced from sonication, followed by the hydrothermal process of cellulose in a NaCl and H2C2O4 mixture solution. | ||
An interesting phenomenon is shown by the processing results at 200 °C. By processing at 200 bar, the reducing sugar concentration is initially slightly higher than that at a pressure of 70 bar. The concentration achieves a maximum of 3.21 g L−1 at 90 minutes, while the process at 70 bar shows an increase in concentration and reaches a maximum of 3.3 g L−1 at 150 minutes. This result is higher than that under the same operating condition in the hydrothermal-only process (a maximum of 2.6 g L−1 at 120 minutes, as appears in Fig. 5). Overall, it is clear that the concentration of reducing sugars produced by the combined sonication and hydrothermal process (Fig. 10) is greater and the production is faster since the initial stages. There is a competition between the processes of forming reducing sugars and further degradation. Since the time reached 30 minutes, both curves coincide with each other. As the process continues, the results indicate that the two curves are relatively flat until 90 minutes and then decreases after that for 200 bar pressure and increases for 70 bar, indicating that further degradation of reducing sugars is faster than the formation for processing at 200 bar and vice versa at 70 bar. The results of the two types of processes are different due to the sonication pretreatment on the material before hydrothermal treatment as explained above.
4. Conclusions
Cellulose degradation by the hydrothermal method can produce reducing sugars. Sonication pretreatment changes the phenomenon of degradation, which occurs faster, further increasing the degradation rate. The pressurization of the H2C2O4–NaCl solution with CO2 has produced a solvent with a high solvent power capable of penetrating, swelling, and changing the cellulose chain interaction, resulting in the reducing sugar production. The presence of internal structural changes was explained by crystallinity, and crystalline type and composition change were explored by XRD analysis data. The competition in reducing sugar formation and further degradation has strictly occurred, and it should be controlled to get the desired product composition. The combination of sonication and hydrothermal processes (at high temperatures) has a greater risk of further degradation than the hydrothermal process alone.Conflicts of interest
There are no conflicts to declare.Acknowledgements
The authors are thankful for the financial support of The Ministry of Research, Technology and Higher Education (RISTEKDIKTI) through Penelitian Strategis Nasional 2016.Notes and references
- C. H. Zhou, X. Xia, C. X. Lin, D. S. Tong and J. Beltramini, Chem. Soc. Rev., 2011, 40, 5588–5617 RSC.
- L. R. Lynd, J. H. Cushman, R. J. Nichols and C. E. Wyman, Science, 1991, 251, 1318–1323 CrossRef CAS.
- A. A. Peterson, F. Vogel, R. P. Lachance, M. Fröling, M. J. Antal and J. W. Tester, Energy Environ. Sci., 2008, 1, 32–65 RSC.
- S. R. Collinsona and W. Thielemans, Coord. Chem. Rev., 2010, 254(15–16), 1854–1870 CrossRef.
- Y. Yu and H. Wu, Ind. Eng. Chem. Res., 2010, 49, 3902–3909 CrossRef CAS.
- L. Segal, M. L. Nelson and C. M. Conrad, Text. Res. J., 1953, 23, 428–435 CrossRef CAS.
- S. Zhang, F. X. Li, J. yong Yu and Y. Lo Hsieh, Carbohydr. Polym., 2010, 81, 668–674 CrossRef CAS.
- N. B. Shelke, R. James, C. T. Laurencin and S. G. Kumbar, Polym. Adv. Technol., 2014, 25, 448–460 CrossRef CAS.
- E. Savitri, S. Sumarno and A. Rosyadi, Macromol. Symp., 2015, 353, 212–219 CrossRef CAS.
- J. H. Lin, Y. H. Chang and Y. H. Hsu, Food Hydrocolloids, 2009, 23, 1548–1553 CrossRef CAS.
- M. Imai, K. Ikari and I. Suzuki, Biochem. Eng. J., 2004, 17, 79–83 CrossRef CAS.
- M. Khodaverdi, K. Karimi, A. Jeihanipour and M. J. Taherzadeh, J. Ind. Microbiol. Biotechnol., 2012, 39, 429–438 CrossRef CAS.
- S. Morales-delaRosa, J. M. Campos-Martin and J. L. G. Fierro, Chem. Eng. J., 2012, 181–182, 538–541 CrossRef CAS.
- M. Sasaki, B. Kabyemela, R. Malaluan, S. Hirose, N. Takeda, T. Adschiri and K. Arai, J. Supercrit. Fluids, 1998, 13, 261–268 CrossRef CAS.
- M. Sasaki, Z. Fang, Y. Fukushima, T. Adschiri and K. Arai, Ind. Eng. Chem. Res., 2000, 39, 2883–2890 CrossRef CAS.
- A. Kruse and E. Dinjus, J. Supercrit. Fluids, 2007, 39, 362–380 CrossRef CAS.
- A. Sina, T. Yumak, V. Balci and A. Kruse, J. Supercrit. Fluids, 2011, 56, 179–185 CrossRef.
- T. Rogalinski, K. Liu, T. Albrecht and G. Brunner, J. Supercrit. Fluids, 2008, 46, 335–341 CrossRef CAS.
- D. V. Pinjari and A. B. Pandit, Ultrason. Sonochem., 2010, 17, 845–852 CrossRef CAS.
- T. Stein, P. Grande, F. Sibilla, U. Commandeur, R. Fischer, W. Leitner, P. Dom and D. Mar, Green Chem., 2010, 12, 1844–1849 RSC.
- F. F. Adam, R. A. Istiqomah, M. A. Budianto, P. N. Trisanti and S. Sumarno, Polym.-Plast. Technol. Mater., 2020, 1–7 Search PubMed.
- B. Airlangga, D. Erlangga, L. K. M. Solikhah, F. Puspasari, I. Gunardi, P. N. Trisanti and S. Sumarno, AIP Conf. Proc., 2018, 2085, 1–8 Search PubMed.
- S. Alizadeh, N. Fallah and M. Nikazar, RSC Adv., 2019, 9, 4314–4324 RSC.
- S. Merouani, O. Hamdaoui, Y. Rezgui and M. Guemini, Ultrason. Sonochem., 2014, 21, 53–59 CrossRef CAS.
- S. Merouani, O. Hamdaoui, Z. Boutamine, Y. Rezgui and M. Guemini, Ultrason. Sonochem., 2016, 28, 382–392 CrossRef CAS.
- E. Savitri, S. R. Juliastuti, A. Handaratri, S. Sumarno and A. Roesyadi, Polym. Degrad. Stab., 2014, 110, 344–352 CrossRef CAS.
- G. L. Miller, Anal. Chem., 1959, 31, 426–428 CrossRef CAS.
- Y. Wu, Z. Fu, D. Yin, Q. Xu, F. Liu, C. Lu and L. Mao, Green Chem., 2010, 12, 696–700 RSC.
- B. Airlangga, F. Puspasari, P. N. Trisanti, J. Juwari and S. Sumarno, Starch, 2020, 72, 1–8 Search PubMed.
- P. N. Trisant, I. Gunardi and S. Sumarno, Macromol. Symp., 2020, 391, 1–5 CrossRef.
- S. Park, J. O. Baker, M. E. Himmel, P. A. Parilla and D. K. Johnson, Biotechnol. Biofuels, 2010, 3, 1–10 CrossRef.
- B. Airlangga, A. M. Sugianto, G. Parahita, F. Puspasari, N. E. Mayangsari, P. N. Trisanti, J. P. Sutikno and S. Sumarno, J. Sci. Food Agric., 2020 DOI:10.1002/jsfa.10864.
- W. Chen, H. Yua, Y. Liua, P. Chen, M. Zhang and H. Yunfei, Carbohydr. Polym., 2011, 83, 1804–1811 CrossRef CAS.
- M. Sasaki, T. Adschiri and K. Arai, AIChE J., 2004, 50, 192–202 CrossRef CAS.
- T. Minowa, F. Zhen and T. Ogi, J. Supercrit. Fluids, 1998, 13, 253–259 CrossRef CAS.
- T. Gagić, A. Perva-Uzunalić, Ž. Knez and M. Škerget, Ind. Eng. Chem. Res., 2018, 57, 6576–6584 CrossRef.
- L. Feng and Z. Chen, J. Mol. Liq., 2008, 142, 1–5 CrossRef.
- D. Trache, M. H. Hussin and V. K. Thakur, Nanoscale, 2017, 17–25 Search PubMed.
- L. P. De Figueiredo and F. F. Ferreira, J. Pharm. Sci., 2014, 103, 1394–1399 CrossRef.
- M. Ghasemi, P. Alexandridis and M. Tsianou, Cellulose, 2017, 24, 571–590 CrossRef CAS.
- X. Wang, Y. Guo, J. Zhou and G. Sun, RSC Adv., 2017, 7, 8314–8322 RSC.
- L. W. Diamond and N. N. Akinfiev, Fluid Phase Equilib., 2003, 208, 265–290 CrossRef CAS.
- W. S. Dodds, L. F. Stutzman and B. J. Sollami, Ind. Eng. Chem., Chem. Eng. Data Ser., 1956, 1, 92–95 CrossRef CAS.
- P. Nanta, W. Skolpap, K. Kasemwong and Y. Shimoyama, J. Supercrit. Fluids, 2017, 130, 84–90 CrossRef CAS.
- S. S. Wong, S. Kasapis and Y. M. Tan, Carbohydr. Polym., 2009, 77, 280–287 CrossRef CAS.
- S. Sumari, A. Roesyadi and S. Sumarno, Sci. Study Res.: Chem. Chem. Eng., Biotechnol., Food Ind., 2013, 14, 229–239 Search PubMed.
| This journal is © The Royal Society of Chemistry 2021 |

