DOI:
10.1039/D0RA07595G
(Paper)
RSC Adv., 2021,
11, 2462-2475
Chromeno-carbonitriles as corrosion inhibitors for mild steel in acidic solution: electrochemical, surface and computational studies†
Received
4th September 2020
, Accepted 1st December 2020
First published on 11th January 2021
Abstract
Three novel N-hydrospiro-chromeno-carbonitriles namely, 2-amino-7,7-dimethyl-1′,3′,5-trioxo-1′,3′,5,6,7,8-hexahydrospiro[chromene-4,2′-indene]-3-carbonitrile (INH-1), 3-amino-7,7-dimethyl-2′,5-dioxo-5,6,7,8-tetrahydrospiro[chromene-4,3′-indoline]-2-carbonitrile (INH-2) and 3′-amino-7′,7′-dimethyl-2,5′-dioxo-5′,6′,7′,8′-tetrahydro-2H-spiro[acenaphthylene-1,4′-chromene]-2′-carbonitrile (INH-3) were synthesized using the principles of green chemistry and applied as corrosion inhibitors for mild steel in acidic medium using computational simulations and experimental methods. Experimental and computational studies revealed that inhibition effectiveness of the INHs followed the sequence: INH-3 (95.32%) > INH-2 (93.02%) > INH-1 (89.16%). The investigated compounds exhibit mixed-type corrosion inhibition characteristics by blocking the active sites on the surface of mild steel. EIS study revealed that the INHs behave as interface-type corrosion inhibitors. EDX analyses supported the adsorption mechanism of corrosion inhibition. A DFT study carried out for gaseous and aqueous forms of inhibitor molecules indicated that interactions of INHs with the mild steel surface involve charge transfer phenomenon or donor–acceptor interactions. A Monte Carlo (MC) simulation study revealed that only a fractional segment of the molecule lies parallel to the steel surface, since the INH molecules are not completely planar. The results of computational studies and experimental analyses were in good agreement.
1. Introduction
The demand and consumption of metallic materials (pure metals and alloys) are increasing day-by-day because of increasing industrialization. However, most of the metallic materials are highly reactive and rapidly undergo corrosive degradation via electrochemical or chemical reactions with environmental constituents.1–3 Corrosion science and engineering has paid particular attention to metallic corrosion in recent times because it emerges as one of the most damaging and challenging phenomena, especially in petroleum industries. Corrosion also results in enormous losses in the form of metal degradation during several industrial cleaning processes such as oil-well acidification, acid pickling, descaling and cleaning processes.4–6 According to a report by the National Association of Corrosion Engineers (NACE), several emerging and developed countries are adversely affected by corrosion where it results in losses of around 5% of the total Gross National Product (GNP) of each nation.7,8 However, with proper understanding and implementation of accessible corrosion preventive methods, the cost of corrosion can be greatly minimized.
Nonetheless, because of the increasing requirement of metallic resources in the fields of science, engineering and technology, coupled with the resultant effects of corrosion of these metallic materials, the cost of corrosion is expected to increase. In view of the above, several methods of corrosion protection are developed and implemented, among which the use of synthetic corrosion inhibitors occupies the topmost position because of its cost-effectiveness, ease of synthesis and application.9–11 Organic inhibitors contain numerous polar functional groups such as –OH, –NH2, –NMe2, –OMe, –CN, –NO2, –COOH and –COOC2H5, through which they can easily get adsorbed on the metal surface.12–14 More so, application of organic corrosion inhibitors in aqueous media might be challenging because of their limited solubility. However, the presence of polar substituents also enhances the solubility of corrosion inhibitors in such electrolytes.15,16 Literature survey shows that organic compounds containing polar functional groups and extensive conjugation in the form of multiple bonds, aromatic ring and side chain often offer effective corrosion inhibition potentials.17,18
We herein report the synthesis, characterization and inhibition effects of three N-hydrospiro-chromeno-carbonitriles, namely, 2-amino-7,7-dimethyl-1′,3′,5-trioxo-1′,3′,5,6,7,8-hexahydrospiro[chromene-4,2′-indene]-3-carbonitrile (INH-1), 3-amino-7,7-dimethyl-2′,5-dioxo-5,6,7,8-tetrahydrospiro[chromene-4,3′-indoline]-2-carbonitrile (INH-2) and 3′-amino-7′,7′-dimethyl-2,5′-dioxo-5′,6′,7′,8′-tetrahydro-2H-spiro[acenaphthylene-1,4′-chromene]-2′-carbonitrile (INH-3) that differ in the nature of functional group and aromatic rings, on mild steel corrosion in 1 M HCl using experimental and computational analyses. All the INHs were synthesized using one-pot multicomponent reactions (MCRs), which are identified with several advantageous features including ease of operation, high synthetic yield and fewer purification steps.19–21 Aspects of green chemistry which is connected with the adopted method of synthesizing the INHs in the present study is the utilization of water as the reaction medium. Utilization of water as the reaction medium is always considered as one of the greenest protocols for synthesis, as it is associated with several beneficial properties such as high dielectric constant, high specific heat, high redox potential, non-toxic, bio-tolerable, inexpensive behaviour and huge availability.22–24 This study is also designed to demonstrate the relative inhibition effects of 1,2-diketone (–CO–CO–) and amide (–NH–CO–) functional groups. Relative effects of number of aromatic rings on the corrosion inhibition effect of INHs on mild steel corrosion in 1 M HCl is also demonstrated in the present study. The study was conducted using open circuit potential (OCP), electrochemical impedance spectroscopy (EIS), potentiodynamic polarization (PDP), linear polarization resistance (LPR), Bode phase angle plots, energy dispersive X-ray spectroscopy (EDX), density functional theory (DFT) and Monte Carlo (MC) simulation methods.
2. Materials and methods
2.1 Typical procedure for the synthesis of INH-1–3
Equimolar amount of carbonyl compound (1 mmol), malononitrile (1 mmol) and dimedone (1 mmol) were added to a round bottom flask charged with 5 mL of water and 10 mol% NaCl. The reaction mixture was stirred and heated at 50 °C for 20–30 minutes. After completion of reaction, the solid product obtained was filtered and washed with water, dried and recrystallized from ethanol to give pure products. Synthetic scheme of the investigated inhibitor molecules are presented in Fig. 1. Characterization data of the studied inhibitors are presented in Table 1.
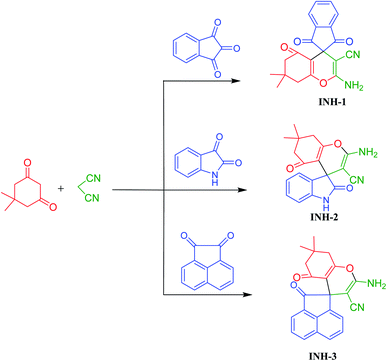 |
| | Fig. 1 Scheme for INH-1, INH-2 and INH-3 synthesis. | |
Table 1 Chemical structures, IUPAC names, abbreviations and characterization data of the investigated INH molecules
| S. no. |
Name & abbreviation |
Chemical structure |
Characterization data |
| 1 |
2-Amino-7,7-dimethyl-1′,3′,5-trioxo-1′,3′,5,6,7,8-hexahydro-spiro[chromene-4,2′-indene]-3-carbonitrile (INH-1) |
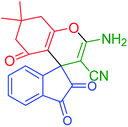 |
Brown solid; MP = 297–298 °C; yield = 92%; IR (KBr) (v cm−1): 3392, 3,053, 2,917, 2,196, 1,710, 1665;1H NMR (500 MHz, DMSO-d6) δ 8.02 (d, J = 11.6 Hz, 4H, ArH), 7.64 (s, 2H, NH2), 2.62 (s, 2H, CH2), 2.20 (s, 2H, CH2), 1.04 (s, 6H, CH3); 13C NMR (126 MHz, DMSO-d6) δ 199.71, 196.02, 166.46, 159.86, 140.54, 136.60, 123.14, 116.80, 109.98, 53.10, 51.78, 48.92, 32.43, 27.17 |
| 2 |
3-Amino-7,7-dimethyl-2′,5-dioxo-5,6,7,8-tetrahydrospiro[chromene-4,3′-indoline]-2-carbonitrile (INH-2) |
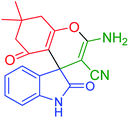 |
Yellow solid; MP 291–292 °C; yield = 92%; IR (KBr) v (cm−1): 3319, 3309, 3122, 2962, 2197, 1720, 1680; 1H NMR (500 MHz, DMSO-d6) δ 10.38 (s, 1H, NH), 7.21 (s, 2H, NH2), 6.98–6.78 (m, 4H, ArH), 2.64–2.53 (m, 2H), 2.13 (q, 2H, CH2), 1.02 (s, 3H, CH3), 1.00 (s, 3H, CH3); 13C NMR (126 MHz, DMSO-d6) δ 194.84, 177.99, 164.11, 158.75, 142.04, 134.39, 128.14, 122.99, 121.65, 117.30, 110.77, 109.21, 57.49, 49.98, 46.79, 31.91, 27.57, 27.00; |
| 3 |
3′-Amino-7′,7′-dimethyl-2,5′-dioxo-5′,6′,7′,8′-tetrahydro-2H-spiro[acenaphthylene-1,4′-chromene]-2′-carbonitrile (INH-3) |
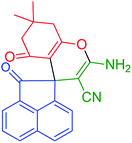 |
Pink solid; MP = 268–269 °C; yield = 89%; IR (KBr) v (cm−1): 3312, 3305, 2187, 1721, 1680, 1650; 1H NMR (500 MHz, DMSO-d6) δ 8.15–7.58 (m, 6H, ArH), 7.30 (s, 2H, NH2), 2.61 (t, 2H, CH2), 2.08 (q, 2H, CH2), 1.04 (s, 3H, CH3), 1.02 (s, 3H, CH3); 13C NMR (126 MHz, DMSO-d6) δ 203.51, 195.24, 187.56, 174.41, 164.51, 158.73, 144.29, 143.17, 140.49, 132.26, 132.16, 131.40, 129.77, 128.86, 128.45, 124.49, 121.36, 121.22, 120.89, 119.78, 118.80, 117.43, 111.99, 58.01, 50.93, 49.69, 32.00, 27.43, 27.16. |
2.2 Electrochemical measurements
The mild steel (MS) sheets employed in the electrochemical studies were procured from a commercial supplier and have the following elemental composition: C (0.076%), P (0.012%), Al (0.023%), Si (0.026%), Cr (0.050%), Mn (0.192%) and Fe (99.621%). The steel sheets were mechanically cut into 1 cm × 1 cm dimension and implanted in epoxy resin leaving an exposed geometric surface area of 1 cm2. The exposed MS surface was mechanically abraded using Struers MD Piano 220 mounted on Struers LaboPol-1 instrument and polished with SiC abrasive papers of different grades (600–1200 grit sizes) to remove traces of resin and surface rust respectively. The polished surface was washed with distilled water, degreased in acetone and dried at ambient temperature before further use. The aggressive test solution of 1 M HCl was prepared by dilution of 32% HCl and concentrations of INHs were prepared in 1 M acidic solution.
Electrochemical experiments were performed using AUTOLAB (model 302N) potentiostat/galvanostat from Metrohm. The instrument was coupled with a three-electrode assemblage using mild steel, Ag/AgCl, 3 M KCl and platinum rod as working, reference and counter electrodes, respectively. The cleaned mild steel surface with exposed surface area of 1 cm2 was used as the working electrode for the electrochemical studies. Before performing the electrochemical studies, mild steel surface was allowed to corrode freely for 1800 s without applying external current or potential to obtain a stable open circuit potential (OCP). After the OCP stabilization, electrochemical impedance spectroscopic (EIS) analyses were carried out for MS corrosion in 1 M HCl in the absence and presence of different concentrations of INH-1, INH-2 and INH-3, respectively. For EIS study, an AC signal of 10 mV amplitude and frequency of 100 kHz to 0.01 Hz was employed. The recorded Nyquist curves were fitted in suitable equivalent circuit model to get the values of charge transfer resistance through which inhibition efficiency at different concentrations of INH-1, INH-2 and INH-3 were evaluated using the following equation:25–27
| |
 | (1) |
where,
Rict and
R0ct represent the values of charge transfer resistances with and without INH-1, INH-2 and INH-3, respectively.
The potentiodynamic polarization behaviour of the electrochemical potential of mild steel in 1 M HCl with and without INH-1, INH-2 and INH-3 was monitored by varying the mild steel potential (with respect to OCP) from −250 to +250 mV at the scan rate of 1 mV s−1. The Tafel curves were extrapolated to get the values of corrosion current densities through which inhibition efficiencies at different concentrations of INH-1, INH-2 and INH-3 were calculated as follows:25–27
| |
 | (2) |
where,
i0corr and
iicorr represent the corrosion current densities in the absence and presence of INH-1, INH-2 and INH-3, respectively.
LPR measurements were carried out by sweeping the electrode potential range between +10 mV and −10 mV relative to OCP at a scan rate of 0.125 mV s−1. As the potential applied changes slightly, induced current flows between the working and counter electrodes, the slope of which gives the polarization resistance. The values of the measured polarization resistance were recorded and the inhibition efficiency was determined using the following relation:25–27
| |
 | (3) |
where
Rip and
R0p represent the polarization resistances in the presence and absence of INH-1, INH-2 and INH-3, respectively. All electrochemical measurements were carried out under unperturbed state at 303 K.
2.3 Surface studies
The effect of INHs on the mild steel surface was examined using energy dispersive X-ray (EDX) analyses. Polished mild steel as earlier described were immersed in 1 M HCl in the presence and absence of 1 mM of INH-1, INH-2 and INH-3 for 3 h. After the immersion time elapsed, the steel sheets were taken out, cleaned with distilled water and dried before the EDX spectra were recorded using a Zeiss Evo 50 XVP instrument.
2.4 Computational details
DFT studies were carried out for INHs in gas and aqueous phases using Becke three-parameter hybrid functional (B3) together with Lee–Yang–Paar functional (LYP).28 The 6-31+G(d,p) basis set of Gaussian 09W software package (Revision D.01)29 was chosen for the calculation. The optimized geometry of INH-1-3 was confirmed to match the true minima energy on the potential energy surface by the absence of imaginary frequency. The solvent effect on the geometry of INH-1-3 was accounted for using the integral equation formalism (IEF) version of the polarizable continuum model (PCM). Since heteroatoms of the studied compounds can protonate in acidic medium, DFT studies were also conducted for protonated forms of INH-1-3 alongside the neutral forms. The nitrogen heteroatom with the most negative charge was designated as the site for protonation. The different DFT-based reactivity indices for the neutral and protonated forms of INH-1, INH-2 and INH-3 were derived using the following relationships:30–32| |
 | (6) |
| |
 | (7) |
| |
 | (8) |
| |
 | (9) |
In the above equations, I, A, η, σ, χ, ΔN, EHOMO, and ELUMO represent ionization potential, electron affinity, hardness, softness, electronegativity, fraction of electron transfer, energy of highest occupied and lowest unoccupied frontier molecular orbitals, respectively.
The interactions between the investigated inhibitor molecules and Fe (110) plane surface were modelled using MC simulation. The adsorption locator code implemented in the Material Studio 8.0 software from Biovia-Accelrys Inc. USA was adopted in this simulation. The COMPASS (condensed phase optimized molecular potentials for atomistic simulation studies) force field was used for the simulation of all molecules and systems. The simulation of the corrosion inhibitor molecules designated as INH-1, INH-2 and INH-3 on Fe(110) surface was carried out in order to locate the low energy adsorption sites of the potential corrosion inhibitors on Fe surface. Extensive information on the procedure for conducting MC simulation can be found in our previous publications.15,33,34
3. Results and discussions
3.1 OCP, PDP and LPR measurements
The open circuit potential (OCP)/time profiles for mild steel in 1 M HCl solution with and without INH 1–3 are shown in Fig. 2. The OCP versus time plots provide information on the variation of OCP with time and its non-variability before further electrochemical measurements. The results in Fig. 2 show slight fluctuation in OCP up to 400 s, after which a linear profile is observed, which suggests a near zero time-differentials of OCP(d[OCP]/dt ≈ 0).35 However, in the present study, OCP versus time curves are recorded for 1800 s. Initial fluctuation of OCP could be due to slow dissolution of metallic oxide layers (Fe2O3 and Fe3O4) and formation of inhibitive films by inhibitor molecules in aggressive acidic medium.35,36 Once the oxide layers are completely dissolved and inhibitor molecules are adsorbed over the metallic surface, the OCP becomes relatively stable.
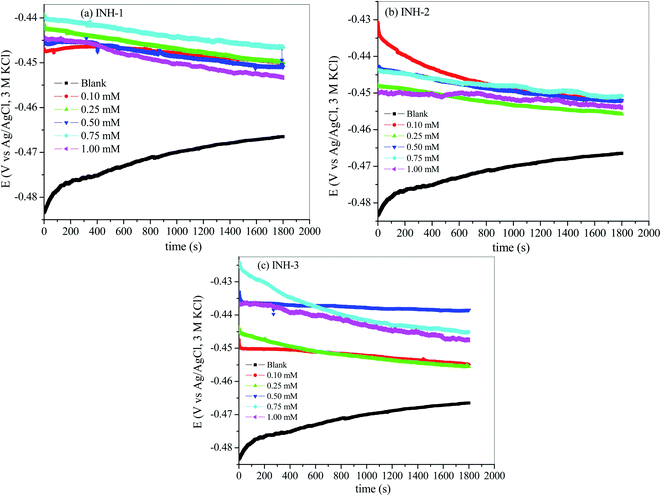 |
| | Fig. 2 OCP-time curves of mild steel in 1 M HCl without and with various concentrations of INH-1, INH-2 and INH-3 at 303 K. | |
Fig. 3 represents the polarization curves for metallic corrosion in 1 M HCl with and without INH-1, INH-2 and INH-3 at 303 K. Electrochemical parameters such as anodic and cathodic Tafel slopes (βa and βc), corrosion current density (icorr), corrosion potential (Ecorr) and protective capacity (% IEEIS) are reported in Table 2. The protection efficiencies of the studied compounds follow the order: INH-1 (89.35%) < INH-2 (94.09%) < INH-3 (95.77%) at 1 mM inhibitors concentration. The difference in protection efficiencies of INH-1, INH-2 and INH-3 can be explained based on their different chemical structures. INH-3 contains two aromatic rings and one carbonyl functional group compared to one aromatic ring and an amide functional group in INH-1 and INH-2. The higher protection efficiency of INH-2 compared to INH-1 can be explained on the basis of higher adsorption ability of –CO–NH– (amide functional group) of INH-2 than that of 1,2-diketone (–CO–CO–) of INH-1.
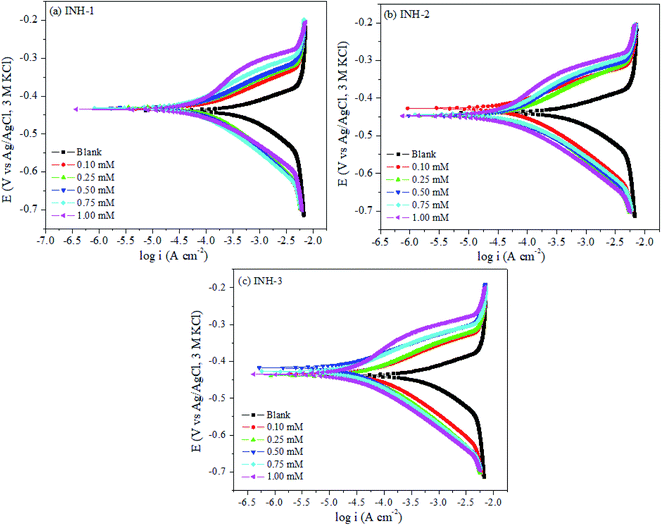 |
| | Fig. 3 Potentiodynamic polarization curves of mild steel in 1 M HCl without and with various concentrations of INH-1, INH-2 and INH-3 at 303 K. | |
Table 2 Polarization parameters for mild steel in 1 M HCl without and with various concentrations of INH-1, INH-2 and INH-3 at 303 K
| |
PDP |
LPR |
| Inhibitors |
Conc. (mM) |
−Ecorr (mV) |
icorr (μA cm−2) |
βa (mV dec−1) |
−βc (mV dec−1) |
% IEPDP |
RP (Ω cm2) |
% IELPR |
| Blank |
0 |
438.58 |
574.37 |
113.27 |
74.47 |
— |
33.97 |
— |
| INH-1 |
0.10 |
433.38 |
126.95 |
117.58 |
72.98 |
77.90 |
154.05 |
77.95 |
| 0.25 |
430.31 |
99.27 |
107.16 |
71.72 |
82.72 |
189.97 |
82.12 |
| 0.50 |
431.39 |
88.89 |
100.91 |
84.27 |
84.52 |
244.37 |
86.10 |
| 0.75 |
431.29 |
72.68 |
99.85 |
103.85 |
87.35 |
304.20 |
88.83 |
| 1.00 |
435.08 |
62.24 |
72.16 |
124.78 |
89.16 |
319.03 |
89.35 |
| INH-2 |
0.10 |
427.44 |
110.91 |
121.99 |
129.89 |
80.69 |
246.32 |
86.21 |
| 0.25 |
446.84 |
77.04 |
100.87 |
90.95 |
86.59 |
269.59 |
87.40 |
| 0.50 |
446.49 |
68.85 |
92.88 |
120.97 |
88.01 |
331.43 |
89.75 |
| 0.75 |
447.82 |
56.36 |
84.86 |
97.33 |
90.19 |
349.37 |
90.28 |
| 1.00 |
447.82 |
40.07 |
88.62 |
132.15 |
93.02 |
574.98 |
94.09 |
| INH-3 |
0.10 |
434.12 |
93.36 |
109.06 |
77.25 |
83.75 |
210.36 |
83.85 |
| 0.25 |
438.84 |
57.05 |
98.43 |
77.41 |
90.00 |
329.86 |
89.70 |
| 0.50 |
417.46 |
38.67 |
111.67 |
70.21 |
93.27 |
484.14 |
92.98 |
| 0.75 |
426.36 |
35.20 |
95.27 |
82.13 |
93.87 |
544.15 |
93.76 |
| 1.00 |
435.18 |
26.86 |
87.45 |
115.17 |
95.32 |
803.83 |
95.77 |
A look at Fig. 3 reveals that the anodic dissolution of mild steel substrate and hydrogen evolution and/or oxygen reduction at the cathodic branch were impeded in the presence of INH-1, INH-2 and INH-3 and corrosion current densities increase with their concentrations. This observation suggests that INH-1, INH-2 and INH-3 molecules inhibit mild steel corrosion by adsorbing at the active sites on the metallic surface and the coverage on metallic surface increases with increasing number of molecules of the inhibitor.37 The reduction in the corrosion of mild steel exhibited by INH-1, INH-2 and INH-3 can be categorized as anodic, cathodic or mixed-type based on the displacement in their corrosion potential (Ecorr) values with respect to the Ecorr value of blank (uninhibited Tafel curve). Literature study reveals that if the displacement in the Ecorr value is less than 85 mV then inhibitors can be categorized as mixed-type. In cases where the displacement in Ecorr value is more than 85 mV, inhibitors can be classified as anodic or cathodic type depending upon the direction of displacement. From the results presented in Table 2, it can be seen that INH-1, INH-2 and INH-3 behave as mixed-type corrosion inhibitors as the displacement in Ecorr values are less than 85 mV.38,39
From the linear polarization resistance measurements, the values of polarization resistance (RP) obtained from the slopes of the current density versus applied potential and the corresponding inhibition efficiencies were presented in Table 2. The presented data indicate that the rise in concentration of the INHs resulted in increase of the polarization resistance as well as the % IELPR as compared to the 33.97 Ω cm2 obtained in the inhibited system. The observed parallel increase in the inhibitory abilities of INHs suggests the adsorption of the compounds on the MS surface.
3.2 EIS measurements
Electrochemical impedance spectroscopy (EIS) is a reliable and sophisticated technique for gaining insights into the metal–inhibitor interactions. Impedance (Nyquist) spectra for mild steel corrosion in 1 M HCl in the absence and presence of INH-1, INH-2 and INH-3 at different concentrations are displayed in Fig. 4. The impedance spectra are characterized by single depressed semicircles indicating that the corrosion phenomenon follows a charge-transfer mechanism.40,41 The consistent similarity in shape reveals that the introduction of INH-1, INH-2 and INH-3 into the aggressive acidic medium did not affect the corrosion mechanism of the metal substrate. A careful look at the impedance spectra reveals that increase in the concentration of INH-1, INH-2 and INH-3 increased the charge transfer resistance, indicating the inhibition of metallic corrosion via the formation of protective film on the steel surface.42,43 This finding indicates that the three investigated compounds adsorb at the mild steel/acid interface and form inhibitive barrier. The EIS spectra was fitted into a simple Randle circuit (Fig. 5), consisting of a solution resistance (Rs), charge transfer resistance (Rct) and a constant phase element (CPE).The EIS parameters derived from the spectra are presented in Table 3.
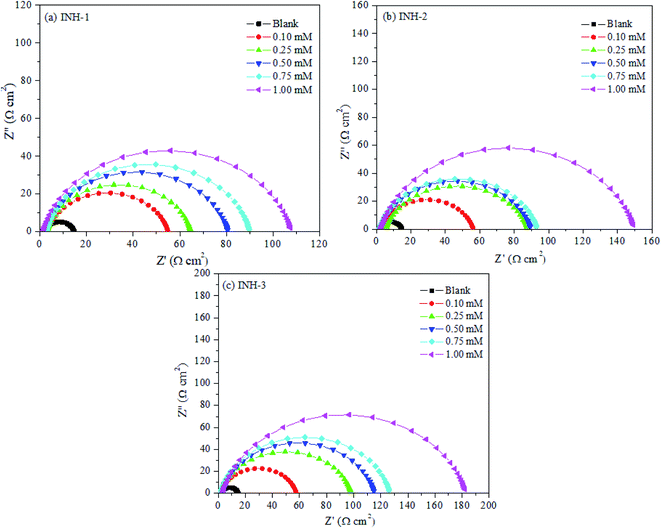 |
| | Fig. 4 Nyquist plots for mild steel in 1 M HCl without and with various concentrations of INH-1, INH-2 and INH-3 at 303 K. | |
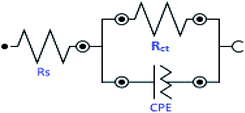 |
| | Fig. 5 Randle equivalent circuit. | |
Table 3 Electrochemical impedance parameters obtained for mild steel corrosion in 1 M HCl with and without INH-1, INH-2 and INH-3 at 303 K
| Inhibitor |
Conc. (mM) |
Rs (Ω cm2) |
Rct (Ω cm2) |
n |
Y0 (μΩ sn cm−2) |
Cdl (μF cm−2) |
χ2 |
% IEEIS |
| Blank |
0 |
2.07 |
12.6 |
0.871 |
435.0 |
201.19 |
0.22940 |
— |
| INH-1 |
0.10 |
3.19 |
51.8 |
0.855 |
278.0 |
135.43 |
0.22888 |
75.68 |
| 0.25 |
3.12 |
61.7 |
0.867 |
255.0 |
134.87 |
0.21285 |
79.58 |
| 0.50 |
2.40 |
78.2 |
0.867 |
219.0 |
117.35 |
0.26166 |
83.89 |
| 0.75 |
2.80 |
87.2 |
0.874 |
239.0 |
136.79 |
0.25874 |
85.55 |
| 1.00 |
1.39 |
106.0 |
0.866 |
275.0 |
159.13 |
0.26232 |
88.11 |
| INH-2 |
0.10 |
2.66 |
53.6 |
0.846 |
348.0 |
168.58 |
0.34178 |
76.49 |
| 0.25 |
5.29 |
82.7 |
0.817 |
253.0 |
106.40 |
0.15769 |
84.76 |
| 0.50 |
2.18 |
87.4 |
0.850 |
279.0 |
144.87 |
0.28448 |
85.58 |
| 0.75 |
1.70 |
91.7 |
0.849 |
292.0 |
153.37 |
0.36472 |
86.26 |
| 1.00 |
2.52 |
147 |
0.851 |
215.0 |
117.43 |
0.27949 |
91.43 |
| INH-3 |
0.10 |
1.85 |
55.7 |
0.866 |
375.0 |
206.09 |
0.40760 |
77.38 |
| 0.25 |
2.00 |
96.3 |
0.849 |
268.0 |
139.85 |
0.37016 |
86.92 |
| 0.50 |
2.09 |
113.0 |
0.867 |
235.0 |
134.69 |
0.32957 |
88.85 |
| 0.75 |
1.50 |
125.0 |
0.872 |
236.0 |
140.70 |
0.26360 |
89.92 |
| 1.00 |
3.01 |
180.0 |
0.857 |
165.0 |
91.76 |
0.25389 |
93.00 |
The results show an increase in the values of Rct and decrease in the values of Cdl with increase in the concentration of the inhibitors. The remarkable increase in the Rct values can be attributed to the formation of a protective film on the steel surface by the inhibitor molecules. The decrease in Cdl can be related to the thickness of the protective barrier on the mild steel/HCl interface, which is due to the substitution of the pre-adsorbed water molecules by inhibitor molecules.44,45 The double layer capacitance (Cdl) for mild steel corrosion in the acid with and without INH-1, INH-2 and INH-3 was derived as:46
where,
Y0 signifies the CPE constant,
ωmax is the angular frequency and
n represents the phase shift which provides information on the degree of roughness of the metal surface.
46
Furthermore, the Bode plots for the mild steel corrosion in the presence and absence of INH-1, INH-2 and INH-3 revealed a one-phase peak which confirms a single time constant and single charge transfer mechanism in the corrosion process.47 The phase angles increased as the concentrations of INH-1, INH-2 and INH-3 increased (Fig. 6). The increase in the phase angle values of inhibited Bode plots is attributed to the adsorption of INH-1, INH-2 and INH-3 molecules on the steel surface.47,48 The order of inhibition efficiencies obtained is: INH-3 (93.00%) > INH-2 (91.43%) > INH-1 (88.11%) at 1 mM.
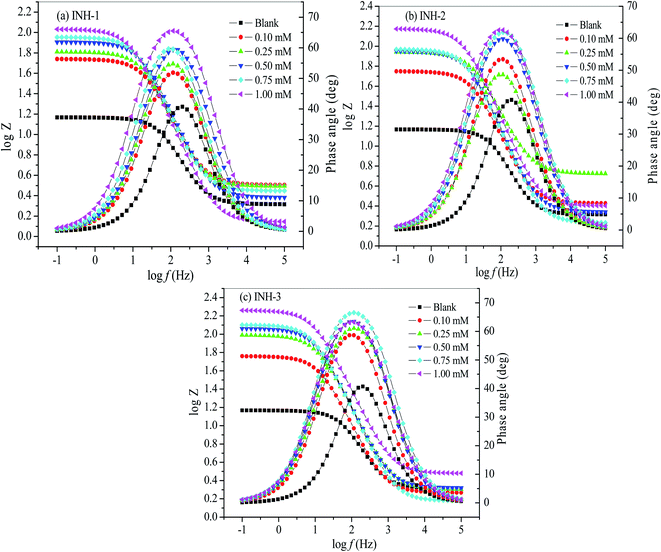 |
| | Fig. 6 Bode plots for mild steel in 1 M HCl without and with various concentrations of INH-1, INH-2 and INH-3 at 303 K. | |
The inhibitory abilities of the investigated compounds (chromeno-carbonitriles) were compared with similar studies in literature as presented in Table 4. While the reported studies in literature relatively yielded higher inhibition efficiencies than the present work, it is obvious that the observed differences can be attributed to various factors. However, the presented data shows that INHs acts as excellent inhibitors of mild steel corrosion in the studied medium.
Table 4 Comparison of the inhibition performances of chromeno-carbonitriles for steel obtained in acidic medium with some literature values
| Chromeno-carbonitriles |
Metal/medium |
Conc. (μM) |
% IEEIS |
Ref. |
| 2,4-Diamino-7-nitro-5-(phenylthio)-5H-chromeno[2,3-b]pyridine-3-carbonitrile |
MS/1 M HCl |
127 |
96.09 |
49 |
| 2,4-Diamino-5-(phenylthio)-5H-chromeno[2,3-b]pyridine-3-carbonitrile |
MS/1 M HCl |
127 |
97.16 |
49 |
| 2,4-Diamino-7-hydroxy-5-(phenylthio)-5H-chromeno[2,3-b]pyridine-3-carbonitrile |
MS/1 M HCl |
127 |
97.54 |
49 |
| 2,4-Diamino-5-(phenylthio)-5H-chromeno[2,3-b]pyridine-3-carbonitrile |
N80 steel/15% HCl |
577 |
89.20 |
50 |
| 2,4-Diamino-5-phenoxy-5H-chromeno[2,3-b]pyridine-3-carbonitrile |
N80 steel/15% HCl |
605 |
82.91 |
50 |
| 5-Amino-9-hydroxy-2-phenylchromeno[4,3,2-de][1,6]-naphthyridine-4-carbonitrile |
MS/1 M HCl |
65 |
95.19 |
51 |
| 5-Amino-9-hydroxy-2-(p-tolyl)chromeno-[4,3,2-de][1,6]-naphthyridine-4-carbonitrile |
MS/1 M HCl |
65 |
97.18 |
51 |
| 5-Amino-9-hydroxy-2-(4-methoxyphenyl)chromeno[4,3,2-de][1,6]naphthyridine-4-carbonitrile |
MS/1 M HCl |
65 |
98.42 |
51 |
| 2-Amino-7,7-dimethyl-1′,3′,5-trioxo-1′,3′,5,6,7,8-hexahydrospiro[chromene-4,2′-indene]-3-carbonitrile |
MS/1 M HCl |
1000 |
88.11 |
This work |
| 3-Amino-7,7-dimethyl-2′,5-dioxo-5,6,7,8-tetrahydrospiro[chromene-4,3′-indoline]-2-carbonitrile |
MS/1 M HCl |
1000 |
91.43 |
This work |
| 3′-Amino-7′,7′-dimethyl-2,5′-dioxo-5′,6′,7′,8′-tetrahydro-2H-spiro[acenaphthylene-1,4′-chromene]-2′-carbonitrile |
MS/1 M HCl |
1000 |
93.00 |
This work |
3.3 Adsorption isotherm
Adsorption isotherm is one of the most important aspects of the corrosion inhibition study as it furnishes information about the mode of metal/inhibitor interactions. Fig. 7 shows the Langmuir, Temkin and Freundlich adsorption isotherms used to demonstrate the adsorption behaviour of INH-1, INH-2 and INH-3. The parameters obtained from the fitting of these tested adsorption isotherms are presented in Table 5. By comparing the goodness of fit for the three isotherms, it is obvious that the best adsorption model is the Langmuir adsorption isotherm with regression coefficient (R2) values of about a unity. The Langmuir adsorption isotherm can be represented as:52,53| |
 | (11) |
where, Kads is the adsorption equilibrium constant, Cinh signifies the concentration of the inhibitors (INH-1, INH-2 and INH-3) and θ represents the surface coverage value. Straight lines were obtained for Cinh/θ versus Cinh (mM) in Fig. 7 which suggests that the adsorption of the INH-1, INH-2 and INH-3 follows the proposed Langmuir adsorption isotherm. The values of equilibrium constant (Kads) for INH-1, INH-2 and INH-3 were derived from the slope values of their respective Langmuir adsorption isotherm model. The relationship between Kads and  is given by the following equation:54,55
| |
 | (12) |
where, 55.5 signifies the concentration of water in the solution, T is the absolute temperature, and R is the universal gas constant. The values of Kads and  derived for INH-1, INH-2 and INH-3 interactions with metallic surface are presented in Table 6. Higher values of Kads obtained for INH-1, INH-2 and INH-3 suggest that they have strong adsorption ability. The range of the calculated values of the Gibb's free energy of adsorption suggest that INH-1, INH-2 and INH-3 adsorb by both physisorption and chemisorption.35,49,56 Furthermore, the relatively high negative values recorded for
  for the inhibitors showed that the adsorption on mild steel surface is spontaneous.
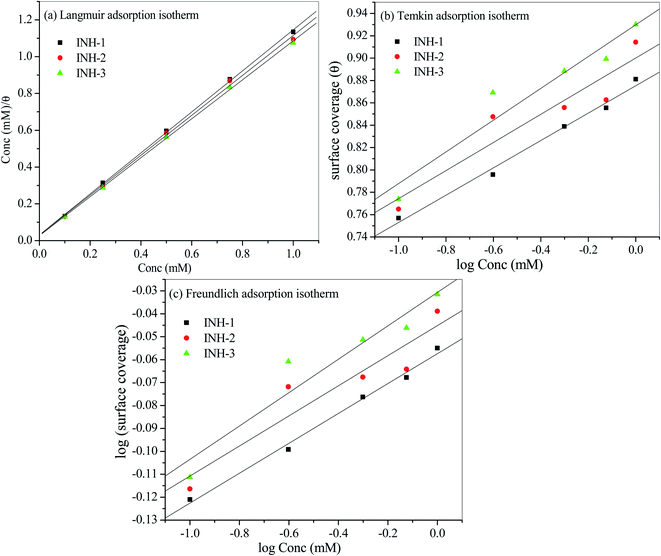 |
| | Fig. 7 Langmuir, Temkin and Freundlich adsorption isotherm plots for the adsorption of INH-1, INH-2 and INH-3 on the mild steel surface in 1 M HCl at 303 K. | |
Table 5 Slope, intercept and regression coefficient values derived for different adsorption isotherms for adsorption of INHs on mild steel surface in 1 M HCl
| Inhibitors |
Adsorption isotherm |
| Langmuir adsorption isotherm |
Temkin adsorption isotherm |
Freundlich adsorption isotherm |
| Slope |
Intercept |
R2 |
Slope |
Intercept |
R2 |
Slope |
Intercept |
R2 |
| INH-1 |
1.1148 |
0.031 |
0.9997 |
0.1223 |
0.875 |
0.9947 |
0.0652 |
−0.057 |
0.9963 |
| INH-2 |
1.0858 |
0.030 |
0.9989 |
0.1258 |
0.900 |
0.9400 |
0.0657 |
−0.045 |
0.9409 |
| INH-3 |
1.0596 |
0.027 |
0.9997 |
0.1421 |
0.930 |
0.9643 |
0.0728 |
−0.031 |
0.9601 |
Table 6 Values of Kads and  calculated from the Langmuir adsorption isotherm plots for INH-1, INH-2 and INH-3 on mild steel substrate in 1 M HCl at 303 K
| Inhibitor |
Kads |

|
| INH-1 |
32.2581 |
18.87 |
| INH-2 |
33.3333 |
18.95 |
| INH-3 |
37.0370 |
18.93 |
3.4 EDX spectra analyses
The adsorption of INH-1, INH-2 and INH-3 on metallic surface was further supported by energy dispersive X-ray (EDX) analysis. The EDX spectra of mild steel surface after 3 h corrosion in the absence and presence of the considered inhibitors are presented in Fig. 8. It can be seen that EDX spectra of mild steel surface without the inhibitors shows the characteristics signals for C (carbon), Fe (iron) and oxygen (O) only. The presence of EDX signal for oxygen is attributed to the slow oxidation of metallic surface during EDX analyses. It can also be seen that EDX spectra of MS surfaces in the presence of the inhibitors investigated showed additional signals for nitrogen (N). More so, intensity for EDX signal for oxygen is increased in the presence of INH-1, INH-2 and INH-3. The presence of additional signal for nitrogen and increased intensity for oxygen indicates that the metallic surface now contains the adsorbed inhibitor molecules.
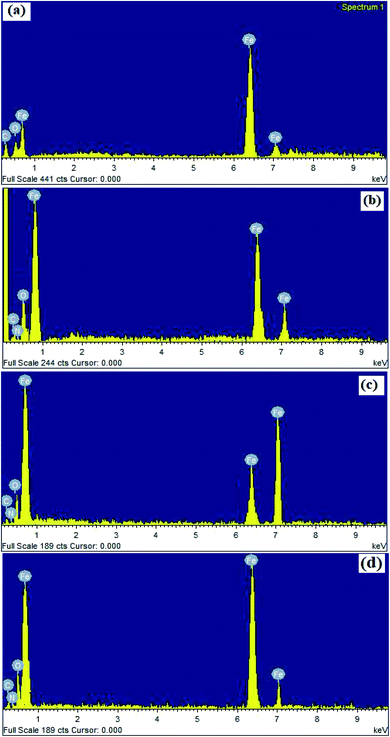 |
| | Fig. 8 EDX spectra of corroded MS surfaces without (a) and with INH-1 (b), INH-2 (c) and INH-3 (d). | |
3.5 Computational studies
Computational studies were carried out to corroborate the results obtained from experimental studies. DFT based quantum chemical calculations were carried out on INH-1, INH-2 and INH-3 in the neutral (gas and aqueous phases) and protonated (aqueous phase). It is well established that in aqueous medium, organic inhibitors easily undergo solvation by their interactions with water molecules using their polar functional groups, therefore DFT studies were conducted preferably in aqueous phase. More so, in aggressive acidic medium, the heteroatoms of INH-1, INH-2 and INH-3 can also undergo protonation. In view of this, DFT study was also conducted for protonated forms of the inhibitor molecules. The optimized structures, HOMO, LUMO and MEP (molecular electrostatic potential) isosurfaces of INH-1, INH-2 and INH-3 in their neural and protonated forms are presented in Fig. 9 and 10. It was observed that HOMO and LUMO are mainly located around the parts of the molecules containing polar functional groups such as –C![[double bond, length as m-dash]](https://www.rsc.org/images/entities/char_e001.gif) O, –CN, –NH2, –CONH2 and –CO–CO–, indicating that these parts of the molecules are mainly involved in the electron donation (HOMO) and acceptance (LUMO). HOMO signifies the part(s) of the inhibitor molecules responsible for electron donation (to metallic d-orbitals) whereas LUMO signifies the part(s) of INH-1, INH-2 and INH-3 molecules responsible for the electron acceptance (from metallic d-orbitals).54,57–59 MEP study provides information about the regions related with electrophilic and nucleophilic reactions. Red-yellow regions on the INH-1, INH-2 and INH-3 molecules are responsible for electrophilic attacks, whereas blue and light blue regions are responsible for the nucleophilic attacks (Fig. 9 and 10). It is clearly seen that MEP also localized over the parts of molecules where HOMO and LUMO are located. Table 7 shows the list of selected reactivity parameters derived for INH-1, INH-2 and INH-3 in different studied conditions. It is important to mention that a higher EHOMO and lower ELUMO values are consistent with high protection efficiency. In the present investigation, observation of the results presented in Table 7 depicts that though ELUMO did not show any predicted trend, EHOMO values are increasing from INH-1 to INH-3. This is an indication that the electron donating ability of INH-1, INH-2 and INH-3 molecules is also increasing in the same sequence. Although, the reactivity parameters show different trends for INH-1, INH-2 and INH-3, lowest values of electronegativity for INH-3 showed that it is most potent to transfer its electron to the d-orbitals of the surface metallic atoms and offers strong bonding that comes in the form of its highest protection efficiency. The trends of DFT parameters in different studied conditions followed similar sequence.
O, –CN, –NH2, –CONH2 and –CO–CO–, indicating that these parts of the molecules are mainly involved in the electron donation (HOMO) and acceptance (LUMO). HOMO signifies the part(s) of the inhibitor molecules responsible for electron donation (to metallic d-orbitals) whereas LUMO signifies the part(s) of INH-1, INH-2 and INH-3 molecules responsible for the electron acceptance (from metallic d-orbitals).54,57–59 MEP study provides information about the regions related with electrophilic and nucleophilic reactions. Red-yellow regions on the INH-1, INH-2 and INH-3 molecules are responsible for electrophilic attacks, whereas blue and light blue regions are responsible for the nucleophilic attacks (Fig. 9 and 10). It is clearly seen that MEP also localized over the parts of molecules where HOMO and LUMO are located. Table 7 shows the list of selected reactivity parameters derived for INH-1, INH-2 and INH-3 in different studied conditions. It is important to mention that a higher EHOMO and lower ELUMO values are consistent with high protection efficiency. In the present investigation, observation of the results presented in Table 7 depicts that though ELUMO did not show any predicted trend, EHOMO values are increasing from INH-1 to INH-3. This is an indication that the electron donating ability of INH-1, INH-2 and INH-3 molecules is also increasing in the same sequence. Although, the reactivity parameters show different trends for INH-1, INH-2 and INH-3, lowest values of electronegativity for INH-3 showed that it is most potent to transfer its electron to the d-orbitals of the surface metallic atoms and offers strong bonding that comes in the form of its highest protection efficiency. The trends of DFT parameters in different studied conditions followed similar sequence.
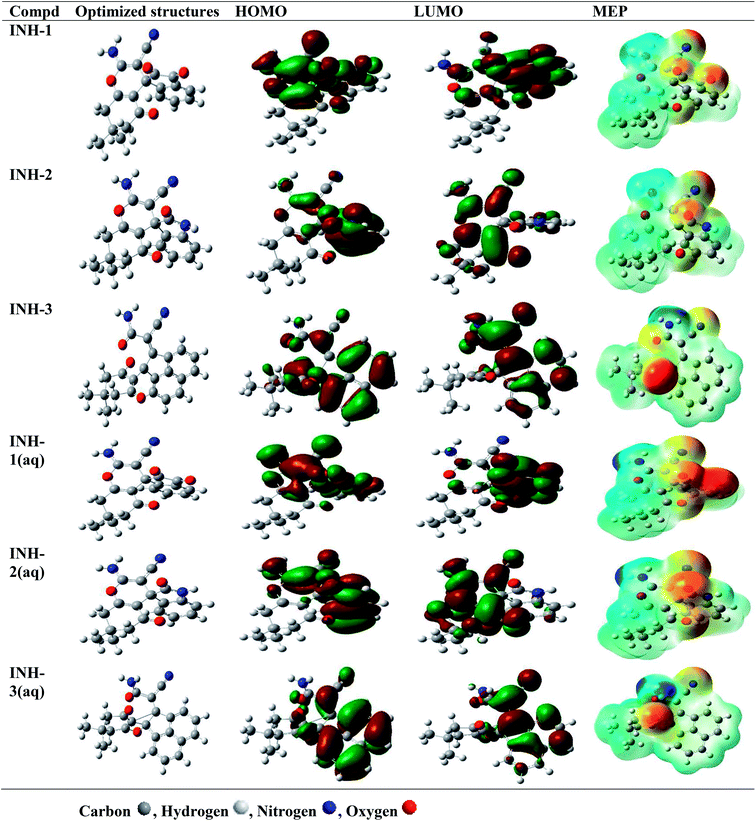 |
| | Fig. 9 Optimized, HOMO, LUMO and MEP frontier molecular orbitals of INH-1, INH-2 and INH-3 in neutral gas and aqueous (aq) phases. | |
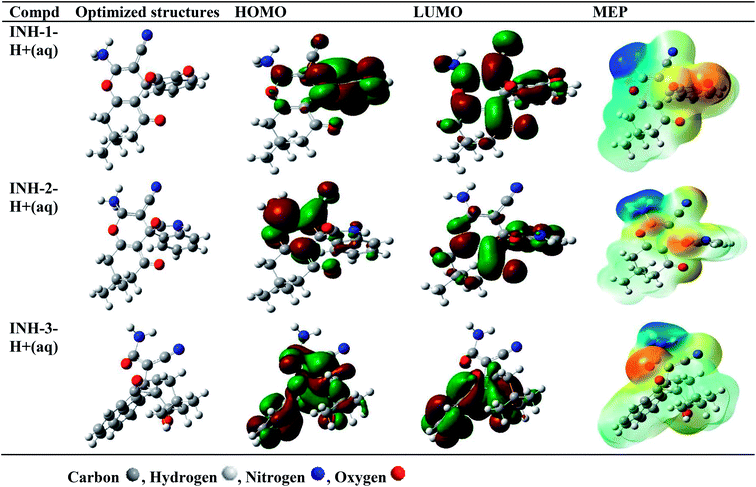 |
| | Fig. 10 Optimized, HOMO, LUMO and MEP frontier molecular orbitals of protonated forms of INH-1, INH-2 and INH-3 in aqueous (aq) phase. | |
Table 7 DFT parameters for the interactions of INH-1, INH-2 and INH-3 with mild steel surface in their neutral (gas and aqueous) and protonated (aqueous) phases
| Inhibitor |
EHOMO (eV) |
ELUMO (eV) |
ΔE (eV) |
μ (D) |
I (eV) |
A (eV) |
χ (eV) |
η (eV) |
ω (eV) |
σ (eV) |
ΔN (eV) |
| DFT parameters for neutral forms |
| INH-1 |
−6.784 |
−4.998 |
1.786 |
6.593 |
6.784 |
4.998 |
5.891 |
0.893 |
19.431 |
1.120 |
0.621 |
| INH-2 |
−6.398 |
−5.744 |
0.654 |
5.124 |
6.398 |
5.744 |
6.071 |
0.327 |
56.356 |
3.058 |
1.420 |
| INH-3 |
−6.349 |
−2.927 |
3.422 |
4.745 |
6.349 |
2.927 |
4.638 |
1.711 |
6.286 |
0.584 |
0.690 |
![[thin space (1/6-em)]](https://www.rsc.org/images/entities/char_2009.gif) |
| DFT parameters for solvated forms |
| INH-1(aq) |
−6.447 |
−3.150 |
3.297 |
16.979 |
6.447 |
3.150 |
4.799 |
1.649 |
6.984 |
0.607 |
0.668 |
| INH-2(aq) |
−6.321 |
−2.034 |
4.287 |
9.845 |
6.321 |
2.034 |
4.178 |
2.144 |
4.071 |
0.467 |
0.658 |
| INH-3(aq) |
−6.430 |
−2.875 |
3.555 |
6.220 |
6.430 |
2.875 |
4.653 |
1.778 |
6.089 |
0.563 |
0.660 |
![[thin space (1/6-em)]](https://www.rsc.org/images/entities/char_2009.gif) |
| DFT parameters for protonated forms |
| INH-1-H+(aq) |
−4.335 |
−2.490 |
1.845 |
30.334 |
4.335 |
2.490 |
3.412 |
0.922 |
6.311 |
1.084 |
1.945 |
| INH-2-H+(aq) |
−5.064 |
−6.988 |
12.052 |
7.142 |
5.064 |
6.988 |
0.962 |
6.026 |
0.077 |
0.166 |
0.661 |
| INH-3-H+(aq) |
−5.888 |
−2.409 |
3.479 |
4.074 |
5.888 |
2.409 |
4.148 |
1.740 |
4.946 |
0.575 |
0.820 |
The simulated equilibrium configurations for the adsorption of INH-1, INH-2 and INH-3 molecules on metallic surface (Fe(110)), derived from MC simulations are presented in Fig. 11. It can be seen that the inhibitors effectively adsorb using their electron rich centres. Different MC simulations parameters including total energy (Etotal), rigid adsorption energy (Erigid), adsorption energy (Eads) and deformation energy (Edef) are presented in Table 8. Etotal is the total sum of the energies of the adsorbate (inhibitor) and metal substrates in the equilibrium configuration, while Erigid is the energy released when unrelaxed adsorbate/inhibitor molecule adsorb on the steel surface. When the adsorbed inhibitor molecule is relaxed, additional energy is released, which is referred to as the Edef. The Eads is therefore the sum of both Erigid and Edef. The negative values of Eads for INH-1, INH-2 and INH-3 indicate that they spontaneously adsorb on the metallic surface.56,60–62 Careful observation of the results showed that the magnitude of Eads (kcal mol−1) followed the sequence: INH-3(130.35) > INH-2(125.679) > INH-1(124.394). Furthermore, the amount of energy released upon adsorption of one molecule of the inhibitors (dEads/dNi) also confirmed that INH-3 promised to adsorb on steel surface better than INH-1 and INH-2.
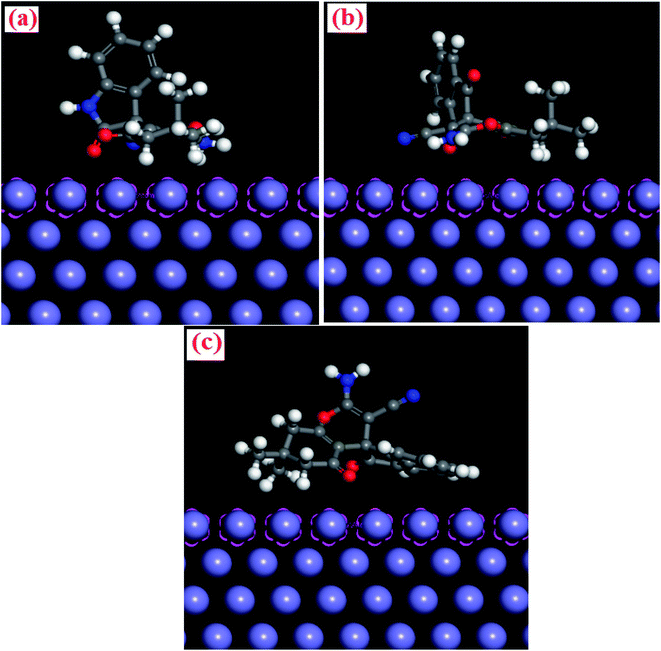 |
| | Fig. 11 Side views of the most stable configurations for the adsorption of (a) INH-1, (b) INH-2 and (c) INH-3 on Fe (110) surface calculated using -MC simulations (in kcal mol−1). | |
Table 8 Outputs and descriptors calculated by MC simulation for adsorption of (a) INH-1, (b) INH-2 and (c) INH-3 on Fe (110) surface (in kcal mol−1)
| Systems |
Total energy |
Adsorption energy |
Rigid adsorption energy |
Deformation energy |
dEad/dNi: inhibitor |
| Fe(110) + INH-1 |
−209.472 |
−124.394 |
−129.250 |
4.856 |
−124.394 |
| Fe(110) + INH-2 |
−208.393 |
−125.679 |
−130.666 |
4.986 |
−125.679 |
| Fe(110) + INH-3 |
−78.311 |
−130.358 |
−147.572 |
17.214 |
−130.358 |
4. Conclusions
In the present investigation, effects of three heterocyclic inhibitors (INHs) namely, 2-amino-7,7-dimethyl-1′,3′,5-trioxo-1′,3′,5,6,7,8-hexahydrospiro[chromene-4,2′-indene]-3-carbonitrile (INH-1), 3-amino-7,7-dimethyl-2′,5-dioxo-5,6,7,8-tetrahydrospiro[chromene-4,3′-indoline]-2-carbonitrile (INH-2) and 3′-amino-7′,7′-dimethyl-2,5′-dioxo-5′,6′,7′,8′-tetrahydro-2H-spiro[acenaphthylene-1,4′-chromene]-2′-carbonitrile (INH-3) on mild steel corrosion were studied using experimental and computational methods and the following conclusions were drawn:
1. INHs act as effective corrosion inhibitors and their efficiencies increase with increased concentration. Maximum efficiencies of 95.77%, 94.09% and 89.35% were observed for INH-3, INH-2 and INH-1, respectively at 1 mM concentration.
2. Polarization study suggested that INH-1, INH-2 and INH-3 acted as mixed-type corrosion inhibitors and they became effective by blocking the active sites present on the metallic surface.
3. EIS study suggested that INH-1, INH-2 and INH-3 adsorbed at the interface of metal (MS) and electrolyte (1 M HCl) and increase the value of charge transfer resistance.
4. EDX analyses showed that the inhibitors adsorb on metallic surface and inhibit the MS corrosion in acidic medium.
5. Adsorption of INH-1, INH-2 and INH-3 on metallic surface followed the Langmuir adsorption isotherm model.
6. DFT study showed that INH-1, INH-2 and INH-3 interact with metallic surface using donor–acceptor interactions.
7. MC simulations study showed that INH-1, INH-2 and INH-3 spontaneously adsorb using their electron rich centres.
Conflicts of interest
The authors declare no conflict of interest.
Acknowledgements
EDA thankfully acknowledge the North-West University (Mafikeng Campus), South Africa for postdoctoral research fellowship. The authors also acknowledge the Centre for High Performance Computing (CHPC), CSIR, South Africa for granting access to computing resources. The authors extend their appreciation to the Researchers supporting project number (RSP-2020/247) King Saud University, Riyadh, Saudi Arabia.
References
- Y. Abboud, A. Abourriche, T. Saffaj, M. Berrada, M. Charrouf, A. Bennamara, A. Cherqaoui and D. Takky, Appl. Surf. Sci., 2006, 252, 8178–8184 CrossRef CAS.
- A. Mishra, J. Aslam, C. Verma, M. A. Quraishi and E. E. Ebenso, J. Taiwan Inst. Chem. Eng., 2020, 114, 341–358 CrossRef CAS.
- K. Khaled, Mater. Chem. Phys., 2011, 125, 427–433 CrossRef CAS.
- L. Garverick, Corrosion in the petrochemical industry, ASM international, 1994 Search PubMed.
- M. Finšgar and J. Jackson, Corros. Sci., 2014, 86, 17–41 CrossRef.
- L. T. Popoola, A. S. Grema, G. K. Latinwo, B. Gutti and A. S. Balogun, Int. J. Ind. Chem., 2013, 4, 35 CrossRef.
- G. Koch, in Trends in Oil and Gas Corrosion Research and Technologies, Elsevier, 2017, pp. 3–30 Search PubMed.
- C. Verma, E. E. Ebenso and M. Quraishi, J. Mol. Liq., 2017, 233, 403–414 CrossRef CAS.
- T. Yan, S. Zhang, L. Feng, Y. Qiang, L. Lu, D. Fu, Y. Wen, J. Chen, W. Li and B. Tan, J. Taiwan Inst. Chem. Eng., 2020, 106, 118–129 CrossRef CAS.
- B. Wang, M. Du, J. Zhang and C. Gao, Corros. Sci., 2011, 53, 353–361 CrossRef CAS.
- D. K. Yadav and M. A. Quraishi, Ind. Eng. Chem. Res., 2012, 51, 14966–14979 CrossRef CAS.
- M. Goyal, S. Kumar, I. Bahadur, C. Verma and E. E. Ebenso, J. Mol. Liq., 2018, 256, 565–573 CrossRef CAS.
- I. Ahamad, R. Prasad and M. Quraishi, Corros. Sci., 2010, 52, 933–942 CrossRef CAS.
- M. M. Solomon, S. A. Umoren, M. A. Quraishi and M. Salman, J. Colloid Interface Sci., 2019, 551, 47–60 CrossRef CAS.
- C. Verma, L. O. Olasunkanmi, E. E. Ebenso, M. A. Quraishi and I. B. Obot, J. Phys. Chem. C, 2016, 120, 11598–11611 CrossRef CAS.
- C. Verma, M. A. Quraishi, K. Kluza, M. Makowska-Janusik, L. O. Olasunkanmi and E. E. Ebenso, Sci. Rep., 2017, 7, 44432 CrossRef CAS.
- C. Verma, L. O. Olasunkanmi, T. W. Quadri, E.-S. M. Sherif and E. E. Ebenso, J. Phys. Chem. C, 2018, 122, 11870–11882 CrossRef CAS.
- A. Mishra, C. Verma, V. Srivastava, H. Lgaz, M. Quraishi, E. E. Ebenso and I.-M. Chung, Journal of Bio- and Tribo-Corrosion, 2018, 4, 32 CrossRef.
- R. C. Cioc, E. Ruijter and R. V. Orru, Green Chem., 2014, 16, 2958–2975 RSC.
- A. Dömling, Chem. Rev., 2006, 106, 17–89 CrossRef.
- A. Dömling and I. Ugi, Angew. Chem., Int. Ed., 2000, 39, 3168–3210 CrossRef.
- H. Sharghi, R. Khalifeh and M. M. Doroodmand, Adv. Synth. Catal., 2009, 351, 207–218 CrossRef CAS.
- M.-O. Simon and C.-J. Li, Chem. Soc. Rev., 2012, 41, 1415–1427 RSC.
- B. Zeynizadeh and D. Setamdideh, J. Chin. Chem. Soc., 2005, 52, 1179–1184 CrossRef CAS.
- M. A. Amin, S. S. A. El-Rehim, E. El-Sherbini and R. S. Bayoumi, Electrochim. Acta, 2007, 52, 3588–3600 CrossRef CAS.
- Y. Tang, X. Yang, W. Yang, R. Wan, Y. Chen and X. Yin, Corros. Sci., 2010, 52, 1801–1808 CrossRef CAS.
- T. W. Quadri, L. O. Olasunkanmi, O. E. Fayemi, M. M. Solomon and E. E. Ebenso, ACS Omega, 2017, 2, 8421–8437 CrossRef CAS.
- A. D. Becke, J. Chem. Phys., 1993, 98, 5648–5652 CrossRef CAS.
- M. J. Frisch, G. W. Trucks, H. B. Schlegel, G. E. Scuseria, M. A. Robb, J. R. Cheeseman, G. Scalmani, V. Barone, G. A. Petersson, H. Nakatsuji, X. Li, M. Caricato, A. Marenich, J. Bloino, B. G. Janesko, R. Gomperts, B. Mennucci, H. P. Hratchian, J. V. Ortiz, A. F. Izmaylov, J. L. Sonnenberg, D. Williams-Young, F. Ding, F. Lipparini, F. Egidi, J. Goings, B. Peng, A. Petrone, T. Henderson, D. Ranasinghe, V. G. Zakrzewski, J. Gao, N. Rega, G. Zheng, W. Liang, M. Hada, M. Ehara, K. Toyota, R. Fukuda, J. Hasegawa, M. Ishida, T. Nakajima, Y. Honda, O. Kitao, H. Nakai, T. Vreven, K. Throssell, J. A. Montgomery Jr, J. E. Peralta, F. Ogliaro, M. Bearpark, J. J. Heyd, E. Brothers, K. N. Kudin, V. N. Staroverov, T. Keith, R. Kobayashi, J. Normand, K. Raghavachari, A. Rendell, J. C. Burant, S. S. Iyengar, J. Tomasi, M. Cossi, J. M. Millam, M. Klene, C. Adamo, R. Cammi, J. W. Ochterski, R. L. Martin, K. Morokuma, O. Farkas, J. B. Foresman, and D. J. Fox, Gaussian 09, Revision A.02, Gaussian, Inc., Wallingford CT, 2016 Search PubMed.
- I. Obot, D. Macdonald and Z. Gasem, Corros. Sci., 2015, 99, 1–30 CrossRef CAS.
- S. Kaya, P. Banerjee, S. K. Saha, B. Tüzün and C. Kaya, RSC Adv., 2016, 6, 74550–74559 RSC.
- G. Gece and S. Bilgiç, Corros. Sci., 2009, 51, 1876–1878 CrossRef CAS.
- C. Verma, H. Lgaz, D. Verma, E. E. Ebenso, I. Bahadur and M. Quraishi, J. Mol. Liq., 2018, 260, 99–120 CrossRef CAS.
- S. Kaya, B. Tüzün, C. Kaya and I. B. Obot, J. Taiwan Inst. Chem. Eng., 2016, 58, 528–535 CrossRef CAS.
- C. Verma, I. Obot, I. Bahadur, E.-S. M. Sherif and E. E. Ebenso, Appl. Surf. Sci., 2018, 457, 134–149 CrossRef CAS.
- C. B. Verma, M. Quraishi and A. Singh, J. Taiwan Inst. Chem. Eng., 2015, 49, 229–239 CrossRef CAS.
- L. O. Olasunkanmi and E. E. Ebenso, J. Colloid Interface Sci., 2020, 561, 104–116 CrossRef CAS.
- M. Hegazy, M. Abdallah and H. Ahmed, Corros. Sci., 2010, 52, 2897–2904 CrossRef CAS.
- F. Bentiss, M. Traisnel, H. Vezin, H. Hildebrand and M. Lagrenee, Corros. Sci., 2004, 46, 2781–2792 CrossRef CAS.
- H. Ashassi-Sorkhabi, D. Seifzadeh and M. Hosseini, Corros. Sci., 2008, 50, 3363–3370 CrossRef CAS.
- K. Ansari, M. Quraishi and A. Singh, Corros. Sci., 2015, 95, 62–70 CrossRef CAS.
- E. Naderi, A. Jafari, M. Ehteshamzadeh and M. Hosseini, Mater. Chem. Phys., 2009, 115, 852–858 CrossRef CAS.
- A. R. H. Zadeh, I. Danaee and M. H. Maddahy, J. Mater. Sci. Technol., 2013, 29, 884–892 CrossRef CAS.
- B. Díaz, E. Härkönen, J. Światowska, V. Maurice, A. Seyeux, P. Marcus and M. Ritala, Corros. Sci., 2011, 53, 2168–2175 CrossRef.
- C. Verma, M. Quraishi, L. Olasunkanmi and E. E. Ebenso, RSC Adv., 2015, 5, 85417–85430 RSC.
- Z. Xingwen, G. Min, Z. Xianguang, J. Chunmei, Z. Xiangmei and Z. Ting, Corrosion Science and Protetion Technology, 2012, 24, 41–45 Search PubMed.
- J. Li, D. Chen, D. Zhang, Y. Wang, Y. Yu, L. Gao and M. Huang, Colloids Surf., A, 2018, 550, 145–154 CrossRef CAS.
- P. Singh and M. Quraishi, Measurement, 2016, 86, 114–124 CrossRef.
- C. Verma, L. O. Olasunkanmi, I. Obot, E. E. Ebenso and M. Quraishi, RSC Adv., 2016, 6, 53933–53948 RSC.
- K. Ansari, M. Quraishi and A. Singh, J. Assoc. Arab Univ. Basic Appl. Sci., 2017, 22, 45–54 Search PubMed.
- P. Singh, E. E. Ebenso, L. O. Olasunkanmi, I. Obot and M. Quraishi, J. Phys. Chem. C, 2016, 120, 3408–3419 CrossRef CAS.
- A. Döner, R. Solmaz, M. Özcan and G. Kardaş, Corros. Sci., 2011, 53, 2902–2913 CrossRef.
- N. K. Gupta, C. Verma, M. Quraishi and A. Mukherjee, J. Mol. Liq., 2016, 215, 47–57 CrossRef CAS.
- I. Radojčić, K. Berković, S. Kovač and J. Vorkapić-Furač, Corros. Sci., 2008, 50, 1498–1504 CrossRef.
- K. Khaled and A. El-Maghraby, Arabian J. Chem., 2014, 7, 319–326 CrossRef CAS.
- V. Srivastava, J. Haque, C. Verma, P. Singh, H. Lgaz, R. Salghi and M. Quraishi, J. Mol. Liq., 2017, 244, 340–352 CrossRef CAS.
- H. Lgaz, R. Salghi, S. Jodeh and B. Hammouti, J. Mol. Liq., 2017, 225, 271–280 CrossRef CAS.
- K. Khaled, Electrochim. Acta, 2010, 55, 6523–6532 CrossRef CAS.
- A. Mishra, C. Verma, H. Lgaz, V. Srivastava, M. Quraishi and E. E. Ebenso, J. Mol. Liq., 2018, 251, 317–332 CrossRef CAS.
- Z. Salarvand, M. Amirnasr, M. Talebian, K. Raeissi and S. Meghdadi, Corros. Sci., 2017, 114, 133–145 CrossRef CAS.
- S. K. Saha, M. Murmu, N. C. Murmu and P. Banerjee, J. Mol. Liq., 2016, 224, 629–638 CrossRef CAS.
- K. Khaled, J. Solid State Electrochem., 2009, 13, 1743–1756 CrossRef CAS.
Footnote |
| † Electronic supplementary information (ESI) available. See DOI: 10.1039/d0ra07595g |
|
| This journal is © The Royal Society of Chemistry 2021 |
Click here to see how this site uses Cookies. View our privacy policy here.  Open Access Article
 a,
Lukman O. Olasunkanmi
 ab,
Ekemini D. Akpan
 a,
Akram Alfantazic,
I. B. Obot
 d,
Chandrabhan Verma
 *d,
Amal M. Al-Mohaimeede,
Eno E. Ebensoaf and
M. A. Quraishi
 d
d


 is given by the following equation:54,55
 derived for INH-1, INH-2 and INH-3 interactions with metallic surface are presented in Table 6. Higher values of Kads obtained for INH-1, INH-2 and INH-3 suggest that they have strong adsorption ability. The range of the calculated values of the Gibb's free energy of adsorption suggest that INH-1, INH-2 and INH-3 adsorb by both physisorption and chemisorption.35,49,56 Furthermore, the relatively high negative values recorded for
  for the inhibitors showed that the adsorption on mild steel surface is spontaneous.

 calculated from the Langmuir adsorption isotherm plots for INH-1, INH-2 and INH-3 on mild steel substrate in 1 M HCl at 303 K
![[double bond, length as m-dash]](https://www.rsc.org/images/entities/char_e001.gif) O, –CN, –NH2, –CONH2 and –CO–CO–, indicating that these parts of the molecules are mainly involved in the electron donation (HOMO) and acceptance (LUMO). HOMO signifies the part(s) of the inhibitor molecules responsible for electron donation (to metallic d-orbitals) whereas LUMO signifies the part(s) of INH-1, INH-2 and INH-3 molecules responsible for the electron acceptance (from metallic d-orbitals).54,57–59 MEP study provides information about the regions related with electrophilic and nucleophilic reactions. Red-yellow regions on the INH-1, INH-2 and INH-3 molecules are responsible for electrophilic attacks, whereas blue and light blue regions are responsible for the nucleophilic attacks (Fig. 9 and 10). It is clearly seen that MEP also localized over the parts of molecules where HOMO and LUMO are located. Table 7 shows the list of selected reactivity parameters derived for INH-1, INH-2 and INH-3 in different studied conditions. It is important to mention that a higher EHOMO and lower ELUMO values are consistent with high protection efficiency. In the present investigation, observation of the results presented in Table 7 depicts that though ELUMO did not show any predicted trend, EHOMO values are increasing from INH-1 to INH-3. This is an indication that the electron donating ability of INH-1, INH-2 and INH-3 molecules is also increasing in the same sequence. Although, the reactivity parameters show different trends for INH-1, INH-2 and INH-3, lowest values of electronegativity for INH-3 showed that it is most potent to transfer its electron to the d-orbitals of the surface metallic atoms and offers strong bonding that comes in the form of its highest protection efficiency. The trends of DFT parameters in different studied conditions followed similar sequence.
O, –CN, –NH2, –CONH2 and –CO–CO–, indicating that these parts of the molecules are mainly involved in the electron donation (HOMO) and acceptance (LUMO). HOMO signifies the part(s) of the inhibitor molecules responsible for electron donation (to metallic d-orbitals) whereas LUMO signifies the part(s) of INH-1, INH-2 and INH-3 molecules responsible for the electron acceptance (from metallic d-orbitals).54,57–59 MEP study provides information about the regions related with electrophilic and nucleophilic reactions. Red-yellow regions on the INH-1, INH-2 and INH-3 molecules are responsible for electrophilic attacks, whereas blue and light blue regions are responsible for the nucleophilic attacks (Fig. 9 and 10). It is clearly seen that MEP also localized over the parts of molecules where HOMO and LUMO are located. Table 7 shows the list of selected reactivity parameters derived for INH-1, INH-2 and INH-3 in different studied conditions. It is important to mention that a higher EHOMO and lower ELUMO values are consistent with high protection efficiency. In the present investigation, observation of the results presented in Table 7 depicts that though ELUMO did not show any predicted trend, EHOMO values are increasing from INH-1 to INH-3. This is an indication that the electron donating ability of INH-1, INH-2 and INH-3 molecules is also increasing in the same sequence. Although, the reactivity parameters show different trends for INH-1, INH-2 and INH-3, lowest values of electronegativity for INH-3 showed that it is most potent to transfer its electron to the d-orbitals of the surface metallic atoms and offers strong bonding that comes in the form of its highest protection efficiency. The trends of DFT parameters in different studied conditions followed similar sequence.


![[thin space (1/6-em)]](https://www.rsc.org/images/entities/char_2009.gif)
![[thin space (1/6-em)]](https://www.rsc.org/images/entities/char_2009.gif)


