DOI:
10.1039/D0RA07727E
(Paper)
RSC Adv., 2021,
11, 5096-5106
Treatment of rhodamine B with cavitation technology: comparison of hydrodynamic cavitation with ultrasonic cavitation
Received
9th September 2020
, Accepted 12th January 2021
First published on 28th January 2021
Abstract
This paper presents the use of hydrodynamic cavitation and ultrasonic cavitation technologies for treating rhodamine B (RhB) in simulated wastewater. Various parameters of each technology that influence the RhB degradation rate were compared and optimized. The results showed that the optimal conditions for the hydrodynamic cavitation determined by the single-factor method were as follows: inlet pressure, 0.4 MPa; initial concentration, 10 mg L−1; reaction temperature, 30 °C; and pH value, 3. The RhB degradation rate was 38.7%. In addition, the optimal conditions for the ultrasonic cavitation determined by the response surface methodology were as follows: initial RhB concentration, 10 mg L−1; ultrasonic power, 850 W; ultrasonic time, 100 min; addition amount of H2O2, 0.6%; and pH value, 3. The RhB degradation rate was 84.06%. We also found that the degradation of RhB by both cavitation technologies conformed to the first-order kinetic reaction model. The rate constant of UC was 5.22 × 10⁻³ min−1 and that of HC was 4.35 × 10⁻³ min−1. The ultrasonic cavitation has a stronger cavitation effect than hydrodynamic cavitation.
1. Introduction
Due to increasing industrialization worldwide, organic compounds such as textile dyes, aromatic compounds, chlorinated hydrocarbons, and phenolic compounds are widely used in various industries, such as textiles, plastics, and cosmetics.1,2 During their production and use, about 10–15% of organic substances are discharged into the environment, in addition to a large amount of organic wastewater. The composition of this organic wastewater is complex, its structure is also very stable; thus, it is difficult to be degraded naturally. This leads to an increase of dye contaminant in wastewater,3 which can affect the growth of aquatic animals and plants, and disrupt the ecological balance of water, as the dye contaminant is carcinogenic and is toxic to organisms. This dye-contaminated wastewater can also affect the natural biological purification process of the environment.4,5 Therefore, the development of a large-scale, energy-saving method that can effectively and efficiently treat organic wastewater is the current research topic that has been receiving increasing attention.
At present, there are many traditional organic wastewater treatment methods, which can include microbial treatment method,6 activated carbon adsorption method,7 and membrane extraction method.8 Although these methods play important roles in water pollution control, they have low efficiency, cannot completely remove pollutants, can possibly generate secondary pollution, and have high energy consumption; therefore, they have a narrow application range. The cavitation process has received a great deal of attention from researchers due to its many advantages, such as simple process flow, mild reaction conditions, short treatment cycle, and environmental friendliness.9–11 Cavitation is described as the formation, growth, and collapse of bubbles in liquid media.12 It can usually be divided into ultrasonic cavitation (UC), hydrodynamic cavitation (HC), photocavitation, and particle cavitation.13 Studies have shown that the collapse of cavitation bubbles can generate local high temperature and local high-pressure environment in the liquid medium, accompanied by strong shock waves and high-speed jets, while simultaneously release a large amount of energy.13 This energy causes the water vapor inside the cavitation bubble to undergo a cracking reaction under high temperature and high pressure to produce highly reactive free radicals.14 The microjet formed by the collapse of the cavitation bubble allows these free radicals to enter the liquid phase and mix with the liquid, thereby oxidizing the organic pollutants into harmless substances; and treated dye wastewater is obtained as a result.
In recent years, cavitation technology has been widely used for the degradation of organic wastewater, purification of drinking water, hydrolysis of oils, and strengthening of biodiesel synthesis. Thanekar et al.15 have studied the treatment of naproxen (NAP) in wastewater with combined HC and oxidants (HC + O3). They found that the best HC + O3 pretreatment method can reduce chemical oxygen demand (COD) by 40%, and the sewage that is further treated with activated HC + O3 has reduced COD by about 89.5%. They also calculated the biodegradability index (BI) of untreated and HC + O3-treated wastewater, from which they found that the biodegradation index HC + O3-treated wastewater increased from 0.35 to 0.75; this indicates that HC and ozone pretreatment can improve biological oxidation. Zhang et al.3 have introduced the ultrasonic degradation of rhodamine B (RhB) using vortex scattering (which is the vortex that is generated by a high-speed stirrer) and studied the effects of different reaction vessels, initial RhB concentrations, stirring speeds, and ultrasonic frequencies on the RhB degradation rate. They observed that the best conditions were as follows: reaction vessel, three-necked flask; stirring speed, 700 rpm; initial concentration, 10 mg L−1; and ultrasonic frequency, 40 kHz. From these conditions, the RhB degradation rate reached 98% within 1 h. This study shows that the combined use of ultrasound and mechanical stirring can effectively degrade RhB in aqueous solutions.
In this work, we aim to compare the effects of UC and HC on RhB degradation and to find their optimal conditions. We prepared simulated wastewater using RhB as the contaminant and investigated the effects of UC and HC on the RhB degradation under different conditions. We also compared the rate constants of the two methods and determined their reaction orders.
2. Experimental
2.1 Reagents and instruments
Rhodamine B (RhB, C28H31ClN2O3, CAS: 81-88-9, analytical reagent (AR)) was purchased from Tianjin Fuyu Fine Chemical Co., Ltd. (China). Hydrogen peroxide (H2O2, 30%, CAS: 7722-84-1, AR) was purchased from Tianjin Zhiyuan Chemical Reagent Co., Ltd. (China). Sodium hydroxide (NaOH, CAS: 1310-73-2, AR) was purchased from Tianjin Yongsheng Fine Chemical Co., Ltd. (China). Sulfuric acid (H2SO4, CAS: 7664-93-9 AR) was obtained from Tianjin Third Chemical Reagent Factory (China). All reagents were diluted with deionized water.
Instruments used in the experiments included: an ultrasonic cell crusher (JY92-2D, Ningbo Xinzhi Biotechnology Co., Ltd.), an electronic balance (Model AL204, Mettler Toledo Instruments (Shanghai) Co., Ltd.), an ultraviolet-visible spectrophotometer (UV-2000, Shanghai Unico Instrument Co., Ltd.), a venturi tube (Chongqing Kubo Electromechanical Engineering Technology Co., Ltd.), and a pH meter (PHS-3C, Shanghai INESA Scientific Instrument Co., Ltd.).
2.2 Ultrasonic cavitation process
The ultrasonic cavitation device is shown in Fig. 1. The device consists of a controller, an ultrasonic transducer, a horn, and a temperature indicator. Ultrasonic cavitation was produced using a low-frequency (20 kHz) ultrasonic processor. The tip diameter of the transducer was 40 mm, the maximum power consumption was 1200 W, and the horn model was φ20. The horn was placed at a 3 cm depth in a RhB solution. All experiments were performed in 250 mL glass beakers.
 |
| | Fig. 1 Schematic diagram of ultrasonic cavitation device. | |
2.3 Hydrodynamic cavitation process
The hydrodynamic cavitation device is shown in Fig. 2. The device consists of a 4 L water tank, a centrifugal pump (operated at a speed of 2900 rpm and a power of 3.0 kW), a regulating valve, a venturi tube, a pressure gauge, a thermocouple thermometer, a flow meter, and a cold trap. The dimensions of the Chinese muri tube are shown in Fig. 3. Circulation of the RhB solution was driven by a gear pump until the reaction was complete.
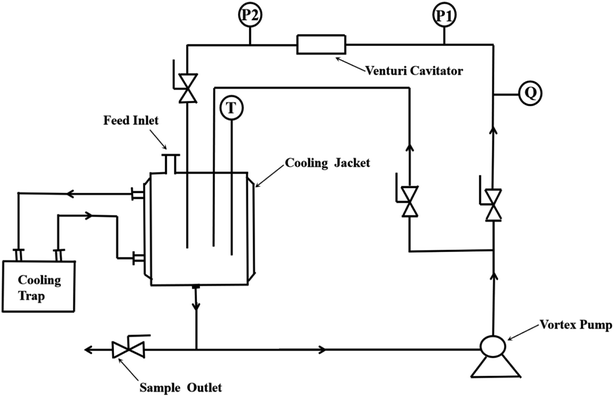 |
| | Fig. 2 Hydraulic cavitation device. | |
 |
| | Fig. 3 Venturi tube size. | |
3. Results and discussion
3.1 Effect of various ultrasonic cavitation conditions
3.1.1 Response surface optimization. The impacts of three factors, including ultrasonic power, ultrasonic time, and initial RhB concentration, on the degradation rate (the response) are shown in Table 1. The use of the Box-Behnken center combination design (in Design Expert software) to optimize the UC conditions is shown in Table 2.
Table 1 Response surface experimental factor level table
| Level |
Factor |
| A (initial concentration, mg L−1) |
B (ultrasonic power, W) |
C (ultrasound time, min) |
| 1 |
5 |
600 |
60 |
| 2 |
10 |
800 |
90 |
| 3 |
15 |
1000 |
120 |
Table 2 Responsive surface design
| No. |
A (initial concentration, mg L−1) |
B (ultrasonic power, W) |
C (ultrasound time, min) |
Degradation rate, % |
| 1 |
5 |
600 |
90 |
10.66 |
| 2 |
5 |
800 |
60 |
18.71 |
| 3 |
5 |
800 |
120 |
22.87 |
| 4 |
5 |
1000 |
90 |
23.94 |
| 5 |
10 |
800 |
90 |
36.04 |
| 6 |
10 |
1000 |
60 |
17.53 |
| 7 |
10 |
1000 |
120 |
25.17 |
| 8 |
10 |
800 |
90 |
31.3 |
| 9 |
10 |
800 |
90 |
36.86 |
| 10 |
10 |
800 |
90 |
29.03 |
| 11 |
10 |
600 |
60 |
6.26 |
| 12 |
10 |
600 |
120 |
20.67 |
| 13 |
10 |
800 |
90 |
32.4 |
| 14 |
15 |
800 |
60 |
6.81 |
| 15 |
15 |
1000 |
90 |
12.24 |
| 16 |
15 |
800 |
120 |
20.27 |
| 17 |
15 |
600 |
90 |
7.48 |
The contour map between the response value and other factors, and the three-dimensional response surface map can be used to visually show the influence of the interaction between various factors on the RhB degradation rate. The degree of influence of the two interacting factors is determined by the density of the contour lines.16
The effect of the interaction between ultrasonic power and initial RhB concentration on RhB degradation rate is shown in Fig. 4. As can be seen from Fig. 4(a), the ultrasonic power along the contour line was dense, and the effect of the ultrasonic power on the RhB degradation rate was greater than that of the initial RhB concentration. As can be seen from Fig. 4(b), when the ultrasonic power was constant at a certain range, the RhB degradation rate first increased and then decreased with the increase of initial RhB concentration. Similarly, when the initial concentration was kept unchanged at a certain range, the RhB degradation rate first increased and then decreased with the increase of ultrasonic power.
 |
| | Fig. 4 The effect of the interaction between ultrasonic power and initial concentration on degradation. (a) Respond the surface cloud chart; (b) contour map. | |
The effect of the interaction between ultrasonic time and initial RhB concentration on RhB degradation rate is shown in Fig. 5. According to Fig. 5(a), the contour line along the ultrasonic time was dense, and the effect of the ultrasonic time on the RhB degradation rate was greater than that of the initial RhB concentration. As illustrated in Fig. 5(b), when the ultrasonic time was kept constant at a certain range, the RhB degradation rate first increased and then decreased with the increase of the initial concentration. Likewise, when the initial concentration was kept constant at a certain range but with increasing ultrasound time, the RhB degradation rate also increased first and decreased thereafter.
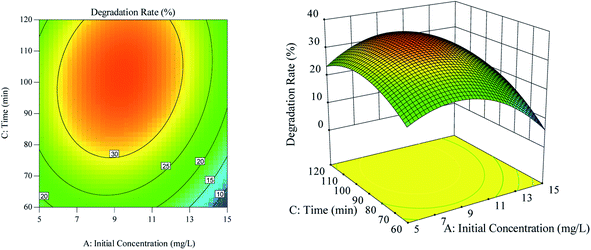 |
| | Fig. 5 The effect of the interaction of ultrasound time and initial concentration on degradation rate. (a) Respond the surface cloud chart; (b) contour map. | |
The effect of the interaction between ultrasonic time and ultrasonic power on the RhB degradation rate is shown in Fig. 6. As can be seen in Fig. 6(a), the ultrasonic time along the contour line was dense, and the ultrasonic time had a greater impact on the RhB degradation rate than the ultrasonic power. As can be observed in Fig. 6(b), when the ultrasonic time was constant at a certain range, the RhB degradation rate first showed an increasing trend, but later showed a decreasing trend, as the ultrasonic power was increased. The RhB degradation rate also showed the same trend when the constant ultrasonic power was kept constant but the ultrasonic time was increased.
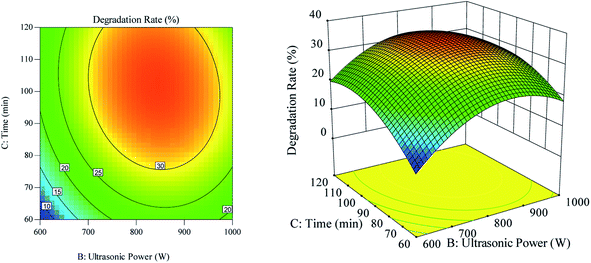 |
| | Fig. 6 The effect of the interaction of ultrasound time and ultrasound power on degradation rate. (a) Respond the surface cloud chart; (b) contour map. | |
The contour lines and three-dimensional surface graphs were drawn, and the multiple regression analysis of the experimental data was performed. The obtained polynomial regression equation of the model is as follows:
| Y = −263.316 + 7.490A + 0.454B + 1.449C − 2.130 × 10⁻³AB + 0.016AC − 2.821 × 10⁻⁴BC − 0.396A2 − 2.413 × 10⁻⁴B2 − 6.741 × 10⁻⁴C2 |
where
Y is the degradation rate of RhB,
A is the initial concentration of RhB,
B is the ultrasonic power, and
C is the ultrasonic time. The calculation using the model showed that the best conditions were: initial RhB concentration, 9.17 mg L
−1; ultrasonic power, 841.38 W; and ultrasonic time, 100.42 min. For convenience, the experiment was operated at the following conditions: initial concentration of RhB, 10 mg L
−1; ultrasonic power, 850 W; and ultrasonic time, 100 min.
The results from analysis of variance of the established model are shown in Table 3. The F value of the model was 26.35 with P < 0.01, indicating that the model is highly significant. When the lack of fit had P > 0.05, it indicates that the regression equation fits well with the experimental results. The decision coefficient of the model was R2 = 0.9713, which indicates that the model well-fits and can accurately predict the RhB degradation rate.
Table 3 Regression model analysis of variance
| Variable source |
Sum of square |
df |
MS |
F |
P |
|
| Model |
1565 |
9 |
173.84 |
26.35 |
0.0001 |
Significant |
| A |
107.9 |
1 |
107.90 |
16.35 |
0.0049 |
|
| B |
142.8 |
1 |
142.89 |
21.66 |
0.0023 |
|
| C |
196.7 |
1 |
196.71 |
29.81 |
0.0001 |
|
| AB |
18.15 |
1 |
18.148 |
2.75 |
0.1412 |
|
| AC |
21.62 |
1 |
21.622 |
3.28 |
0.1132 |
|
| BC |
11.46 |
1 |
11.458 |
1.74 |
0.2291 |
|
| A2 |
412.2 |
1 |
412.20 |
62.47 |
<0.0001 |
|
| B2 |
392.2 |
1 |
392.24 |
59.45 |
0.0001 |
|
| C2 |
150.0 |
1 |
154.97 |
23.49 |
0.0019 |
|
| Residual |
46.19 |
7 |
6.598 |
|
|
|
| Lack of fit |
3.115 |
3 |
1.038 |
0.10 |
0.9580 |
Not significant |
| Errors |
43.07 |
4 |
10.768 |
|
|
|
| Sum |
1611 |
16 |
|
|
|
|
| R2 = 0.9713, R2Adj = 0.9345 |
The linear coefficients (A, B, C) and the quadratic coefficients (A2, B2, C2) of the model had P < 0.05, indicating that the model has a significant impact on the degradation rate of RhB. By contrast, other coefficients of the model have P > 0.05, indicating that they have no significant impact on the degradation rate of RhB. The influence of the three factors on the degradation rate of RhB could be ranked in the following order: ultrasonic time > ultrasonic power > initial RhB concentration.
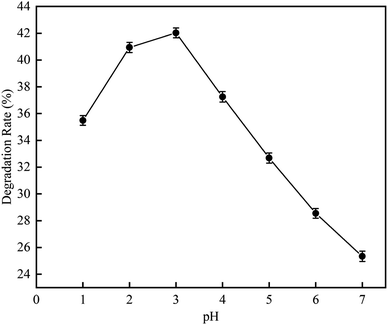
3.1.2 Effect of pH on RhB degradation rate. This experiment was carried out to investigate the RhB degradation rate by the cavitation reaction at a pH range of 1 to 7. The experiment was conducted using RhB solution at a mass concentration of 10 mg L−1 (volume = 250 mL) under the following conditions: ultrasonic frequency, 20 kHz; ultrasonic power, 850 W; and ultrasonic time, 100 min. The result is shown in Fig. 7.
 |
| | Fig. 7 The effect of pH on degradation rate with ultrasonic cavitation. | |
As can be seen in Fig. 7, when the pH was increased from 1 to 7, the RhB degradation rate first increased and then decreased. At pH 3, the RhB degradation rate was highest with a value of 42.03%. This suggests that the RhB degradation by the cavitation reaction is favorable under acidic conditions, which is probable due to that acidic conditions could promote the dissociation of water into HO˙ and H˙. As the pH value increases, the surface tension of RhB solution becomes significantly increase. When the pH value is 3, the maximum surface tension reaches 83.69 mN m−1. However, as the pH value was increased from 4 to 7, the surface tension decreased. The largest surface tension caused the number of cavitation bubbles produced by cavitation to decrease, but the size of grown bubble was increased and the energy released by the bubble collapse was enhanced. The number of HO˙ released was large. However, the excessive HO˙ could self-quench, affecting the degradation rate of rhodamine B. With the increase of H+, the surface tension decreased slightly, but the self-quenching effect of HO˙ was inhibited by H+. Therefore, optimal pH value could obtain higher rhodamine B degradation rate. According to the literature, HO˙ produced by the cavitation under acidic conditions has high oxidation capacity.17
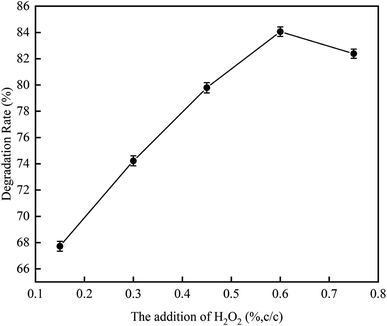
3.1.3 Effect of addition amount of H2O2 on RhB degradation rate. This experiment conditions were the same as 3.1.2. The effect of addition amounts (v/v) of H2O2 (0.15%, 0.3%, 0.45%, 0.60%, and 0.75%) on RhB degradation rate was investigated. The result is shown in Fig. 8. The RhB degradation rate first showed an increasing trend and then showed a decreasing trend. When the addition amount of H2O2 was 0.6%, the RhB degradation rate was highest with a value of 84.06%. The decomposition of H2O2 highly active HO˙ after it was added into the UC process is as follows:| |
 | (1-2) |
| |
 | (1-3) |
 |
| | Fig. 8 The effect of H2O2 addition on degradation rate with ultrasonic cavitation. | |
When the addition amount of H2O2 is low, the UC promotes the decomposition of H2O and H2O2 to produce HO˙, which strengthen the oxidative degradation of RhB. However, when the addition amount of H2O2 is too high, a large amount of HO˙ are formed, causing self-promoting effect of free radicals to occur, which can in turn weaken the oxidative degradation of RhB, thus reducing its degradation rate. Based on the results, we concluded that the optimal addition amount of H2O2 is 0.6%.18
3.2 Effect of various hydrodynamic cavitation conditions
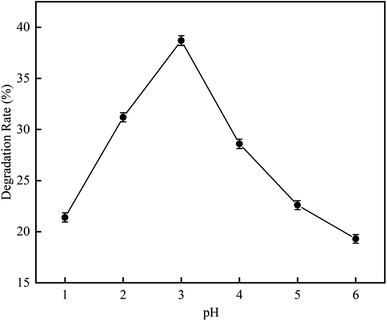
3.2.1 Effect of pH on RhB degradation rate. This experiment was aimed to investigate the RhB degradation rate by cavitation reaction. It was carried out at a pH range of 1 to 6, a temperature of 25 °C, initial RhB concentration of 10 mg L−1, a volume of 4 L, an inlet pressure of 0.4 MPa, and a treatment time of 120 min.As depicted in Fig. 9, when the pH was increased from 1 to 6, the RhB degradation rate first had an increasing trend and later had a decreasing trend. The RhB degradation rate was highest at pH 3 with a value of 38.7%. This may be due to that more vacuoles are produced under acidic conditions19,20 that can dissociate H2O to produce more HO˙, causing higher oxidation activity so that the degradation of RhB in wastewater is increased.21 Patil et al.17 have reported similar conclusions from an experiment on hydrodynamic cavitation degradation of imidacloprid. In their study, they found that the degradation of pollutants is best under acidic conditions because at such conditions, the oxidation potential and the generation rate of hydroxyl radicals are high. At pH 3.0, the degradation rate that they observed is also highest with a value of 23.85%. Saharan et al.20 have studied the effect of cavitation reaction on the decolorization rate of Acid Red 88 dye at various pH values from pH 2 to pH 11. They observed that the decolorization rate increases with decreasing pH.
 |
| | Fig. 9 The effect of pH on degradation rate with hydrodynamic cavitation. | |
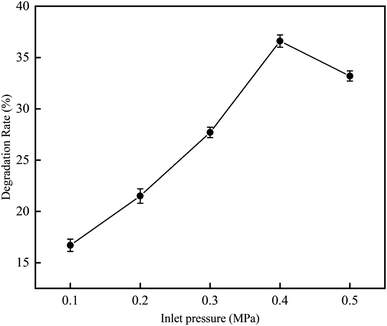
3.2.2 Influence of inlet pressure on RhB degradation rate. This experiment was conducted to investigate the degradation rate of RhB by cavitation reaction at various inlet pressures from 0.1 to 0.5 MPa. The experiment was carried out at a temperature of 25 °C, an initial RhB concentration of 10 mg L−1, a volume of 4 L, a pH value of 3, and a treatment time of 120 min.As can be seen in Fig. 10, when the inlet pressure was increased from 0.1 to 0.5 MPa, the RhB degradation rate first increased and then decreased. The results show that the supercavitation phenomenon occurs under the optimal pressure, and the bubbles grow fully in the downstream of the contraction of venturi tube. When the downstream pressure gradually recovers, the vaporized vacuoles collapse, generating jets and HO˙. When the operating pressure is higher than the appropriate pressure, a large number of cavitation bubbles will fill the downstream of venturi tube, and high-speed jet will be generated at the exit position. Cavitation collapse will be affected, and HO˙ released will be reduced. The cavitation is then accumulated in the downstream area of the venturi and form cavitation clouds;22 as a result, the collapse of the cavitation bubble is relaxed, causing the degree of cavitation to decrease. Jawale et al.23 have reported similar observations in their cavitation experiment on degradation of potassium thiocyanate. In their work, they found that when the pressure is 0.4 MPa, the degradation rate reaches the maximum value, which is 18.5%; but when the pressure continues to increase, the degradation rate starts to decrease. Bagal et al.24 have also studied the degradation of 2,4-dinitrophenol at inlet pressures of 0.3–0.6 MPa, and they found that the inlet pressure that can best degrade 2,4-dinitrophenol is 0.4 MPa.
 |
| | Fig. 10 The effect of inlet pressure on degradation rate with hydrodynamic cavitation. | |
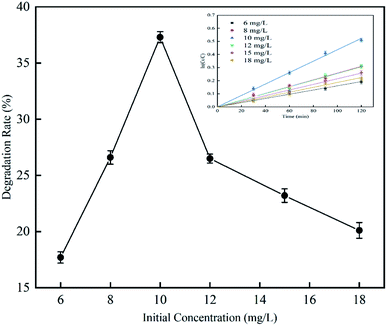
3.2.3 Effect of initial concentration on RhB degradation rate. This experiment was performed to investigate the effect of cavitation reaction on RhB degradation rate at initial RhB concentrations from 6 to 18 mg L−1. The experiment was conducted at a temperature of 25 °C, an inlet pressure of 0.4 MPa, a volume of 4 L, a pH value of 3, and a treatment time of 120 min. According to the results (Fig. 11), with the increase of the initial RhB concentration, the RhB degradation rate first increased and then decreased. The RhB degradation rate was highest with a value of 37.3% when the initial RhB concentration was 10 mg L−1. When the initial RhB concentration was greater than 10 mg L−1, the RhB degradation rate gradually decreased. The reason why the degradation of RhB slowed down at high initial RhB concentrations maybe because of that the cavitation may occur at the cavity-solution interface and in the non-volatile compounds,25 rather than in the inside of the cavity. In general, when the initial concentration is high, there should be many molecules around the cavity; but due to the small area of the gas–liquid interface, the molecules around the cavity may not be able to react with free radicals and are therefore degraded.26 For this reason, we observed that as the initial concentration increased, the RhB degradation rate gradually decreased. Rajoriya et al.27 have observed the same trend in an experiment on degradation of rhodamine 6G by HC. Patil et al.17,28 have also observed that the degradation rate of imidacloprid and methyl parathion decreases with the increase of their initial concentrations.
 |
| | Fig. 11 The effect of initial concentration on degradation rate with hydrodynamic cavitation. | |
3.2.4 Effect of final reaction temperature on RhB degradation rate. This experiment was carried out to investigate the effect of the cavitation reaction temperature on the RhB degradation rate. The temperature was varied from 16–60 °C, while other conditions were kept constant as follows: volume, 4 L; initial RhB concentration, 10 mg L−1; pH value, 3; and treatment time, 120 min.According to the results illustrated in Fig. 12, as the temperature increased, the RhB degradation rate first increased and then decreased. The RhB degradation rate was highest with a value of 38.5% when the reaction temperature was 30 °C. The reason for this maybe that at high temperatures, the number of cavitation bubbles increases, and the liquid vapor pressure and the vapor content in the cavitation bubbles also increase. However, when the temperature is too high, the water vapor can fill up the cavitation bubbles, generating the implosion phenomenon, resulting in the decrease in cavitation efficiency. When the temperature was lower than 30 °C, the RhB degradation rate increased with the increase of temperature, which is due to the increase of the number of cavitation bubbles. When the temperature was higher than 30 °C, the RhB degradation rate was decreased due to low cavitation efficiency. A similar conclusion has also been reported by Barik et al.29 from a study on the degradation of p-chloro-o-aminophenol. In their report, they described that the degradation rate of 4C2AP increases with the increase of temperature until reaching the optimal temperature, which is 35 °C; and at this temperature, the degradation rate is 24.6%. However, the degradation rate decreases when the temperature further increases. Braeutigam et al.30 have studied the degradation of benzene and reported similar trend. Their results also showed that the optimal temperatures were 35 °C. A study using HAC technology to degrade organic micro-pollutants has also reported the optimal temperature of lower than 35 °C. This study also described that when the temperature exceeds 35 °C, the content of generated hydroxyl radicals decreases.31
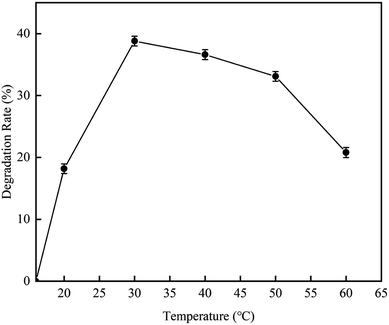 |
| | Fig. 12 The effect of temperature on degradation rate with hydrodynamic cavitation. | |
3.3 Kinetic studies
Upon the treatment with two different methods (UC and HC), the concentration of L was measured at different treatment times, and the kinetics of RhB degradation by cavitation reaction was analyzed. The first-order dynamics model was established as follows:where C0 is the initial concentration, C is the concentration at time t, and K is the rate constant. The ln(C0/C) was plotted against time t for up to 120 min, as shown in Fig. 13. Based on the plot, the R2 values of the two treatment methods were above 0.99, and the data well fitted with the first-order kinetic reaction model. The rate constant K for the two different treatment methods is shown in Table 4. The rate constant K of UC was greater than that of HC, suggesting that UC has a stronger cavitation effect than HC; however, HC can more easily be scaled up to the industrial level compared to UC.32–34
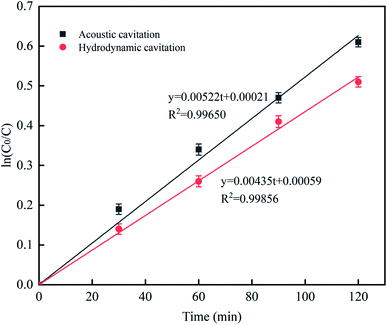 |
| | Fig. 13 The effect of different processing methods on the rate constant. | |
Table 4 Two different processing methods rate constant k
| Approach |
K (min−1) |
R2 |
| Ultrasonic cavitation |
5.22 × 10⁻³ |
0.99650 |
| Hydraulic cavitation |
4.35 × 10⁻³ |
0.99856 |
3.4 The energy utilization calculation
The energy utilization calculation refers to Patil and Pandit.35
3.4.1 Energy utilization of ultrasonic cavitation at different power.
| Electric energy input in horn for 100 min = actual power of horn × irradiation time × % amplitude |
=850 J s−1 × 100 min × 60 s × 0.57 = 2![[thin space (1/6-em)]](https://www.rsc.org/images/entities/char_2009.gif) 907 907![[thin space (1/6-em)]](https://www.rsc.org/images/entities/char_2009.gif) 000 J 000 J |
| Processed volume = 250 mL = 250 × 10−6 m3 |
| Energy utilized = electric energy input in horn for 100 min per processed volume |
The rest of the calculation process was as above, and the results were shown in Table 5. With the increase of power, the energy utilization was gradually increased. Considering the change of energy saving and degradation rate, 850 W is selected as the appropriate power for this experiment. The utilization of hydraulic cavitation energy is lower than that of ultrasonic cavitation energy under suitable conditions.
Table 5 Energy utilization of ultrasonic cavitation at different power
| Power (W) |
600 |
800 |
850 |
1000 |
| Energy utilized (kJ m−3) |
3.6 × 10⁶ |
9.6 × 10⁶ |
1.1628 × 10⁷ |
1.8 × 10⁷ |
3.4.2 Energy utilization of hydrodynamic cavitation.
| Electric energy input by pump in 2 h |
| =3 KW = 3000 J s−1 × 2 h × 3600 s |
=21![[thin space (1/6-em)]](https://www.rsc.org/images/entities/char_2009.gif) 600 600![[thin space (1/6-em)]](https://www.rsc.org/images/entities/char_2009.gif) 000 J 000 J |
=21![[thin space (1/6-em)]](https://www.rsc.org/images/entities/char_2009.gif) 600 kJ 600 kJ |
| Process volume = 4 L = 4 × 10 m−3 |
| Energy utilized = electric energy input by pump in 2 h per process volume |
=21![[thin space (1/6-em)]](https://www.rsc.org/images/entities/char_2009.gif) 600 600![[thin space (1/6-em)]](https://www.rsc.org/images/entities/char_2009.gif) 000 J/4 × 10 m−3 000 J/4 × 10 m−3 |
4. Conclusion
In summary, we employed single factor method and response surface design method to investigate the influence of UC and HC on the degradation rate of RhB in simulated wastewater. The results showed that both UC and HC could effectively degrade RhB in simulated wastewater. Under the optimal UC conditions for the degradation of RhB, the degradation rate was 84.06%. And the optimal HC conditions, the degradation rate was 38.7%. The degradation reaction by both methods followed the first-order kinetic model. The rate constant of UC was 5.22 × 10⁻³ min−1 and that of HC was 4.35 × 10⁻³ min−1. The rate constant of UC is higher than that of HC. The energy utilization of UC also is higher than the HC for solution per unit volume.
Conflicts of interest
There are no conflicts to declare.
Acknowledgements
We thank the Natural Science Foundation of Xinjiang Uygur Autonomous Region of China (2018D01B31), Natural Science Youth Project in Universities and Colleges of the Autonomous Region (XJEDU2019Y033), Dr Tianchi of the ‘‘Hundred Young Doctors Introduction Program” of the Autonomous Region (BS2017005) and Xinjiang Normal University “13th five-year” University-level Key Disciplines Chemical Bidding Project funding (17SDKD0804) for financial support.
References
- C. Worathitanon, K. Jangyubol and P. Ruengrung, High performance visible-light responsive Chl-Cu/ZnO catalysts for photodegradation of rhodamine B, Appl. Catal., B, 2019, 241, 359–366 CrossRef CAS.
- C. Lops, A. Ancona and K. Di Cesare, Sonophotocatalytic degradation mechanisms of Rhodamine B dye via radicals generation by micro- and nano-particles of ZnO, Appl. Catal., B, 2019, 243, 629–640 CrossRef CAS PubMed.
- X. G. Zhang, C. C. Hao and C. Ma, Studied on sonocatalytic degradation of Rhodamine B in aqueous solution, Ultrason. Sonochem., 2019, 58, 104691 CrossRef CAS PubMed.
- J. Hu, P. Zhang and W. An, In-situ Fe-doped g-C3N4 heterogeneous catalyst via photocatalysis-Fenton reaction with enriched photocatalytic performance for removal of complex wastewater, Appl. Catal., B, 2019, 245, 130–142 CrossRef CAS.
- Y. Gao, S. Q. Deng and X. Jin, The construction of amorphous metal-organic cage-based solid for rapid dye adsorption and time-dependent dye separation from water, Chem. Eng. J., 2019, 357, 129–139 CrossRef CAS.
- B. Kokabian, V. G. Gude and R. Smith, Evaluation of anammox biocathode in microbial desalination and wastewater treatment, Chem. Eng. J., 2018, 342, 410–419 CrossRef CAS.
- Z. Heidarinejad, O. Rahmanian and M. Fazlzadeh, Enhancement of methylene blue adsorption onto activated carbon prepared from Date Press Cake by low frequency ultrasound, J. Mol. Liq., 2018, 264, 591–599 CrossRef CAS.
- J. D. Liu, J. X. Xiong and C. Tian, The degradation of methyl orange and membrane fouling behavior in anaerobic baffled membrane bioreactor, Chem. Eng. J., 2018, 338, 719–725 CrossRef CAS.
- P. Thanekar, M. Panda and P. R. Gogate, Degradation of carbamazepine using hydrodynamic cavitation combined with advanced oxidation processes, Ultrason. Sonochem., 2018, 40, 567–576 CrossRef CAS PubMed.
- A. L. Prajapat and P. R. Gogate, Depolymerization of carboxymethyl cellulose using hydrodynamic cavitation combined with ultraviolet irradiation and potassium persulfate, Ultrason. Sonochem., 2019, 51, 258–263 CrossRef CAS PubMed.
- Y. Tao, J. Cai, X. Huai and B. Liu, A novel antibiotic wastewater degradation technique combining cavitating jets impingement with multiple synergetic methods, Ultrason. Sonochem., 2018, 44, 36–44 CrossRef CAS PubMed.
- C. H. Yi, Q. Q. Lu and Y. Wang, Degradation of organic wastewater by hydrodynamic cavitation combined with acoustic cavitation, Ultrason. Sonochem., 2018, 43, 156–165 CrossRef CAS PubMed.
- M. Franke, P. Braeutigam and Z. L. Wu, Enhancement of chloroform degradation by the combination of hydrodynamic and acoustic cavitation, Ultrason. Sonochem., 2011, 18, 888–894 CrossRef CAS PubMed.
- Y. T. Didenko and K. S. Suslick, The energy efficiency of formation of photons, radicals and ions during single-bubble cavitation, Nature, 2002, 418, 394–397 CrossRef CAS PubMed.
- P. Thanekar, S. Garg and P. R. Gogate, Hybrid treatment strategies based on hydrodynamic cavitation, advanced oxidation processes, and aerobic oxidation for efficient removal of naproxen, Ind. Eng. Chem. Res., 2020, 59, 4058–4070 CrossRef CAS.
- H. G. Hu, Q. L. Zhao and Z. C. Pang, Optimization ex-traction, characterization and anticancer activities of polysaccharides from mango pomace, Int. J. Biol. Macromol., 2018, 9, 1314–1325 CrossRef PubMed.
- P. N. Patil, S. D. Bote and P. R. Gogate, Degradation of imidacloprid using combined advanced oxidation processes based on hydrodynamic cavitation, Ultrason. Sonochem., 2014, 21, 1770–1777 CrossRef CAS PubMed.
- S. R. Jadhava, D. V. Pinjarib and D. R. Saini, Intensification of degradation of methomyl (carbamate group pesticide) by using the combination of ultrasonic cavitation and process intensifying additives, Ultrason. Sonochem., 2016, 31, 135–142 CrossRef PubMed.
- X. Wang and Y. Zhang, Degradation of alachlor in aqueous solution by using hydrodynamic cavitation, J. Hazard. Mater., 2009, 161, 202–207 CrossRef CAS PubMed.
- V. K. Saharan, A. B. Pandit and P. S. Satish Kumar, Hydrodynamic cavitation as an advanced oxidation technique for the degradation of acid Red 88 Dye, Ind. Eng. Chem. Res., 2012, 51, 1981–1989 CrossRef CAS.
- A. A. Pradhan and P. R. Gogate, Degradation of p-nitrophenol using acoustic cavitation and Fenton chemistry, J. Hazard. Mater., 2010, 173, 517–522 CrossRef CAS PubMed.
- V. K. Saharan, M. P. Badve and A. B. Pandit, Degradation of reactive red 120 dye using hydrodynamic cavitation, Chem. Eng. J., 2011, 178, 100–107 CrossRef CAS.
- H. Jawale and P. R. Gogate, Novel approaches based on Hydrodynamic Cavitation for treatment of wastewater containing potassium thiocyanate, Ultrason. Sonochem., 2018, 52, 214–223 CrossRef.
- M. V. Bagal and P. R. Gogate, Degradation of 2,4-dinitrophenol using a combination of hydrodynamic cavitation, chemical and advanced oxidation processes, Ultrason. Sonochem., 2013, 20, 1226–1235 CrossRef CAS PubMed.
- I. Hua and M. R. Hoffmann, Kinetics and mechanism of the sonolytic degradation of CCl4: intermediates and byproducts, Environ. Sci. Technol., 1996, 30, 864–871 CrossRef CAS.
- M. Geng and S. M. Thagard, The effects of externally applied pressure on the ultrasonic degradation of Rhodamine B, Ultrason. Sonochem., 2013, 20, 618–625 CrossRef CAS PubMed.
- S. Rajoriya, S. Bargole and V. K. Saharan, Degradation of a cationic dye (Rhodamine 6G) using hydrodynamic cavitation coupled with other oxidative agents: reaction mechanism and pathway, Ultrason. Sonochem., 2017, 34, 183–194 CrossRef CAS PubMed.
- P. N. Patil and P. R. Gogate, Degradation of methyl parathion using hydrodynamic cavitation: effect of operating parameters and intensification using additives, Sep. Purif. Technol., 2012, 95, 172–179 CrossRef CAS.
- A. J. Barik and P. R. Gogate, Degradation of 4-chloro 2-aminophenol using a novel combined process based on hydrodynamic cavitation, UV photolysis and ozone, Ultrason. Sonochem., 2015, 30, 70–78 CrossRef PubMed.
- P. Braeutigam, Z. L. Wu and A. Stark, Degradation of BTEX in Aqueous Solution by Hydrodynamic Cavitation, Chem. Eng. Technol., 2010, 32, 745–753 CrossRef.
- P. Braeutigam, Degradation of Organic Micropollutants by Hydrodynamic and/or Acoustic Cavitation, Springer, Singapore, 2016 Search PubMed.
- G. V. Ambulgekar, S. D. Samant and A. B. Pandit, Oxidation of alkylarenes to the corresponding acids using aqueous potassium permanganate by hydrodynamic cavitation, Ultrason. Sonochem., 2004, 11, 191–196 CrossRef CAS PubMed.
- P. R. Gogate and G. S. Bhosale, Comparison of effectiveness of acoustic and hydrodynamic cavitation in combined treatment schemes for degradation of dye wastewaters, Chem. Eng. Process., 2013, 71, 59–69 CrossRef CAS.
- M. Franke, B. Ondruschka and P. Braeutigam, Hydrodynamic-acoustic-cavitation for biodiesel synthesis, Int. Proc. Chem., Biol. Environ. Eng., 2014, 78, 23–30 Search PubMed.
- M. N. Patil and A. B. Pandit, Cavitation-a novel technique for making stable nanosuspensions, Ultrason. Sonochem., 2007, 14, 519–530 CrossRef CAS PubMed.
|
| This journal is © The Royal Society of Chemistry 2021 |
Click here to see how this site uses Cookies. View our privacy policy here.  Open Access Article
 *,
Ying Zhu,
Na Lu,
Xin Wang and
Zhi Su


![[thin space (1/6-em)]](https://www.rsc.org/images/entities/char_2009.gif) 907
907![[thin space (1/6-em)]](https://www.rsc.org/images/entities/char_2009.gif) 000 J
000 J![[thin space (1/6-em)]](https://www.rsc.org/images/entities/char_2009.gif) 600
600![[thin space (1/6-em)]](https://www.rsc.org/images/entities/char_2009.gif) 000 J
000 J![[thin space (1/6-em)]](https://www.rsc.org/images/entities/char_2009.gif) 600 kJ
600 kJ![[thin space (1/6-em)]](https://www.rsc.org/images/entities/char_2009.gif) 600
600![[thin space (1/6-em)]](https://www.rsc.org/images/entities/char_2009.gif) 000 J/4 × 10 m−3
000 J/4 × 10 m−3


