 Open Access Article
Creative Commons Attribution 3.0 Unported Licence
Phonon spectrum and thermoelectric properties of square/octagon structure of bismuth monolayer
C. Y.
Wu
ab,
X. L.
Li
a,
J. C.
Han
d,
H. R.
Gong
 *b and
S. F.
Zhou
c
aDepartment of Educational Science, Hunan First Normal University, Changsha, Hunan 410205, China
bState Key Laboratory of Powder Metallurgy, Central South University, Changsha, Hunan 410083, China. E-mail: gonghr@csu.edu.cn
cInstitute of Advanced Wear & Corrosion Resistant and Functional Materials, Jinan University, Guangzhou 510632, China
dDepartment of Mechanical Engineering and Materials Science, University of Pittsburgh, Pittsburgh, Pennsylvania 15213, USA
First published on 27th January 2021
Abstract
First-principles calculation and Boltzmann transport theory have been combined to comparatively investigate the band structure, phonon spectrum, lattice thermal conductivity, electronic transport property, Seebeck coefficient, and figure of merit of square/octagon (s/o)-bismuth monolayer. Calculations reveal that the thermoelectric properties of s/o-bismuth monolayer are better than that of β-bismuth monolayer, which should be mainly due to the low lattice thermal conductivity and weakened coupling of electrons and phonons. It is also found that the phonon frequency and group velocity could play dominant roles in determining the magnitude of the lattice thermal conductivity of s/o-bismuth monolayer. Furthermore, the Seebeck coefficient and figure of merit of s/o-bismuth monolayer are higher than those of β-bismuth monolayer. The derived results are in good agreement with other theoretical results in the literature, and could provide a deep understanding of thermoelectric properties of the bismuth monolayer materials.
1. Introduction
Thermoelectric materials have attracted extraordinary scientific and technological interests during the past decades owing to their unique transport properties and potential applications for power generators, cooling devices, and sensors.1,2 Specifically, the unusual electronic structure of the weak overlap and high mobility owing to the highly anisotropic electron ellipsoids of bismuth (Bi), resulting from its highly anisotropic electron ellipsoids, makes it one of the most potential thermoelectric materials.3 The properties of thermoelectric materials can be quantified using the dimensionless thermoelectric figure of merit according to the following formula4 | (1) |
Recently, low dimensionality, as one of the most effective strategies, has been proposed to achieve high thermoelectric performance by tuning band structure and decreasing the lattice thermal conductivity due to the quantum size effects.8 Thus, there is an explosive growth of interest for the exploration of two-dimensional (2D) materials of bismuth monolayers, i.e., α (rectangular of interunit Bi–Bi bond), β (hexagon of interunit Bi–Bi bond), γ-bismuth (rectangular of interunit Bi–Bi bond), δ-bismuth (rectangular of interunit Bi–Bi bond), ε (square of interunit Bi–Bi bond), s/o (square/octagon Bi ring), ξ (square of interunit Bi–Bi bond), η (pentagon of interunit Bi–Bi bond), θ (pentagon of interunit Bi–Bi bond), and ι (hexagon of interunit Bi–Bi bond),9–12 which potentially have suitable electronic and phonon structures and good thermoelectric properties.13 In particular, s/o-bismuth monolayer, which consists of a buckled square and octagon ring lattice, has a suitable band gap (0.34 eV) as well as is thermally stable for applications in the fields of thermoelectric components and electronic devices at room temperature and above.14
As acknowledged, the electronic structure and phonon spectrum are essential to determine the figure of merit of thermoelectric materials.2 In this respect, the investigation of the s/o-bismuth monolayer in the literature is mainly focused on structural parameters and electronic structures in recent years, while these results from various groups are not consistent with each other.14–17 For instance, the bandgap of the s/o-bismuth monolayer covers a wide range from 0.15 to 1.01 eV according to several theoretical studies.14,15,17 However, in terms of the thermoelectric properties of the s/o-bismuth monolayer and the underlying reason for the different thermoelectric properties of s/o-bismuth monolayer from its special band structure and phonon spectrum, further research should be conducted on these problems.
In this work, the electronic structure and thermoelectric properties of the s/o-bismuth monolayer are investigated by combining the first-principles calculation and Boltzmann transport theory. The corresponding properties of the β-bismuth monolayer in the literature18 are also derived for the sake of comparison by the same calculated method. Specifically, the band structure, phonon spectrum, lattice thermal conductivity, relaxation time, electronic transport properties, Seebeck coefficients, and figure of merits of s/o-bismuth monolayer are calculated. The fundamental impacts of electronic structure and phonon spectrum on the thermoelectric properties of the s/o-bismuth monolayers are revealed and discussed extensively to provide a deep understanding of various properties of the bismuth monolayer.
2. Theoretical methods
The optimized atomic structure, phonon spectrum, and electronic structure of the s/o-bismuth monolayer are calculated by means of the well-established Vienna ab initio simulation package (VASP) within the density functional theory (DFT).19,20 The calculations are performed in a plane-wave basis with the projector-augmented wave (PAW) method.21–23 The local density approximation (LDA) with the inclusion of spin–orbit coupling (SOC) is chosen for the exchange and correlation functions,24,25 which was proved to be effective in electronic structure calculation of the A7 structure (rhombohedral, space group no. 166. R![[3 with combining macron]](https://www.rsc.org/images/entities/char_0033_0304.gif) m) of Bi and bismuth monolayer in the literature.3,26,27
m) of Bi and bismuth monolayer in the literature.3,26,27
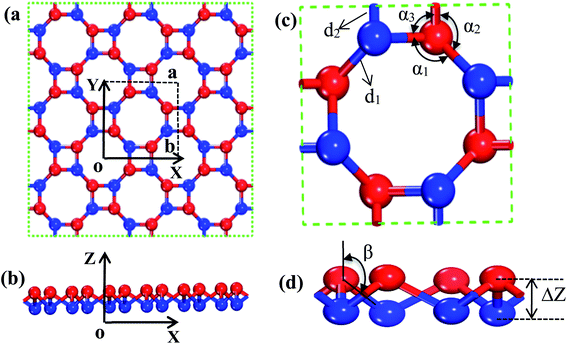
The s/o-bismuth monolayer with the buckled square and octagon ring structure containing eight bismuth atoms shown in Fig. 1 is used for the calculations of the lattice structure, band structure, phonon spectrum, and lattice thermal conductivity. After a series of test calculations, the vacuum distance of the s/o-bismuth monolayer is set as 15 Å to avoid the interactions between the layer and its periodic images. In addition, the k-meshes of 11 × 11 × 1, 29 × 29 × 1, and 3 × 3 × 1 are selected for the calculations of the lattice relaxation, the electronic structure and transport properties, and the phonon spectrum of the s/o-bismuth monolayer, respectively. In addition, the energy criteria are 0.001 and 0.01 meV for electronic and ionic relaxations, respectively.
The transport properties of the s/o-bismuth monolayer are derived by means of the Boltzmann transport theory and the rigid band approach (RBA) as included in the software of Boltztrap.28 The energy eigenvalues are employed on a very dense nonshifted 12615 k-point mesh in the full Brillouin zone (BZ) from the self-consistent converged electronic structure calculations. The transport properties are derived as a function of temperature and chemical potential employing the constant relaxation time approximation (CRTA), which neglects the weak energy dependence of relaxation time (τ) but retains some temperature and doping dependence.29,30 The effects of temperature and carrier density (n) are simulated using the rigid band approximation,31–33 which assumes that the effects do not change the shape of the band structure, but only shift the Fermi energy.18,34
The lattice thermal conductivity and phonon spectrum of the s/o-bismuth monolayer are calculated by using the Boltzmann transport equations for the phonons as implemented in ShengBTE code35 and PHONOPY package.36 To obtain the phonon spectrum and lattice thermal conductivity, the second-order harmonic interatomic force constants (IFCs) are calculated using the density-functional perturbation theory (DFPT) with a 4 × 4 × 1 supercell.37 In addition, the third-order anharmonic IFCs are performed by using a 4 × 4 × 1 supercell and the interactions up to the fifth nearest neighbors are taken into account with the finite difference method for calculating the lattice thermal conductivity,38 while the k-meshes of 3 × 3 × 1 are selected for the supercell calculation with the ring lattice of square and octagon.
3. Results and discussion
3.1 Band structure of s/o-bismuth monolayer
In order to find out the band structure of the s/o-bismuth monolayer, the structural parameters (a, d1, d2, α1, α2, α3, β, and ΔZ) of the s/o-bismuth monolayer are first optimized using the PAW + LDA + SOC method, which can describe the band structure of Bi more accurately than the generalized gradient approximation with the PAW method.18,21,39 Accordingly, Fig. 1(a)–(d) show the derived atomic configuration and its parameters of the buckled s/o monolayer from different perspectives. The whole structure consists of two atomic planes of the buckled square and octagon rings and all the corners of the rings are occupied by the atom of bismuth.The calculated lattice constants (a), bond lengths (d1 and d2), bond angle (α1, α2, α3, and β), and buckling parameter (ΔZ) of the s/o-bismuth monolayer are summarized in Table 1. The available theoretical results of the s/o-bismuth monolayer in the literature14,15,17 and β-bismuth monolayer are also included in Table 1 for comparison. It can be clearly seen from this table that the optimized lattice parameters for the s/o-bismuth monolayer using the present PAW + LDA + SOC method are in good agreement with the previously reported results using other methods.14,15,17 In addition, one can also discern that the bond lengths (d1 and d2) and buckling parameter (ΔZ) of the s/o-bismuth monolayer is slightly less than that of the corresponding β-bismuth monolayer.18
| Structure | a | d i | α i , β | ΔZ | Method | Ref |
|---|---|---|---|---|---|---|
| s/o-Monolayer | 8.46 | d 1 = 2.996, d2 = 3.020 | α 1 = 98.993, α2 = 98.993, α3 = 71.335, β = 130.309 | 1.708 | LDA + SOC | This work |
| s/o-Monolayer | 8.40 | d 1 = 2.990, d2 = 3.080 | α 1 = 96.60, α2 = 96.60 | 1.780 | PBE + SOC | 15 |
| s/o-Monolayer | 8.74 | d 1 = 3.044, d2 = 3.059 | α 3 = 70.40 β = 126.70 | 1.757 | PBE + SOC | 17 |
| s/o-Monolayer | 8.74 | d 1 = 3.020, d2 = 3.050 | 1.760 | GGA + SOC | 14 | |
| β-Monolayer | 4.54 | d 1 = 3.05 | 1.730 | LDA + SOC | 18 |
To figure out the impact of the electronic structure on the electric transport performance, the band structure and band gap of the s/o-bismuth monolayer are calculated and shown in Table 2 and Fig. 2. Additionally, the band structure of the β-bismuth monolayer in our previous work18 and the related theoretical band structure of the s/o-bismuth monolayer in the literature14,15,17 are also included in Table 2 for the sake of comparison.
| Structure | E VBM (eV) | E CBM (eV) | E g | Method | Reference |
|---|---|---|---|---|---|
| s/o-Monolayer | −0.1189 | 0.1645 | 0.283 | LDA + SOC | This work |
| s/o-Monolayer | 0.34 | PBE + SOC | 15 | ||
| s/o-Monolayer | 0.63 | PBE | 15 | ||
| s/o-Monolayer | 0.15 | HSE + SOC | 15 | ||
| s/o-Monolayer | 1.01 | HSE | 15 | ||
| s/o-Monolayer | 0.41 | PBE + SOC | 17 | ||
| s/o-Monolayer | 0.33 | PW91 + SOC | 14 | ||
| β-Monolayer | −0.1348 | 0.3872 | 0.522 | LDA + SOC | 18 |
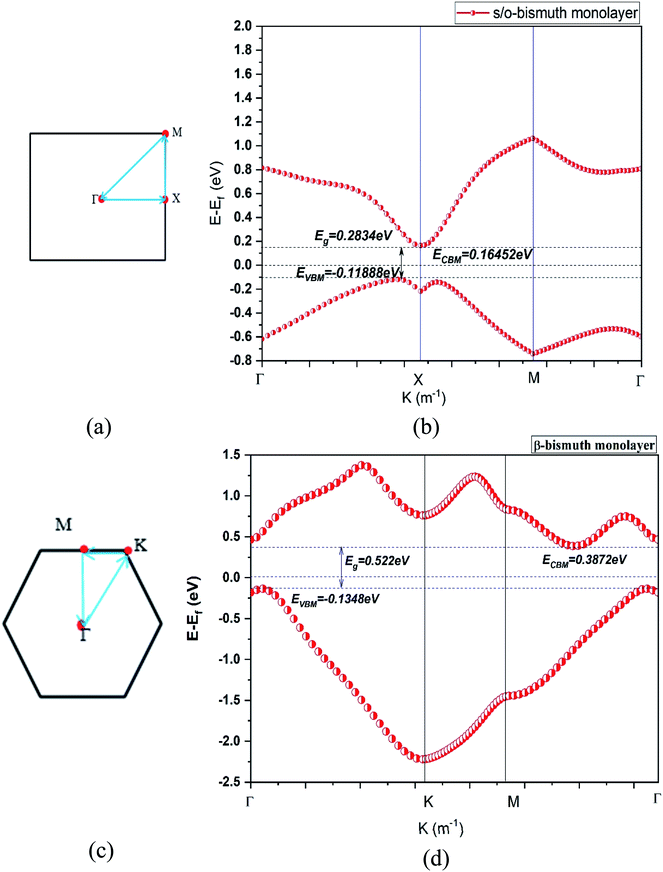 | ||
| Fig. 2 The first Brillouin zone (a) (c) and the band structure (b) (d) of the s/o-bismuth and β-bismuth monolayer18 using the LDA + SOC method, respectively. | ||
First of all, the band gap (0.283 eV) of the s/o-bismuth monolayer using the PAW-LDA-SOC method agrees well with the reported values 0.330 and 0.340 eV or 0.41 eV from the GGA-PW91-SOC and GGA-PBE-SOC methods,14,15 respectively, while larger than the value of 0.150 eV from the HSE-SOC method.17 Interestingly, the band gap (0.283 eV) of the s/o-bismuth monolayer from the present PAW-LDA-SOC method is less than the calculated values of 0.63 eV and 1.01 eV from other theoretical methods of PBE and HSE, respectively.15
Secondly, it can be clearly observed from Fig. 2(a) and (b) that the main shape of the band structure of the s/o-bismuth monolayer, the electrons and holes of Fermi surfaces centered at the X points and along the Γ–X high symmetrical path in the Brillouin zone are in good agreement with the corresponding reported results in the literature.17 Note that the X points and energy bands along the Γ–X directions in the s/o-bismuth monolayer are very close to Ef and thus dominate the main features of its electronic structure and transport properties. However, the energy bands along the Γ–M and Γ–K direction in the β-bismuth monolayer are near Ef and play a decisive role according to Fig. 2(c) and (d).
Thirdly, it can be seen from Fig. 2(b) and (d) that the valence band maximum (VBM) and the conduction band minimum (CBM) of the s/o-bismuth monolayer are lower and higher than those of β-bismuth monolayer, respectively. Additionally, both s/o-bismuth and β-bismuth monolayers are typical indirect semiconductors. Moreover, the bandgap of the s/o-bismuth monolayer is 0.283 eV, which is smaller than the corresponding value of 0.522 eV of the β-bismuth monolayer calculated using the same PAW-LDA-SOC method.
3.2 Phonon spectrum and lattice thermal conductivity of s/o-bismuth monolayer
It is of value to fundamentally understand the phonon transport properties of the s/o-bismuth monolayer. First of all, the phonon spectrum of the s/o-bismuth monolayer is calculated and shown in Fig. 3 by the finite difference method implemented in the Phonopy package.36 The corresponding result of the β-bismuth monolayer is also included in Fig. 3 (ref. 18) for the sake of comparison. One can discern from Fig. 3 that the phonon spectrum of the s/o-bismuth monolayer is free from imaginary frequencies in the first Brillouin zone, indicating that this structure is thermodynamically stable, which is in good agreement with the other previous works.14,15,17 Moreover, the longitudinal acoustic (LA) and transverse acoustic (TA) branches of the s/o-bismuth monolayer are linear when the wave vector q is close to the Γ point. However, the acoustic (ZA) branch of the s/o-bismuth monolayers in the z-direction deviates from linearity near the Γ point owing to the sufficiently weak interplanar interactions by the microscopic elastic theory, which is a generic feature of the monolayer material including the β-bismuth monolayer.40–42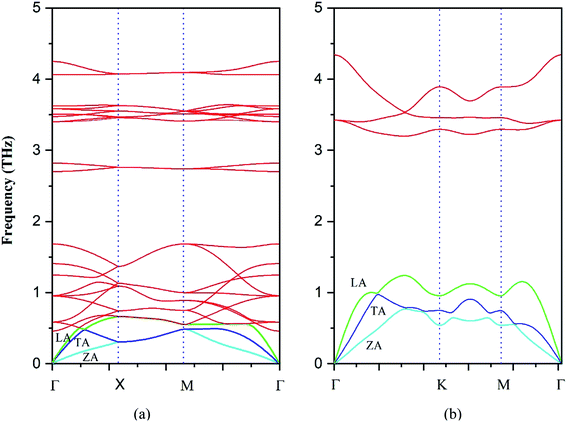 | ||
| Fig. 3 Phonon band structure of the s/o-bismuth monolayer (a) and β-bismuth monolayer18 (b). | ||
The lattice thermal conductivity (κl) of the s/o-bismuth monolayer is then calculated as a function of temperature in the framework of the supercell approach through the obtained second- and third-order interatomic force constants as implemented in the ShengBTE.35 Consequently, Fig. 4 shows the derived lattice thermal conductivity (κl) of the s/o-bismuth monolayer, including the β-bismuth monolayer as the function of temperature for the sake of comparison. One can observe from this figure that the lattice thermal conductivity of s/o-bismuth is significantly lower than that of the β-bismuth monolayer, which indicates the important role of the structure in determining the lattice thermal conductivity of the bismuth monolayers.
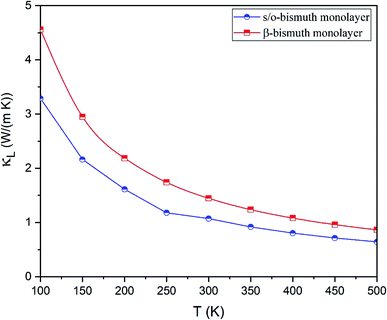 | ||
| Fig. 4 Lattice thermal conductivity of s/o-bismuth monolayer and β-bismuth monolayer18 as the function of temperature with respect to a uniform vacuum thickness of 15 Å. | ||
It is of vital importance to have a deep understanding of the intrinsic reason why the lattice thermal conductivity of the s/o-bismuth monolayer is lower than that of the β-bismuth monolayer. Accordingly, the lattice thermal conductivity of the bismuth monolayer may be derived from the summation of the contribution of all the phonon modes from the phonon kinetic theory in the following form:43
 | (2) |
To investigate the effect of phonon scattering on the lattice thermal conductivity, the three-phonon scattering, including both the strength of each scattering channels and the phonon scattering channels are calculated, which are described by the Grüneisen parameter (γ) and the total phase space for three-phonon processes (P3), respectively. The Umklapp scattering time, clarified as the τU, is inversely proportional to γ2 as follow showing the contribution of Grüneisen parameter:44
 | (3) |
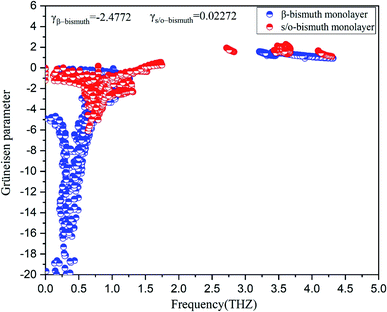 | ||
| Fig. 5 Grüneisen parameters of s/o-bismuth and β-bismuth monolayers18 as the function of the frequency at the 300 K. | ||
In addition, the total phase spaces for three-phonon processes (P3) of all modes in s/o-bismuth and β-bismuth are calculated and shown in Fig. 6. Interestingly, the channels of the scattering phase space of the s/o-bismuth monolayer (P3) are lower than those of the β-bismuth monolayer. The larger P3 typically indicates more channels of phonon scattering, a larger scatter rate, and consequently, lower intrinsic lattice thermal conductivity,47 which is contrary to our above-calculated lattice thermal conductivity results. Therefore, it could be deduced that both the strength of each scattering channels and the phonon scattering channels of the three-phonon scattering process cannot explain the unexpected phonon transport behavior in bismuth monolayers.
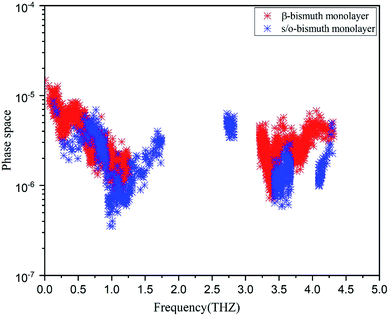 | ||
| Fig. 6 Scattering phase space of all modes in s/o-bismuth and β-bismuth monolayers18 as the function of the frequency at 300 K. | ||
If the differences of three-phonon scattering cannot be attributed, the differences between the phonon volumetric specific heat and the group velocity must be the governing factors of the lattice thermal conductivity according to eqn (2). The phonon volumetric specific heats of the s/o-bismuth and β-bismuth monolayers can be calculated by the following formula:43
 | (4) |
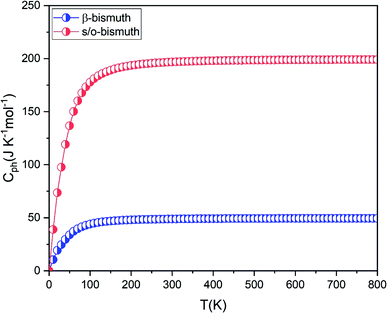 | ||
| Fig. 7 The phonon volumetric specific heat of s/o-bismuth and β-bismuth monolayers18 as the function of temperature. | ||
The group velocity could be defined in the following form:48
 | (5) |
After a series of calculations, Table 3 summarizes the maximum frequency of ZA, TA, and LA from the calculated phonon spectra of the s/o-bismuth monolayer, as shown in Fig. 3 as well as the β-bismuth monolayer for the sake of comparison. Furthermore, the corresponding maximum group velocities of ZA, TA, and LA are also obtained and listed in Table 3 according to eqn (5). It can be clearly observed from Table 3 that the maximum frequencies of ZA, TA, and LA and the maximum group velocity of the s/o-bismuth monolayer are lower than those of the β-bismuth monolayer, suggesting that lower phonon velocity and acoustic-phonon frequency lead to the lower lattice thermal conductivity of the s/o-bismuth monolayer. Overall, the lower lattice thermal conductivity of the s/o-bismuth monolayer than the β-bismuth monolayer is owing to the lower phonon velocity (v) and acoustic-phonon frequency (ω). On the contrary, the influence of the Grüneisen parameter (γ), the total phase space for three-phonon processes (P3), and the phonon volumetric specific heat (cph) on the lattice thermal conductivity are negligible based on our results.
| Materials | ω mLA (THz) | ω mTA (THz) | ω mZA (THz) | V mLA (km s−1) | V mTA (km s−1) | V mZA (km s−1) | Method |
|---|---|---|---|---|---|---|---|
| s/o-Bismuth | 0.67 | 0.49 | 0.49 | 4.49 | 3.22 | 2.75 | This work |
| β-Bismuth | 1.16 | 0.98 | 0.77 | 19.26 | 11.30 | 6.86 | Ref. 18 |
3.3 Electronic transport properties and figure of merit of s/o-bismuth monolayer
In order to investigate the figure of merit of the s/o-bismuth monolayer, the relaxation time of the carriers (electrons and holes) should be calculated beforehand. In the present study, the deformation potential theory (DP), which only includes the matrix elements of interactions between electrons and longitudinal acoustic phonons,49,50 was performed to calculate the relaxation time of the s/o-bismuth monolayer. It should be pointed out that the relaxation time of the s/o-bismuth monolayer would be reliable using the DP theory, which has been successfully applied in many 2D materials.51,52According to the DP theory, the relaxation time (τβ) along a certain direction β (β = x, y) for the two-dimensional system can be derived by the following form:26,53–55
 | (6) |
 | (7) |
 | (8) |
 | (9) |
After a series of calculations, the relaxation time of the s/o-bismuth monolayer was derived as a function of temperature. As a typical example, Table 4 shows the obtained effective masses m*, elastic constants Cβ, deformation potential constant Vβ, and relaxation time τβ along a certain direction β (β = x, y) of the s/o-bismuth monolayer as well as the β-bismuth monolayer for the sake of comparison at 300 K. It should be pointed out that the x and y directions of the s/o-bismuth monolayer are shown in Fig. 1(a). One could discern clearly from Table 4 that the effective mass of the holes in the s/o-bismuth monolayer is bigger than the corresponding value in the β-bismuth monolayer. On the other hand, the effective mass of electrons of these two different monolayers is approaching each other. One could also discern from Table 4 that for the s/o-bismuth monolayer, there is a sharp decrease of elastic constants compared with the β-bismuth monolayer, and such a decrease in elastic constants would bring about weakened bond strength and subsequent low phonon velocity, which are consistent with the lower lattice thermal conductivity revealed in Section IIIB. Moreover, as shown in Table 4, for both electrons and holes, the present relaxation times along the x or y direction of the s/o-bismuth monolayer are lower than those of the corresponding β-bismuth monolayer, which suggests a weaker coupling of electrons and phonons in the s/o-bismuth monolayer and contributes to its better thermoelectric performance.56
| Mater type | (m0) | (m0) | C x (N m−1) | C y (N m−1) | V x (eV) | V y (eV) | τ x (ps) | τ y (ps) | Method | |
|---|---|---|---|---|---|---|---|---|---|---|
| s/o-Bi | h | 2.15 | 2.16 | 12.64 | 12.64 | 5.51 | 5.51 | 0.002 | 0.002 | LDA + SOC |
| e | 0.11 | 0.11 | 12.64 | 12.64 | 2.88 | 2.88 | 0.11 | 0.11 | LDA + SOC | |
| β-Bi | h | 0.23 | 0.23 | 23.86 | 23.96 | 1.61 | 9.14 | 0.52 | 0.09 | LDA + SOC18 |
| e | 0.14 | 0.14 | 23.86 | 23.96 | 3.08 | 3.49 | 0.44 | 0.39 | LDA + SOC18 |
After obtaining the obtained relaxation time, the electrical conductivity (σ), electric thermal conductivity (κe), and total thermal conductivity (κ = κe + κL) of the s/o-bismuth monolayer are calculated as a function of chemical potential as well as the Seebeck coefficients (S). Thereby, the figure of merit of the s/o-bismuth monolayer can be calculated according to eqn (1). As typical examples, Fig. 8, 9, and 10 display the Seebeck coefficients, electrical conductivity (σ), electric thermal conductivity (κe), total thermal conductivity (κ), and figure of merit (ZT) of the s/o-bismuth monolayer as the function of chemical potential (μ) as well as the β-bismuth monolayer in the literature18 for the sake of comparison.
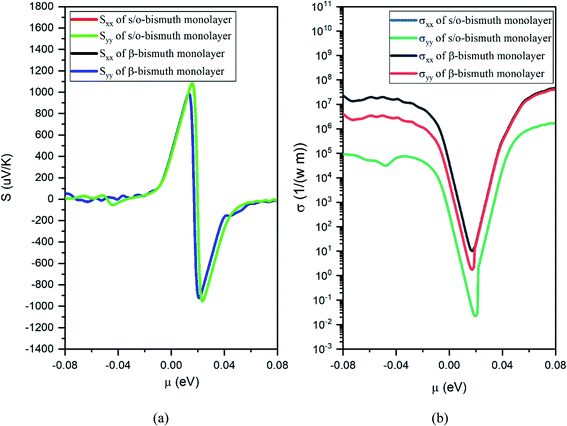 | ||
| Fig. 8 Seebeck coefficients (a) and the electronic conductivity (b) of the s/o-bismuth monolayer and β-bismuth monolayer structure18 as the function of chemical potential (μ), respectively. | ||
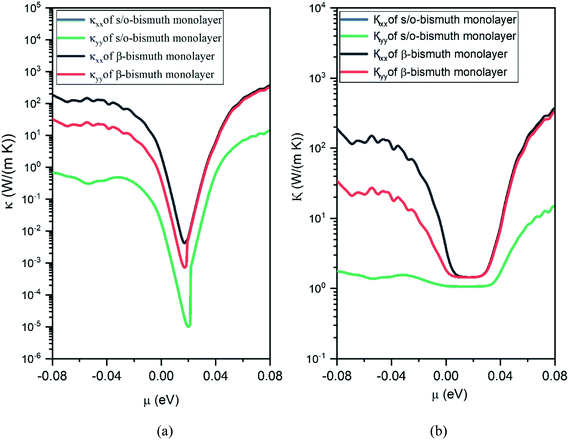 | ||
| Fig. 9 Electronic thermal conductivity (a) and Total thermal conductivity (b) of the s/o-bismuth monolayer and β-bismuth monolayer structure18 as the function of chemical potential (μ) at 300 K, respectively. | ||
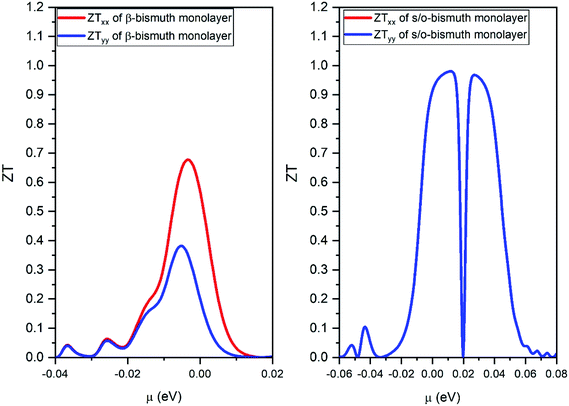 | ||
| Fig. 10 The figure of merit of p- and n-type of the s/o-bismuth monolayer along x and y orientation and the orthogonal supercell of the β-bismuth monolayer along x and y orientation18 as the function of chemical potential (μ) at the 300 K, respectively. | ||
Several characteristics could be discerned from Fig. 8, 9, and 10. First of all, the absolute values of the maximum Seebeck coefficients of the s/o-bismuth monolayer are 1084, 1084, 952, and 952 μV K−1 for electrons and holes along the x and y directions, respectively, which are slightly larger than the corresponding values of 967, 967, 898, and 898 μV K−1 of the β-bismuth monolayer.18 The higher Seebeck coefficient of the s/o-bismuth monolayer for holes can be understood by the larger effective mass (2.16mo) and the presence of fewer minority carriers in the conduction band owing to the higher EVBM (−0.11888 eV) than that of the β-bismuth monolayer, while the higher Seebeck coefficient of the s/o-bismuth monolayer for electrons may be due to the presence of fewer minority carrier due to the lower ECBM (0.16452 eV) than that of the β-bismuth monolayer based on the above-calculated band structure and the effective mass, which matches well with the similar theoretical conclusion in the literature.39
Secondly, the electrical conductivity (σ) and electric thermal conductivity (κe) of the s/o-bismuth monolayer are slightly lower than those of the β-bismuth monolayer, which indicates better electronic transport properties of the s/o-bismuth monolayer. In addition, the total thermal conductivity (κ) of the s/o-bismuth monolayer is lower than that of the β-bismuth monolayer, which may be probably attributed to the lower lattice and electronic thermal conductivity of s/o-bismuth monolayer as shown before in Fig. 9(a). The shape of the curve of electronic thermal conductivity in Fig. 9(a) is very similar to that of the electronic conductivity in Fig. 8(b), which is consistent with the Wiedemann–Franz law.57
Thirdly, the ZT values of the holes and electrons of the s/o-bismuth monolayer along the x or y direction are all much higher than the corresponding values of the β-bismuth monolayer, respectively. Interestingly, the maximum ZT value of the s/o-bismuth monolayer for holes (0.974) and electrons (0.973) is approaching each other, and both are higher than the corresponding maximum ZT value of β-bismuth monolayer (0.69).18 Additionally, this high figure of merit may have contributed to the governing factor such that s/o-bismuth monolayer has unusually lower lattice thermal conductivity and weaker coupling of electrons and phonons than those of the β-bismuth monolayer.
4. Conclusions
In summary, highly accurate first-principles calculation and Boltzmann transport theory have been used to reveal electronic structures, phonon band structures, and thermoelectric properties of the s/o-bismuth monolayer. Results show that the lattice thermal conductivity of the s/o-bismuth monolayer is lower than that of the β-bismuth monolayer owing to the lower phonon velocity. However, the Grüneisen parameter, the total phase space for three-phonon processes, and the phonon volumetric specific heat (cph) are only negligible factors in the lattice thermal conductivity. In addition, the maximum value of the figure of merit of the s/o-bismuth monolayer is 0.974, which should be much larger than that of the β-bismuth monolayer. The derived results are in good agreement with other theoretical results in the literature, and could provide a deep understanding of the thermoelectric properties of the bismuth monolayer materials.Compliance with ethical standards
Funding: Project supported by the Natural Science Foundation of Hunan Province (Grant No. 2020JJ4236), Huxiang Youth talent project of Hunan Province (Grant no. 2018RS3099), Project supported by the Research Foundation of Education Bureau of Hunan Province (Grant No. 20A103), China.Conflicts of interest
The authors declare that they have no conflict of interest.References
- D. Li, Y. Gong, Y. Chen, J. Lin, Q. Khan, Y. Zhang, Y. Li, H. Zhang and H. Xie, Nano-Micro Lett., 2020, 12 Search PubMed.
- C. Chang, M. Wu, D. He, Y. Pei, C. F. Wu, X. Wu, H. Yu, F. Zhu, K. Wang, Y. Chen, L. Huang, J. F. Li, J. He and L. D. Zhao, Science, 2018, 360, 778 CrossRef CAS PubMed.
- A. B. Shick, J. B. Ketterson, D. L. Novikov and A. J. Freeman, Phys. Rev. B: Condens. Matter Mater. Phys., 1999, 60, 15484–15487 CrossRef CAS.
- T. Zhu, Y. Liu, C. Fu, J. P. Heremans, J. G. Snyder and X. Zhao, Adv. Mater., 2017, 29(14), 1605884 CrossRef PubMed.
- Y. Pei, H. Wang and G. J. Snyder, Adv. Mater., 2012, 24, 6125–6135 CrossRef CAS PubMed.
- W. Shanyu, L. Han, L. Ruiming, Z. Gang and T. Xinfeng, Nanotechnology, 2013, 24, 285702 CrossRef PubMed.
- S. V. Ovsyannikov, N. V. Morozova, I. V. Korobeinikov, L. N. Lukyanova, A. Y. Manakov, A. Y. Likhacheva, A. I. Ancharov, A. P. Vokhmyanin, I. F. Berger, O. A. Usov, V. A. Kutasov, V. A. Kulbachinskii, T. Okada and V. V. Shchennikov, Appl. Phys. Lett., 2015, 106, 143901 CrossRef.
- Y. Zhou and L. D. Zhao, Adv. Mater., 2017, 29, 1702676 CrossRef PubMed.
- M. Wu, H. Fu, L. Zhou, K. Yao and X. C. Zeng, Nano Lett., 2015, 15, 3557–3562 CrossRef CAS PubMed.
- J. Guan, Z. Zhu and D. Tomanek, Phys. Rev. Lett., 2014, 113, 046804 CrossRef CAS PubMed.
- C. Kamal and M. Ezawa, Phys. Rev. B: Condens. Matter Mater. Phys., 2015, 91 Search PubMed.
- B. Zhang, H. Zhang, J. Lin and X. Cheng, Phys. Chem. Chem. Phys., 2018, 20, 30257–30266 RSC.
- M. Pumera and Z. Sofer, Adv. Mater., 2017, 29, 1605299 CrossRef PubMed.
- P. Li and W. Luo, Sci. Rep., 2016, 6, 25423 CrossRef CAS PubMed.
- F. Ersan, E. Aktürk and S. Ciraci, Phys. Rev. B, 2016, 94, 245417 CrossRef.
- J. Lee, W. C. Tian, W. L. Wang and D. X. Yao, Sci. Rep., 2015, 5, 11512 CrossRef PubMed.
- L. Kou, X. Tan, Y. Ma, H. Tahini, L. Zhou, Z. Sun, D. Aijun, C. Chen and S. C. Smith, 2D Materials, 2015, 2(4), 045010 CrossRef.
- C. Y. Wu, L. Sun, J. C. Han and H. R. Gong, RSC Adv., 2019, 9, 40670–40680 RSC.
- G. Kresse and J. Furthmüller, Phys. Rev. B: Condens. Matter Mater. Phys., 1996, 54, 11169–11186 CrossRef CAS PubMed.
- G. Kresse and J. Furthmüller, Comput. Mater. Sci., 1996, 6, 15–50 CrossRef CAS.
- X. Gonze, J. P. Michenaud and J. P. Vigneron, Phys. Scr., 1988, 37, 785–789 CrossRef CAS.
- L. C. Liu, H. R. Gong, S. F. Zhou and X. Gong, J. Membr. Sci., 2019, 588, 117206 CrossRef CAS.
- W. Wei, L. Chen, H. R. Gong and J. L. Fan, J. Phys.: Condens. Matter, 2019, 31, 305002 CrossRef CAS PubMed.
- D. M. Ceperley and B. J. Alder, Phys. Rev. Lett., 1980, 45, 566–569 CrossRef CAS.
- X. Gonze, J. P. Michenaud and J. P. Vigneron, Phys. Scr., 1988, 37, 785 CrossRef CAS.
- L. Cheng, H. J. Liu, J. Zhang, J. Wei, J. H. Liang, P. H. Jiang, D. D. Fan, L. Sun and J. Shi, Phys. Chem. Chem. Phys., 2016, 18, 17373–17379 RSC.
- M. Zouhar and M. Šob, Phys. Rev. B, 2016, 94, 184110 CrossRef.
- G. K. H. Madsen and D. J. Singh, Comput. Phys. Commun., 2006, 175, 67–71 CrossRef CAS.
- D. Parker and D. J. Singh, Phys. Rev. X, 2011, 1, 021005 Search PubMed.
- L. Xi, Y. B. Zhang, X. Y. Shi, J. Yang, X. Shi, L. D. Chen, W. Zhang, J. Yang and D. J. Singh, Phys. Rev. B: Condens. Matter Mater. Phys., 2012, 86, 155201 CrossRef.
- K. P. Ong, D. J. Singh and P. Wu, Phys. Rev. B: Condens. Matter Mater. Phys., 2011, 83, 115110 CrossRef.
- L. Sun, C. Y. Wu, J. C. Han, H. R. Gong, M. L. Chang and D. C. Chen, J. Appl. Phys., 2019, 125, 145102 CrossRef.
- C. Y. Wu, L. Sun, H. R. Gong and S. F. Zhou, J. Mater. Sci., 2019, 54, 6347–6360 CrossRef CAS.
- J. C. Han, C. Y. Wu, L. Sun, H. R. Gong and X. Gong, J. Phys. Chem. Solids, 2019, 135, 109114 CrossRef CAS.
- W. Li, J. Carrete, N. A. Katcho and N. Mingo, Comput. Phys. Commun., 2014, 185, 1747–1758 CrossRef CAS.
- A. Togo, F. Oba and I. Tanaka, Phys. Rev. B: Condens. Matter Mater. Phys., 2008, 78, 134106 CrossRef.
- S. Baroni, S. de Gironcoli, A. Dal Corso and P. Giannozzi, Rev. Mod. Phys., 2001, 73, 515–562 CrossRef CAS.
- W. Li, L. Lindsay, D. A. Broido, D. A. Stewart and N. Mingo, Phys. Rev. B: Condens. Matter Mater. Phys., 2012, 86, 174307 CrossRef.
- C. Y. Wu, J. C. Han, L. Sun, H. R. Gong and C. P. Liang, J. Phys.: Condens. Matter, 2018, 30, 285504 CrossRef CAS PubMed.
- Z. Hartmut, J. Phys.: Condens. Matter, 2001, 13, 7679 CrossRef.
- H. Zabel, W. A. Kamitakahara and R. M. Nicklow, Phys. Rev. B: Condens. Matter Mater. Phys., 1982, 26, 5919–5926 CrossRef CAS.
- D. Liu, A. G. Every and D. Tománek, Phys. Rev. B, 2016, 94, 165432 CrossRef.
- K. Yuan, X. Zhang, L. Li and D. Tang, Phys. Chem. Chem. Phys., 2018, 21, 468–477 RSC.
- W. X. Zhou and K. Q. Chen, Sci. Rep., 2015, 5, 15070 CrossRef CAS PubMed.
- Y. Xie, Y. Zhou and X.-G. Gong, Comput. Mater. Sci., 2018, 148, 54–59 CrossRef CAS.
- T. Kocabaş, D. Çakır, O. Gülseren, F. Ay, N. Kosku Perkgöz and C. Sevik, Nanoscale, 2018, 10, 7803–7812 RSC.
- B. Peng, H. Zhang, H. Shao, Y. Xu, G. Ni, R. Zhang and H. Zhu, Phys. Rev. B, 2016, 94, 245420 CrossRef.
- Z. Gao, F. Tao and J. Ren, Nanoscale, 2018, 10, 12997–13003 RSC.
- J. Bardeen and W. Shockley, Phys. Rev., 1950, 80, 72–80 CrossRef CAS.
- J. Xi, M. Long, L. Tang, D. Wang and Z. Shuai, Nanoscale, 2012, 4, 4348–4369 RSC.
- J. Wiktor and A. Pasquarello, Phys. Rev. B, 2016, 94, 245411 CrossRef.
- W. B. Zhang, L. J. Xiang and H. B. Li, J. Mater. Chem. A, 2016, 4, 19086–19094 RSC.
- S. Sharma, S. Kumar and U. Schwingenschlögl, Phys. Rev. Appl., 2017, 8, 044013 CrossRef.
- S. S. Naghavi, J. He, Y. Xia and C. Wolverton, Chem. Mater., 2018, 30, 5639–5647 CrossRef CAS.
- J. Chen, D. Wang and Z. Shuai, J. Chem. Theory Comput., 2012, 8, 3338–3347 CrossRef CAS PubMed.
- L. Cheng, H. J. Liu, J. Zhang, J. Wei, J. H. Liang, P. H. Jiang, D. D. Fan, L. Sun and J. Shi, Phys. Chem. Chem. Phys., 2016, 18, 17373–17379 RSC.
- G. J. Snyder and E. S. Toberer, in Materials for Sustainable Energy, Co-Published with Macmillan Publishers Ltd, UK, 2010, pp. 101–110, DOI:10.1142/9789814317665_0016.
| This journal is © The Royal Society of Chemistry 2021 |

