 Open Access Article
DFT study of superhalogen and superalkali doped graphitic carbon nitride and its non-linear optical properties
Asmat Ullah Khana,
Rasheed Ahmad Khera *a,
Naveed Anjuma,
Rao Aqil Shehzada,
Saleem Iqbalb,
Khurshid Ayub
 *c and
Javed Iqbal
 *ad
*ad
aDepartment of Chemistry, University of Agriculture, Faisalabad-38000, Pakistan. E-mail: Javed.Iqbal@uaf.edu.pk
bDepartment of Chemical Engineering, Wah Engineering College, University of Wah, Wah Cantt, 47040, Pakistan
cDepartment of Chemistry, COMSATS University, Abbottabad Campus, Islamabad, KPK 22060, Pakistan
dPunjab Bio-energy Institute, University of Agriculture, Faisalabad-38000, Pakistan
First published on 17th February 2021
Abstract
DFT calculations are carried out to investigate nonlinear optical (NLO) properties of superhalogen (BCl4) and superalkali (NLi4) doped graphitic carbon nitride (GCN). It is noted that the geometries of doped GCN are sufficiently stable. The energy gap for GCN is 3.89 and it reduces to 0.53 eV in our designed molecule G4. Change in the dipole and transition dipole moment is observed along with small transition energies which are responsible for higher hyperpolarizabilities. Doped GCN has larger first and second hyperpolarizabilities which are basic requirements for NLO response. The second hyperpolarizability of GCN enhances from 1.59 × 10⁴ to 2.53 × 10⁸ au when doping with BCl4 and NLi4. TD-DFT calculations show the absorption maxima of doped GCN range from 700 nm to 1350 nm. EDDM analysis provides information on electronic distribution from excited to ground state. All these consequences show doped GCN can be a promising NLO material.
1. Introduction
Nonlinear optics describes the behavior of light in nonlinear materials and media. While all molecules and materials are nonlinear to some extent, in most cases the optical properties of a substance are not significantly affected by light.1–4 However, for sufficiently intense light (typically from strong lasers), one can observe nonlinear optical phenomena related to the way intense light alters the optical properties of material systems. Mathematically, nonlinear materials have a response that depends on the strength of the applied field in a nonlinear manner. For example, in conventional or linear optics, the dipole moment per unit volume of a substance (the dielectric polarization) depends on the strength of the applied optical field.5–9For the past few decades, nonlinear optical (NLO) materials have earned great attention in the field of photonics because of their vast applications in LASER, LED, optical display, biosensors, scanners and telecommunication and other fields of photonics.6,10–14 Due to their unique properties of producing new electric and magnetic fields, a large number of NLO materials are produced.15,16 Two major classes of NLO materials are organic and inorganic NLO materials. Organic NLO materials are more valuable because of their better electronic properties, structural diversity and large NLO coefficient. Inorganic NLO materials also have advantages of their large size, strengths and stability.17
Several new inorganic and organic materials are synthesized with improved properties. Inorganic phosphides and nitrides, for example, BP, AlP, BN, AlN and GCN18 can be largely applied in semiconductors, and other electronic and NLO applications.19–22 There are more efficient materials for many applications and they can be easily synthesized with low cost.23
Nonlinear optical (NLO) properties of molecules and polymers24–27 are a subject of high importance in organic chemistry and materials sciences. The theoretical prediction of NLO properties based on quantum chemical calculations is challenging and the development of new, along with improvement of existing, methodology remains a substantial demand for computational chemistry.28–31 The difficulties that occur in such calculations are related to the fact that the NLO properties render themselves inelastic quantities because they are high-order derivatives of the energy.32–34 Theoretical investigations have shown that the first hyperpolarizability of inorganic and organic molecules is enhanced by a good approach that is doping of superalkali and superhalogen. Superhalogen comprises electronegative atoms (Cl, F and O) which surrounded the central metal atom. By increasing the electronegative atoms, the added electron is delocalized over the metal atom which increases its electron affinity (EA). The electron affinity of superhalogen goes beyond the electron affinity of the halogen atom. The doping of superalkali leads to the generation of alkalide or electride which increases the value of the first hyperpolarizability. Superalkalis have a lower ionization prospective than alkali metals. The nonlinear response of materials leads to many optical phenomena including changes in the optical properties of the material, generation of new light frequencies, and changes in the phase or the amplitude of the emergent light.35,36
Liebig reported carbon nitride in 1834 for the first time.37 The GCN has been applied successfully in solar cells, gas and humidity sensors, for the storage of H2 and CO2 (ref. 38 and 39) and many others because GCN is thermally stable with a unique electronic framework. In recent years, the NLO response of carbon nanostructures that were sp2 hybridized was largely studied.40,41 In this study, the graphitic carbon nitride cluster (C18N27H8) was doped with superhalogen (BCl4) and superalkali (NLi4). Doping of superhalogen (BCl4) and superalkali (NLi4) is an effective way to enhance the NLO response of GCN. Four different complexes of superhalogen (BCl4) and superalkali (NLi4) doped GCN were investigated through density functional theory (DFT).42–44 This study focused on the NLO response, electronic and molecular structure.
2. Computational details
With Gaussian 09 program45 all the calculations were performed. Structures of the molecules were drawn through GaussView 5.0.46,47 6B3LYP method of DFT was used for the geometry optimization and all other calculations with 6-31G (d,p) basis set. 6B3LYP method is quite reliable for geometry optimization and electronic properties of carbon nitride nanosheets.48 Energies of HOMO, LUMO and HOMO–LUMO band gap were also computed. The DOS analysis was calculated and plotted by using PyMOlyze software.49The HOMO–LUMO band gap was calculated by eqn (1)
| EH–L = EL − EH | (1) |
Vertical Ionization Energies (VIE) were also computed by using the B3LYP method by using eqn (2).
| VIE = E(X+) − E(X) | (2) |
B3LYP method was also used to compute values of dipole moment, transition dipole moment, energy of excitation (ΔE), αiso and αaniso, first and second hyperpolarizabilities (βstatic, γstatic) and oscillator strength (fo). Energy Difference Diagram Map (EDDM) analysis was also performed using the B3LYP method. TD-DFT method was used for UV/Vis absorption analysis and 20 excited states were studied. With the help of Origin software, the UV/Vis spectra were plotted.
3. Results and discussions
3.1. Geometric parameters
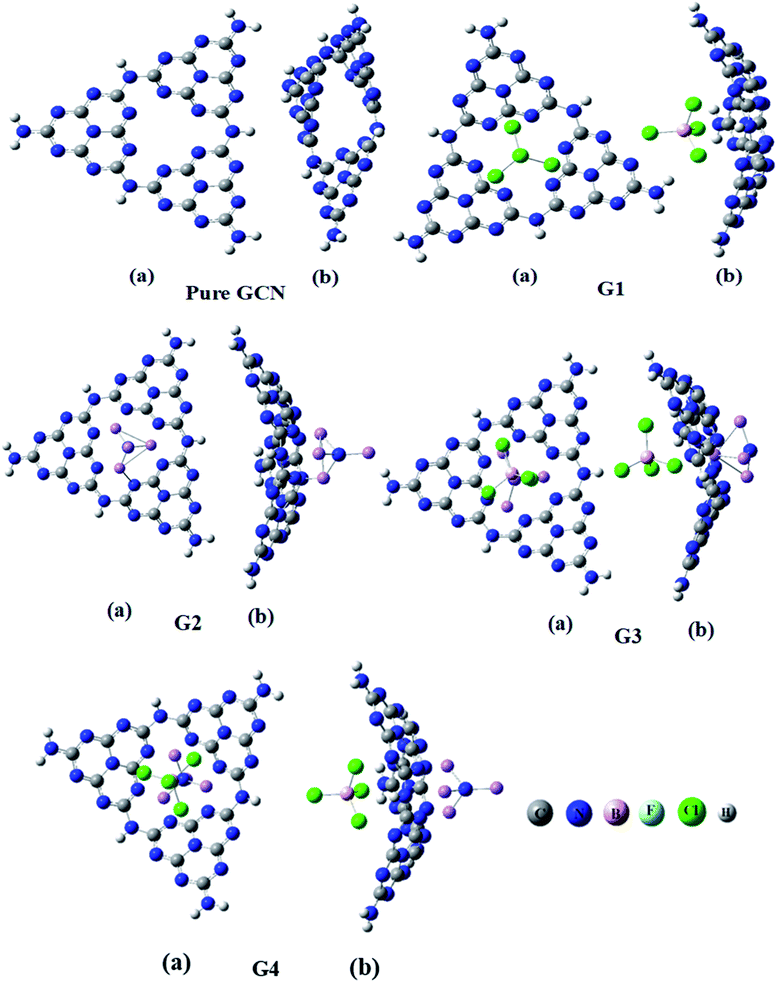
Four different superhalogen (BCL4) and superalkali (NLi4) doped complexes were optimized at the B3LYP/6-31G (d,p), level of theory. Pure GCN and doped GCN (G1–G4) were successfully optimized at B3LYP/6-31G(d,p). G1 and G2 contained superhalogen and superalkali on the GCN surface. G3 & G4 contained both superhalogen and superalkali on the same molecule but opposite sides. G3 and G4 contained superhalogen on bowl-inside and superalkali on bowl-outside. G3 and G4 both contain superhalogen on the bowl-in side of GCN, but they differ in the orientation of superalkali on the other side of GCN. In G3, the nitrogen atoms of superalkali are pointing away from the GCN surface whereas, in G4, a lithium atom is present at the end. It was noted that all the doped complexes were satisfactory stable. Carbon–nitrogen bond lengths (C![[double bond, length as m-dash]](https://www.rsc.org/images/entities/char_e001.gif) N) were computed for pure and all doped complexes. It was examined that, for pure GCN, carbon–nitrogen bonds (C
N) were computed for pure and all doped complexes. It was examined that, for pure GCN, carbon–nitrogen bonds (C![[double bond, length as m-dash]](https://www.rsc.org/images/entities/char_e001.gif) N) were 1.32 Å. C
N) were 1.32 Å. C![[double bond, length as m-dash]](https://www.rsc.org/images/entities/char_e001.gif) N bond lengths were increased from 1.32 Å for pure GCN to 1.34, 1.35, 1.38 Å for G1, G3 & G4, respectively. On the other hand, the C
N bond lengths were increased from 1.32 Å for pure GCN to 1.34, 1.35, 1.38 Å for G1, G3 & G4, respectively. On the other hand, the C![[double bond, length as m-dash]](https://www.rsc.org/images/entities/char_e001.gif) N bond length in G2 was decreased to 1.30 Å. Front and side views (a and b respectively) of optimized geometries for pure GCN and doped G1–G4 complexes are shown in Fig. 1.
N bond length in G2 was decreased to 1.30 Å. Front and side views (a and b respectively) of optimized geometries for pure GCN and doped G1–G4 complexes are shown in Fig. 1.
Reported DFT calculations for band gap for different forms of C3N4 are listed in Table 1. The band gap of α-C3N4, β-C3N4, cubic-C3N4, pseudocubic C3N4, g-h-triazine, g-o-triazine and g-h-heptazine is 5.49 eV, 4.85 eV, 4.30 eV, 4.13 eV, 2.97 eV, 0.93 eV and 2.88 eV, respectively.50 Two major types of g-C3N4 are s-triazine and tri-s-triazine that are linked with tertiary amine groups. Tri-s-triazine is more stable and showed excellent structural, nonlinear optical and physiological properties. The band gap for our proposed form of g-C3N4 (tri-s-triazine) is 3.89 eV. Literature study show that our selected model of g-C3N4 is a highly stable isomeric form among the other reported forms of g-C3N4.50
| Molecule | Band gap eV |
|---|---|
| α-C3N4 | 5.49 |
| β-C3N4 | 4.85 |
| Cubic-C3N4 | 4.3 |
| Pseudocubic C3N4 | 4.13 |
| g-h-triazine | 2.97 |
| g-o-triazine | 0.97 |
| g-h-heptazine | 2.88 |
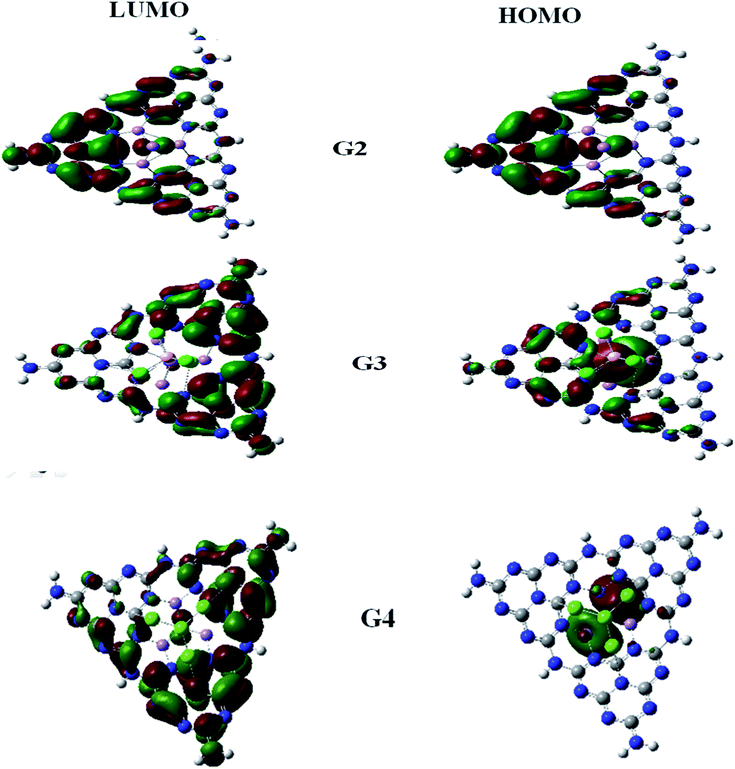
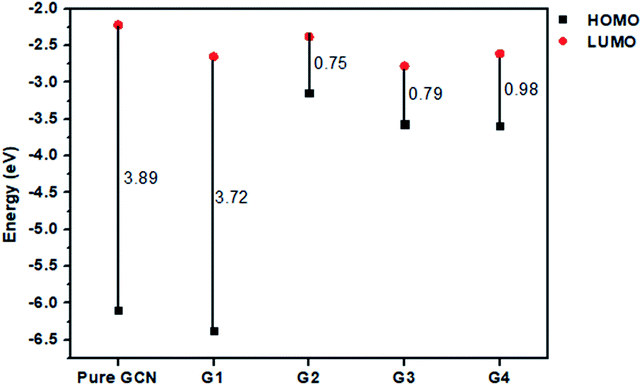
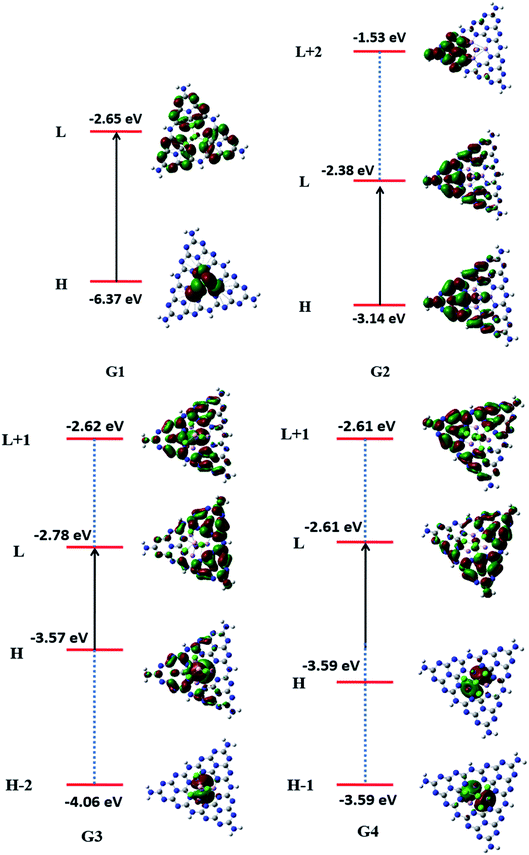
For understanding the electrical and optical properties of the pure GCN and all the designed G1–G4 molecules, energies of HOMO, LUMO and their H–L gaps were calculated. HOMO is electron-rich and represents the donating ability of the molecule. Whereas LUMO illustrates the electron-withdrawing ability. The FMOs (Frontier Molecular Orbitals) of pure GCN and designed molecules (G1–G4) using B3LYP/6-31G (d,p) are shown in Fig. 2. The EHOMO of pure GCN and G1, G2, G3 and G4 are −6.10, −6.37, −3.14, −3.57 and −3.59 eV, respectively, while the ELUMO of pure GCN and G1, G2, G3 and G4 are −2.22, −2.65, −2.38, −2.78 and −2.61 eV respectively given in Table 2. Doping of BCl4 and NLi4 on GCN reduces its energy as new energy levels are generated among these molecules that narrow the energy difference. The energy gap (Eg) for pure GCN and G1, G2, G3 and G4 are 3.89, 3.72, 0.75, 0.79 and 0.98 eV, respectively. This reduction of the energy gap enhances its electronic conduction and makes it easy for electrons to excite from HOMO to LUMO. The decreasing order of Eg is pure GCN > G1 > G4 > G3 > G2. HOMO and LUMO energy gap of G1–G4 are low as compared with pure GCN. The G1 molecule has the highest energy gap of 3.72 eV (Fig. 3).
| Molecule | HOMO (eV) | LUMO (eV) |
|---|---|---|
| Pure GCN | −6.1 | −2.22 |
| G1 | −6.37 | −2.65 |
| G2 | −3.14 | −2.38 |
| G3 | −3.57 | −2.78 |
| G4 | −3.59 | −2.61 |
Vertical ionization energies for all doped complexes were also computed and their values are 6.10, 6.37, 3.14, 3.57 and 3.59 eV of pure GCN and G1, G2, G3 and G4, respectively. The decreasing order for VIE of all pure and doped complexes is pure GCN > G1 > G4 > G3 > G2. All the values are given in Table 3.
| Molecule | Eg (eV) | VIE (eV) | |
|---|---|---|---|
| Pure GCN | 3.89 | 6.1 | |
| G1 | 3.72 | 6.37 | |
| G2 | 0.75 | 3.14 | |
| G3 | 0.79 | 3.57 | |
| G4 | 0.98 | 3.59 | |
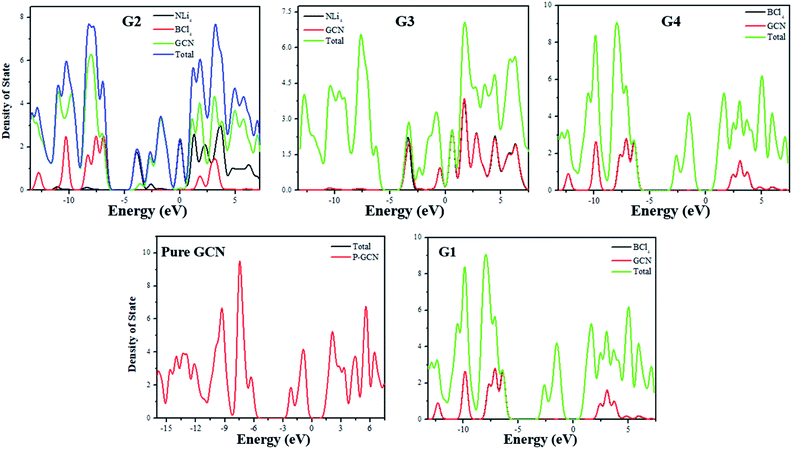
For the understanding of the HOMO–LUMO gap reduction, the density of states (DOS) analysis was performed at the same level of theory. DOS plot for pure GCN showed that there is a large gap between HOMO and LUMO. In the analysis of the DOS plot of G1–G4, a reduction of the energy gap was observed for all complexes. In G1, superhalogen donates excess electrons to GCN and because of these electrons, new energy levels are formed which are responsible for the reduction of the energy gap. Superhalogen, without such excess electrons, does not cause any decrease in the H–L gap. All these new energy levels formed between the original HOMOs and LUMOs of pure GCN result in the reduction of the energy gap. PDOS represents the partial DOS analysis of individual superalkali, superhalogen and GCN fragments whereas, TDOS represents the total DOS analysis of doped molecule. In the DOS plots, TDOS for pure GCN (Redlined) in the range of −16 to −5 eV represents occupied states whereas −2 to 9 eV represent virtual states. In the case of G1, PDOS of pure GCN and TDOS of doped GCN (indicated by red and green lines) ranging from −16 to −5 eV represent HOMO and from −2 to 9 eV represent LUMO but the doped GCN exhibit sharp green peaks in its TDOS representation which is ascribed for the dominant effect of doping in reducing energy gap. In the DOS plot of G2, PDOS of individual superalkali (NLi4), superhalogen (BCl4) and GCN (indicated by black Red and green lines) and TDOS of doped GCN (indicated by the blue line), ranging from −13 to −5 eV represent HOMO and from −4 to 9 eV represent LUMO and LUMO+2. The sharp blue peaks indicate the greater contribution of electron density from doped GCN as well as the higher HOMO and lower LUMO energy levels of G2 become the cause for reduction of the energy gap. In the DOS plot of G3, PDOS of superalkali (NLi4) and pure GCN and TDOS of doped GCN (indicated by black, red and green lines respectively) ranging from −14 to −4 eV represent HOMO and HOMO-2 and from −5 to 9 eV represent LUMO and LUMO+1. The flat red peak of pure GCN in the HOMO region shows its little electronic contribution but the sharp green peaks of doped GCN plausibly explain the high electronic contribution due to the strong effect of dopant in reducing the energy gap. Similar is the case with G4. DOS plots for pure GCN and G1–G4 are shown in Fig. 4.
To understand the nature of excitation, orbital transitions analysis was performed for pure and doped complexes. For pure GCN and G1, the transition took place from HOMO to LUMO, whereas in G2, the transition took place from HOMO to LUMO+2. For G3 transition took place from HOMO-2 to LUMO+1 whereas it is from HOMO-1 to LUMO+1 in G4. These new energy levels which were formed between the original HOMO and LUMO are the evidence of reduction of the energy gap. All these transitions are graphically represented in Fig. 5.
3.2. Non-linear optical properties
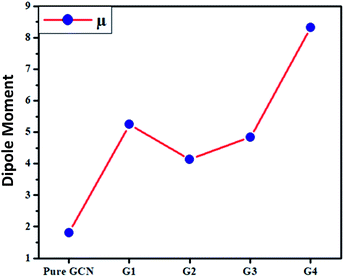
The dipole moments for pure GCN and G1–G4 were computed and it was noted that the dipole moment was changed on doping superhalogen and superalkali on GCN. For pure GCN, it is 1.81 D whereas dipole moments are 5.24, 4.14, 4.84 and 8.33 D for G1, G2, G3 and G4, respectively. The increasing order of dipole moment is pure GCN < G2 < G3 < G1 < G4. Pure GCN has a low dipole moment due to the symmetry and this symmetry is broken when a dopant is introduced on GCN. Among the doped structures, G1 and G2 are singly doped either containing superalkali or a super halogen whereas G3 and G4 contain both superakali and superhalogen on the opposite faces of the GCN sheet. In G3 and G4, the superalkali serves as a source of electrons whereas superhalogen is the acceptor moiety. A deep analysis reveals that the dipole moments are higher for systems containing superhalogen and the dipole moment vector in these complexes starts from the halogen of BCl4 and ends up towards the GCN surface. G3 and G4 both contain superhalogen on the bowl-in side of GCN, but they differ in the orientation of superalkali on the other side of GCN. In G3, the nitrogen atoms of superalkali are pointing away from the GCN surface whereas, in G4, a lithium atom is present at the end. The presence of a lithium atom at the end in G4 creates a positive pole whereas a halogen of BCl4 (on the other end) creates a negative pole. The presence of clear positive and negative poles with a large distance between them leads to a larger dipole moment of G4 over G3. Moreover, the dipole moment vector of G4 is not on the axis connecting the superalkali with superhalogen rather it is tilted on the side which leads to a lower dipole moment.The transition dipole moment for pure GCN and G1–G4 was also computed and it was noted that the transition dipole moments were changed on doping superhalogen and superalkali on GCN. For G1–G4, these are 0.0192, 0.1235, 0.0237 and 0.0052 D respectively. The increasing order of transition dipole moment is G4 < G1 < G3 < G2. The values of dipole moment transition dipole moment for pure GCN and G1–G4 are listed in Table 4.
| Molecule | μ (D) | Δμ (D) |
|---|---|---|
| Pure GCN | 1.81 | |
| G1 | 5.24 | 0.0192 |
| G2 | 4.14 | 0.1235 |
| G3 | 4.84 | 0.0237 |
| G4 | 8.33 | 0.0052 |
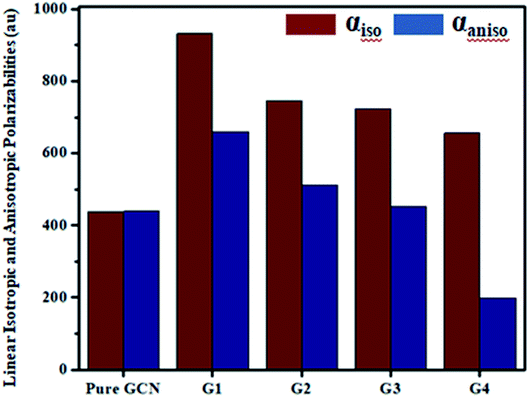
For all complexes linear isotropic and anisotropic polarizabilities (αiso and αaniso) were computed. For pure GCN αiso is 437.54 au and it increased on doping to 932.39, 745.64, 723.89 and 656.01 for G1, G2, G3 and G4, respectively, respectively. Values of αiso increase in order pure GCN < G4 < G3 < G2 < G1. αaniso of pure GCN is 438.89 au and it changed on doping to 659.13, 512.73, 453.29 and 198.63 au for G1, G2, G3 and G4, respectively. αaniso increase in the order G4 < pure GCN < G3 < G2 < G1. Values for all complexes linear isotropic and anisotropic are listed in Table 5.
| Molecule | αiso (au) | αaniso (au) |
|---|---|---|
| Pure GCN | 437.54 | 438.89 |
| G1 | 932.39 | 659.13 |
| G2 | 745.64 | 512.73 |
| G3 | 723.89 | 453.29 |
| G4 | 656.01 | 198.63 |
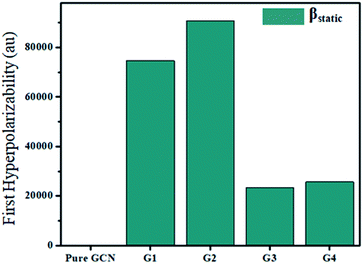
For the NLO response, hyperpolarizability is the major property. First and second hyperpolarizabilities (βstatic and γstatic) were also computed. βstatic for pure GCN is 95.37 au and βstatic values are 74![[thin space (1/6-em)]](https://www.rsc.org/images/entities/char_2009.gif) 703, 90
703, 90![[thin space (1/6-em)]](https://www.rsc.org/images/entities/char_2009.gif) 733, 23
733, 23![[thin space (1/6-em)]](https://www.rsc.org/images/entities/char_2009.gif) 325 and 25
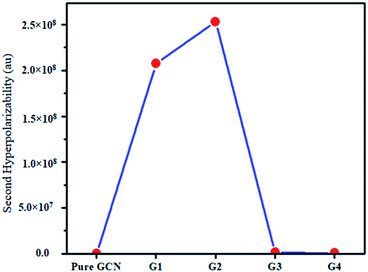
325 and 25![[thin space (1/6-em)]](https://www.rsc.org/images/entities/char_2009.gif) 738 au for G1, G2, G3 and G4, respectively. βstatic increased in the order: pure GCN < G3 < G4 < G1 < G2. γ static for pure GCN is 1.59 × 10⁴ and values for G1–G4 are 2.07 × 10⁸, 2.53 × 10⁸, 1.14 × 10⁶ and 4.43 × 10⁵ au respectively. Values of γstatic increase in order pure GCN < G4 < G3 < G2 < G1. Dipole moment (μ in D), αiso and αaniso in au, βstatic in au and γstatic in au are graphically represented in Fig. 6, Fig. 7, Fig. 8 and Fig. 9, respectively. A two-level approximation is a frequently used model that supports the calculation of nonlinearities especially the first hyperpolarizability as follows.51
738 au for G1, G2, G3 and G4, respectively. βstatic increased in the order: pure GCN < G3 < G4 < G1 < G2. γ static for pure GCN is 1.59 × 10⁴ and values for G1–G4 are 2.07 × 10⁸, 2.53 × 10⁸, 1.14 × 10⁶ and 4.43 × 10⁵ au respectively. Values of γstatic increase in order pure GCN < G4 < G3 < G2 < G1. Dipole moment (μ in D), αiso and αaniso in au, βstatic in au and γstatic in au are graphically represented in Fig. 6, Fig. 7, Fig. 8 and Fig. 9, respectively. A two-level approximation is a frequently used model that supports the calculation of nonlinearities especially the first hyperpolarizability as follows.51
 | (3) |
| Molecule | βstatic (au) | γstatic (au) |
|---|---|---|
| Pure GCN | 95.37 | 1.59 × 10⁴ |
| G1 | 74![[thin space (1/6-em)]](https://www.rsc.org/images/entities/char_2009.gif) 703 703 |
2.07 × 10⁸ |
| G2 | 90![[thin space (1/6-em)]](https://www.rsc.org/images/entities/char_2009.gif) 733 733 |
2.53 × 10⁸ |
| G3 | 23![[thin space (1/6-em)]](https://www.rsc.org/images/entities/char_2009.gif) 325 325 |
1.14 × 10⁶ |
| G4 | 25![[thin space (1/6-em)]](https://www.rsc.org/images/entities/char_2009.gif) 738 738 |
4.43 × 10⁵ |
Excitation energy (ΔE) and oscillator strength (fo) for G1–G4 are given in Table 7.
| Molecule | fo | ΔE eV |
|---|---|---|
| G1 | 0.0001 | 0.0283 |
| G2 | 0.0006 | 0.2378 |
| G3 | 0.0054 | 0.1068 |
| G4 | 0.0035 | 0.422 |
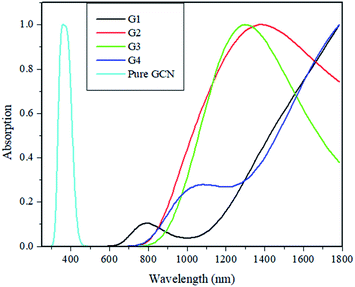
Absorption energies of pure GCN and G1–G4 are computed through time-dependent DFT (TD-DFT). 20 excited states were studied, and it was noted that pure GCN absorbs at 350 nm. After doping superhalogen and superalkali absorption maxima are red-shifted. All the doped structures absorb radiations in the visible and IR region. The λmax for G1, G2, G3 and G4 are 780, 1350, 1290 and 1045 nm. This shows that these doped complexes have valuable absorption for NLO response. Absorption spectra for pure GCN and G1–G4 are shown in Fig. 10. Absorption (λmax) and transition orbital for G1–G4 are listed in Table 8.
| Molecule | λmax (nm) | % C.I transition |
|---|---|---|
| G1 | 780 | 97% H → L |
| G2 | 1350 | 96% H → L+2 |
| G3 | 1290 | 84% H-2 → L+1 |
| G4 | 1045 | 50% H-1 → L+1 |
3.3. EDDM analysis
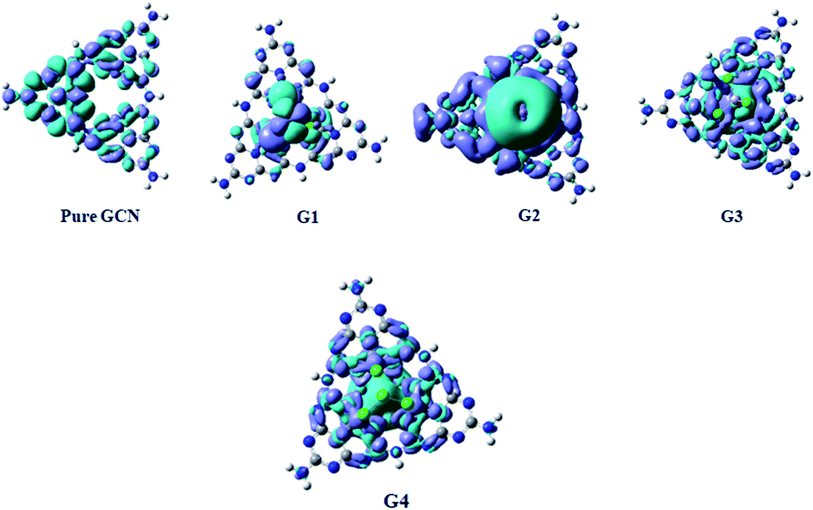
Electron Density Difference Map (EDDM) analysis of pure GCN and G1–G4 complexes was carried out at the B3LYP/6-31G level of theory. For a better understanding of resultant charge density over the molecule, EDDM analysis was carried out. Images of EDDM gave information about the electronic distribution of pure GCN and doped complexes G1–G4 from excited to ground state transition (ρexcited − ρground). Two different colors were seen in EDDM images (sea-green and purple color). The reduced density of electrons shown in purple color with a negative value and electron reorganizations with a positive value with sea-green color represents the electronic density growth. EDDM images for pure GCN and doped G1–G4 are shown in Fig. 11.4. Conclusions
NLO response of superhalogen (BCL4) and superalkali (NLi4) doped graphitic carbon nitride (GCN) was investigated by density field theory (DFT) methods. It was noted that all the doped complexes (G1–G4) were geometrically stable. Reduction of HOMO–LUMO energy gap was noted for all G1–G4. For pure GCN, the energy gap is 3.89 eV. G1 showed the highest energy gap of 3.72 eV among doped clusters. VIEs for all G1–G4 were changed for all G1–G4. The increase in dipole moment was observed for G1–G4. It was also observed that the values of ΔE were small which indicates higher values of hyperpolarizabilities. Doping of superhalogen and superalkali on GCN change linear isotropic and anisotropic polarizabilities which are responsible for their NLO response. Moreover, the first and second hyperpolarizability (βstatic and γstatic) were changed. βstatic for pure GCN was 95.37 au and for G3 it was increased to 90![[thin space (1/6-em)]](https://www.rsc.org/images/entities/char_2009.gif) 733 au. All these changes after doping enhanced the NLO response of GCN. All the doped complexes show absorption in the range of 700 to 1350 nm. All the results propose that superhalogen and superalkali co-doped graphitic carbon nitride (G1–G4) can be promising candidates as NLO material.
733 au. All these changes after doping enhanced the NLO response of GCN. All the doped complexes show absorption in the range of 700 to 1350 nm. All the results propose that superhalogen and superalkali co-doped graphitic carbon nitride (G1–G4) can be promising candidates as NLO material.
Conflicts of interest
There are no conflicts to declare.Acknowledgements
The authors acknowledge the financial and technical support from the Punjab Bio-energy Institute (PBI) and the University of Agriculture Faisalabad (UAF).References
- X. Xue, H. Wang, Y. Han and H. Hou, Dalton Trans., 2018, 47, 13–22 RSC.
- A. A. A. Aziz, F. M. Elantabli, H. Moustafa and S. M. El-Medani, J. Mol. Struct., 2017, 1141, 563–576 CrossRef.
- T. V. Vu, A. Lavrentyev, B. Gabrelian, O. Parasyuk and O. Khyzhun, Mater. Chem. Phys., 2018, 219, 162–174 CrossRef CAS.
- Ö. Tamer, D. Avcı and Y. Atalay, J. Phys. Chem. Solids, 2016, 99, 124–133 CrossRef.
- V. Sivasubramani, V. Mohankumar, M. S. Pandian and P. Ramasamy, CrystEngComm, 2017, 19, 5662–5678 RSC.
- S. Ding, C. Wang, X. Shi, J. Zou, Q. Cheng, J. Zhu, Z. Shi, Z. Cai, C. Chen and Z. Cui, J. Mater. Chem. C, 2019, 7, 4667–4672 RSC.
- T. Verbiest, D. Burland, M. Jurich, V. Lee, R. Miller and W. Volksen, Science, 1995, 268, 1604–1606 CrossRef CAS.
- N. Dhumane, S. Hussaini, V. Dongre and M. D. Shirsat, Opt. Mater., 2008, 31, 328–332 CrossRef CAS.
- P. S. Halasyamani and W. Zhang, Inorg. Chem., 2017, 56(20), 12077–12085 CrossRef CAS.
- B. Panunzi, R. Diana, A. Tuzi, A. Carella and U. Caruso, J. Mol. Struct., 2019, 1189, 21–27 CrossRef CAS.
- K. Kamatchi, P. Umarani, T. Radhakrishnan and C. R. Raja, Optik, 2018, 172, 674–679 CrossRef CAS.
- S. Goel, N. Sinha, H. Yadav, A. J. Joseph, A. Hussain and B. Kumar, Arabian J. Chem., 2020, 13, 146–159 CrossRef CAS.
- L. Mydlova, S. Taboukhat, A. Ayadi, A. Migalska-Zalas, A. El-Ghayoury, A. Zawadzka, M. Makowska-Janusik and B. Sahraoui, Opt. Mater., 2018, 86, 304–310 CrossRef CAS.
- B. Mohan, M. Choudhary, S. Bharti, A. Jana, N. Das, S. Muhammad, A. G. Al-Sehemi and S. Kumar, J. Mol. Struct., 2019, 1190, 54–67 CrossRef CAS.
- G. Zou and K. M. Ok, Chem. Sci., 2020, 11, 5404–5409 RSC.
- S.-P. Guo, Y. Chi and G.-C. Guo, Coord. Chem. Rev., 2017, 335, 44–57 CrossRef CAS.
- S. Muhammad, Mater. Chem. Phys., 2018, 220, 286–292 CrossRef CAS.
- G. Venkatesh, M. Govindaraju, P. Vennila and C. Kamal, J. Theor. Comput. Chem., 2016, 15, 1650007 CrossRef.
- J. Iqbal, R. Ludwig and K. Ayub, Mater. Res. Bull., 2017, 92, 113–122 CrossRef.
- K. Ayub, J. Mater. Chem. C, 2016, 4, 10919–10934 RSC.
- J. Iqbal and K. Ayub, J. Alloys Compd., 2016, 687, 976–983 CrossRef.
- R. A. Shehzad, J. Iqbal, K. Ayub, F. Nawaz, S. Muhammad, A. R. Ayub and S. Iqbal, Optik, 2021, 226, 165923 CrossRef CAS.
- P. Vennila, M. Govindaraju, G. Venkatesh and C. Kamal, J. Mol. Struct., 2016, 1111, 151–156 CrossRef CAS.
- H. S. Nalwa and S. Miyata, Nonlinear optics of organic molecules and polymers, CRC press, 1996 Search PubMed.
- J. Messier, P. Prasad and D. Ulrich, Nonlinear optical effects in organic polymers, Springer Science & Business Media, 2012 Search PubMed.
- X. Meng, Y. Song, H. Hou, Y. Fan, G. Li and Y. Zhu, Inorg. Chem., 2003, 42, 1306–1315 CrossRef CAS.
- J. A. Delaire and K. Nakatani, Chem. Rev., 2000, 100, 1817–1846 CrossRef CAS.
- F. Castet, V. Rodriguez, J.-L. Pozzo, L. Ducasse, A. Plaquet and B. Champagne, Acc. Chem. Res., 2013, 46, 2656–2665 CrossRef CAS.
- C. Ye, T. J. Marks, J. Yang and G. Wong, Macromolecules, 1987, 20, 2322–2324 CrossRef CAS.
- J. Qin, D. Liu, C. Dai, C. Chen, B. Wu, C. Yang and C. Zhan, Coord. Chem. Rev., 1999, 188, 23–34 CrossRef CAS.
- D. F. Eaton, Science, 1991, 253, 281–287 CrossRef CAS.
- P. S. Liyanage, R. M. de Silva and K. N. de Silva, J. Mol. Struct.: THEOCHEM, 2003, 639, 195–201 CrossRef CAS.
- S. D. Bella, Chem. Soc. Rev., 2001, 30, 355–366 RSC.
- I. C. de Silva, R. M. de Silva and K. N. De Silva, J. Mol. Struct.: THEOCHEM, 2005, 728, 141–145 CrossRef CAS.
- N. Leclerc, S. Sanaur, L. Galmiche, F. Mathevet, A.-J. Attias, J.-L. Fave, J. Roussel, P. Hapiot, N. Lemaître and B. Geffroy, Chem. Mater., 2005, 17, 502–513 CrossRef CAS.
- S. Muhammad, A. G. Al-Sehemi, A. Irfan, H. Algarni, Y. Qiu, H. Xu, Z. Su and J. Iqbal, J. Mol. Graphics Modell., 2018, 81, 25–31 CrossRef CAS.
- F. Goettmann, A. Fischer, M. Antonietti and A. Thomas, Angew. Chem., Int. Ed., 2006, 45, 4467–4471 CrossRef CAS.
- C.-t. Chen and G.-z. Liu, Annu. Rev. Mater. Sci., 1986, 16, 203–243 CrossRef CAS.
- M. E. Wright and M. S. Sigman, Macromolecules, 1992, 25, 6055–6058 CrossRef CAS.
- K. Sridharan, P. Sreekanth, T. J. Park and R. Philip, J. Phys. Chem. C, 2015, 119, 16314–16320 CrossRef CAS.
- A. S. Febena, M. V. A. Raj and J. Madhavan, Mechanics, Materials Science & Engineering Journal, 2017 DOI:10.2412/mmse.48.92.693.
- A. Omidvar, Inorg. Chem., 2018, 57, 9335–9347 CrossRef CAS.
- A. K. Srivastava, A. Kumar and N. Misra, Chem. Phys. Lett., 2017, 682, 20–25 CrossRef CAS.
- G.-L. Hou and X.-B. Wang, Chem. Phys. Lett., 2020, 741, 137094 CrossRef CAS.
- M. Barbatti, M. Ruckenbauer, F. Plasser, J. Pittner, G. Granucci, M. Persico and H. Lischka, Wiley Interdiscip. Rev.: Comput. Mol. Sci., 2014, 4, 26–33 CAS.
- X.-D. Kai-Xiong and J. Hong, Chin. J. Spectrosc. Lab., 2012, 1, 058 Search PubMed.
- I. Obot, D. Macdonald and Z. Gasem, Corros. Sci., 2015, 99, 1–30 CrossRef CAS.
- M. Yar, M. A. Hashmi and K. Ayub, RSC Adv., 2020, 10, 31997–32010 RSC.
- N. M. O'boyle, A. L. Tenderholt and K. M. Langner, J. Comput. Chem., 2008, 29, 839–845 CrossRef.
- Y. Xu and S.-P. Gao, Int. J. Hydrogen Energy, 2012, 37, 11072–11080 CrossRef CAS.
- S. Muhammad, H. Xu, Z. Su, K. Fukuda, R. Kishi, Y. Shigeta and M. Nakano, Dalton Trans., 2013, 42, 15053–15062 RSC.
| This journal is © The Royal Society of Chemistry 2021 |

