 Open Access Article
The effects of Sn content on the corrosion behavior and mechanical properties of Mg–5Gd–3Y–xSn–0.5Zr alloys
Qian Zhanga,
Quanan Li *ab and
Xiaoya Chenab
aSchool of Materials Science and Engineering, Henan University of Science and Technology, Luoyang, 471023, China. E-mail: liquanan2016@163.com
bProvincial and Ministerial Co-construction of Collaborative Innovation Center for Non-ferrous Metal New Materials and Advanced Processing Technology, Luoyang, 471023, China
First published on 5th January 2021
Abstract
The effects of Sn content on the corrosion behavior and mechanical properties of Mg–5Gd–3Y–0.5Zr alloy were studied by SEM, EDS, XRD and electrochemical testing. Results show that Sn can refine the grain size and promote the precipitation of Mg5(Gd,Y) phase. When the Sn content is 1.5–2 wt%, a needle-like Mg2Sn phase will be precipitated in the alloy. Mg–5Gd–3Y–1Sn–0.5Zr alloy had the lowest corrosion rate, which is attributed to the barrier effect of the grain boundary and dispersed Mg5(Gd,Y) phase on corrosion. However, the Mg2Sn phase formed by excessive Sn addition will accelerate galvanic corrosion. At the same time, Mg–5Gd–3Y–1Sn–0.5Zr alloy had best mechanical properties. In 1.5Sn and 2Sn alloys, the cleavage effect of the needle-like Mg2Sn phase on the matrix reduced mechanical properties.
1. Introduction
Magnesium alloy, known as a “green engineering material of the 21st century”, is the third most common metallic material after steel and aluminum alloys. It is not only a very ideal lightweight structural material with low density, high specific strength and specific stiffness, but also has excellent electromagnetic shielding performance, excellent damping and vibration reduction effect, good thermal conductivity and facile recycling. It can be used as a functional material and environmental protection material. Therefore, magnesium alloy has an important application value and broad development prospect in the fields of national defense and military industry, automobile manufacturing, electronic products, etc.1–3 However, due to its more negative equilibrium potential (−2.37 V) than that of aluminum, magnesium is reactive and readily corrodes, especially in solutions containing Cl−.4 Due to the low reduction potential of magnesium, micro galvanic corrosion will occur between the magnesium matrix and impurities or the second phase in corrosive medium. The existence of Fe, Ni, Cu and Co has an adverse effect on the corrosion resistance of magnesium alloy. These impurities act as local cathodes to promote anodic dissolution of the magnesium matrix.5 In addition, during the corrosion process, the corrosion product film formed on the surface of magnesium alloy is loose and porous, with poor adhesion and stability.6 Therefore, the corrosion resistance of magnesium alloy can be improved in the following three ways: (1) reducing the content of heavy metal impurities; (2) decreasing the potential of intermetallic compounds; (3) stabilizing the passivation film on the surface of magnesium alloy.7 In the past research, alloying,8 surface modification,9 heat treatment10 and plastic deformation process11 were used to improve the corrosion resistance of magnesium alloys. Alloying is the most effective measure to improve the corrosion resistance, including Al, Zn, Ca, Sr, RE (rare earth elements), Sn and Si. However, the mining and refining of rare earth elements cause serious damage to renewable energy resources, and rare earth elements are often more expensive, which increase the cost of the alloy.12 Al and Zn are most widely used to improve the corrosion resistance of magnesium alloys.13,14 In recent years, Sn has attracted increasing attention due to its grain refinement and the reduction of the hydrogen evolution rate of magnesium alloys.15 In addition, compared with rare earth elements and alkaline earth elements, Sn has a low melting point (232 °C), and can be added in the form of pure metal in alloy melting, with less consumption and a simple addition method, thus reducing the raw material and production costs.16,17 Solutions of some elements with higher electrode potentials (cathode) in a magnesium matrix, such as Al, Zn and Sn with standard electrode potentials of −2.31 V, −1.25 V and −1.07 V, respectively, can reduce the chemical activity of magnesium alloy, effectively prevent the hydrogen evolution reaction of the cathode and decrease the amount of hydrogen evolution. When magnesium matrix as the anode cannot provide enough electrons for micro couple pair consumption, magnesium alloy can have more noble metal properties (i.e. inert).18 The results of Han's study19 showed that Sn element can improve the corrosion resistance of Mg–0.8% Si alloy by 14–17 times; also, the refinement effect of Sn/Y composite on the microstructure of Mg–0.8% Si alloy is better than that of single addition, and the corrosion resistance is further improved by nearly 18 times. The results of Park et al.20 showed that Sn can stabilize the Mg(OH)2 corrosion product film on the surface of Mg–5Al–1Zn alloy. Zeng et al.21 reported that the cathodic reaction and hydrogen evolution rate of Sn alloy were reduced due to its high hydrogen overpotential. However, Song et al.22 reported that the addition of Sn significantly reduced the corrosion resistance of AM70 castings. Liu et al.23 considered that the effect of Sn on the corrosion resistance of magnesium alloy depends on the amount of Sn dissolved in the matrix and the morphology and distribution of Mg2Sn phase. If the most of Sn is dissolved in the matrix, the corrosion resistance is improved. However, when the amount of Sn is significant, Mg2Sn phase will be precipitated. Due to the high potential of Mg2Sn phase, it will act as a local cathode phase in the corrosion process, thus accelerating the corrosion rate.24,25 Yu et al.26 found that an alloy containing 1 wt% Sn had better corrosion resistance in Mg–3Al–xSn alloy. However, when the Sn content is 1.4 wt%, the intermetallic compound Mg2Sn will be precipitated. The results of SKPFM showed that the Mg2Sn phase precipitated from Mg–3Al–xSn alloy has a higher potential, which is 100 mV higher than that of the matrix. Therefore, it can accelerate the micro galvanic corrosion and significantly reduce the total corrosion resistance. Moreover, the maximum solid solubility of Sn in magnesium is 14.8 wt% at 561 °C and 0.45 wt% at 200 °C. Therefore, Sn is a typical alloy element with a precipitation strengthening effect. The addition of Sn element to pure magnesium can improve the alloy structure and refine the grain size. Meanwhile, Mg2Sn particles with a high melting point (about 777 °C) are generated. The phase is dispersed on the grain boundaries, hindering dislocation slip and pinning the grain boundaries; this improves the mechanical properties of magnesium alloy at room temperature and high temperature.27,28It can be seen that in previous reports, most of the studies were based on magnesium alloys containing Al and Zn, and data on the effects of Sn on the corrosion resistance of Mg–RE alloys are very scarce. In industrial production and application, the corrosion resistance of magnesium alloys containing Sn cannot be ignored, especially in some solutions containing Cl−. However, according to current research, the breadth and depth of this research are far from sufficient. At present, there is no consensus on the effects of Sn on the corrosion behavior of magnesium alloys, and many factors must be considered comprehensively. The mechanism of influencing the corrosion behavior of Sn-containing magnesium alloys, the corrosion mode of magnesium alloys containing Sn in NaCl solution (seawater environment) and the influence of Mg–RE phase content on the corrosion behavior of Sn-containing magnesium alloys have not been studied and discussed in depth. Therefore, the corrosion behavior of the aged Mg–5Gd–3Y–xSn–0.5Zr (0, 0.5, 1, 1.5, 2 wt%) alloys was studied by electrochemical testing, immersion testing, SEM observation and X-ray photoelectron spectroscopy. According to the analysis of the experimental results, the addition amount of Sn was optimized, and the corrosion mechanism of the Mg–5Gd–3Y–xSn–0.5Zr alloys was clarified. These research results will provide a reference for the development of magnesium alloys with excellent mechanical properties, high corrosion resistance and low cost.
2. Experimental materials and methods
2.1. Alloy preparation
Mg–5Gd–3Y–0.5Zr (wt%; the following are wt% unless otherwise specified) alloy was used as the matrix alloy. The addition amounts of Sn were 0 wt%, 0.5 wt%, 1 wt%, 1.5 wt%, and 2 wt%, and these alloys were named 0Sn, 0.5Sn, 1Sn, 1.5Sn, and 2Sn, respectively. The actual compositions of the alloys after melting were determined by the ICP method, as shown in Table 1. The raw materials for preparing the alloys were magnesium ingot (purity is 99.95%), Mg–30% Gd, Mg–30% Y and Mg–30% Zr master alloy, Sn (chemical purity). Before addition, all raw materials were dried at 200 °C for 2 hours, and the oxide scale was removed by grinding on a grinder. Considering the burning loss in the melting process, the alloy was added and then melted under the protection of SF6 and CO2 (volume ratio 1![[thin space (1/6-em)]](https://www.rsc.org/images/entities/char_2009.gif) :
:![[thin space (1/6-em)]](https://www.rsc.org/images/entities/char_2009.gif) 99). After the alloy was completely dissolved, it was heated to 750 °C for 5 min and then poured into a metal ingot which had been preheated to 250 °C to obtain as-cast Mg–5Gd–3Y–xSn–0.5Zr alloy. The ingot was placed in a box furnace for solution treatment (510 °C × 12 h), quenched in 60 °C in warm water after being discharged from the furnace, and finally aged (225 °C × 12 h). The melted ingots were cut by wire to obtain metallographic samples (10 mm × 10 mm × 10 mm), static weight loss method samples (10 mm × 10 mm × 10 mm) and electrochemical test samples (10 mm × 10 mm × 10 mm).
99). After the alloy was completely dissolved, it was heated to 750 °C for 5 min and then poured into a metal ingot which had been preheated to 250 °C to obtain as-cast Mg–5Gd–3Y–xSn–0.5Zr alloy. The ingot was placed in a box furnace for solution treatment (510 °C × 12 h), quenched in 60 °C in warm water after being discharged from the furnace, and finally aged (225 °C × 12 h). The melted ingots were cut by wire to obtain metallographic samples (10 mm × 10 mm × 10 mm), static weight loss method samples (10 mm × 10 mm × 10 mm) and electrochemical test samples (10 mm × 10 mm × 10 mm).
| Nominal composition | Actual composition (wt%) | ||||
|---|---|---|---|---|---|
| Gd | Y | Sn | Zr | Mg | |
| Mg–5Gd–3Y–0.5Zr | 5.25 | 2.73 | 0 | 0.51 | Bal. |
| Mg–5Gd–3Y–0.5Sn–0.5Zr | 5.36 | 3.27 | 0.45 | 0.37 | Bal. |
| Mg–5Gd–3Y–1Sn–0.5Zr | 5.06 | 3.09 | 1.12 | 0.42 | Bal. |
| Mg–5Gd–3Y–1.5Sn–0.5Zr | 4.79 | 3.15 | 1.53 | 0.49 | Bal. |
| Mg–5Gd–3Y–2Sn–0.5Zr | 5.18 | 2.94 | 1.91 | 0.56 | Bal. |
2.2. Microstructure analysis
After inlaying, rough grinding, fine grinding and polishing, the samples were then etched with an etchant consisting of 4 ml nitric acid (purity 65.0–68.0%) and 96 ml ethanol (purity ≥ 99.7%); the microstructures of the alloys were observed using an Axio Vert.A1 optical microscope (OM), and the microstructures and compositions of the alloys were observed by a JSM-IT100 scanning electron microscope (SEM) and energy dispersive spectrometer (EDS). The phase composition was identified by a D8 Advance X-ray diffractometer (XRD), and Cu K alpha rays were used.2.3. Corrosion tests
| v = (W1 − W2)/A × t | (1) |
2.4. Mechanical property testing
A bar sample was used for the tensile tests and processed according to GB 6397-1986 for metal tensile test specimens. The experimental equipment was a SHIMADZU AG-I 250KN precision universal electronic tensile testing machine. The tensile rate was 1 mm min−1, and the tensile temperature was 25 °C (room temperature). Three samples were tested under each experimental condition, and the average value of the tests was used as the final result. The test indexes include tensile strength σb, yield strength σ0.2 and elongation δ.3. Results and analysis
3.1. Phases and microstructures
Fig. 1 shows the optical microstructures of the aged Mg–5Gd–3Y–xSn–0.5Zr alloys. It can be seen from Fig. 1 that the microstructure of 0Sn alloy is mainly composed of equiaxed α-Mg matrix and some black second phase, and the grain size is about 95 μm. When the Sn content is 0.5 wt%, the microstructure of the alloy is refined, and the grain size is about 92 μm. With increasing Sn content, the grain size of the alloy decreased to 57 μm (1Sn alloy), 76 μm (1.5Sn alloy) and 52 μm (2Sn alloy). It was found that29 there are two indispensable conditions in the process of grain refinement: one is good segregation ability of the solute elements, and the other is a sufficient number of nucleation particles. The difference between the melting point of Sn (232 °C) and that of Mg (651 °C) is large; therefore, the segregation of Sn is obvious. During the solidification process, solute redistribution occurs, and elements such as Sn, Gd and Y are pushed to the front of the solid–liquid interface; this forms a solute element enrichment zone and results in the undercooling of the alloy composition. With increasing Sn content, the undercooling degree of the composition increases, which hinders the growth of the α-Mg structure. The enrichment of Sn, Gd and Y elements at the solid–liquid interface provides a large number of nucleation particles. However, the high content of solute elements on the liquid side will prevent Mg atoms from entering the crystal; therefore, the grains are unable to grow further. The precipitates of 0–0.5 wt% Sn alloy are mainly distributed at the grain boundaries, and only a small amount are distributed in the interior of the grains. With increasing Sn content, the content of precipitates in the grains increases, which is caused by the competition between RE and Sn in the magnesium matrix. When the Sn content is increased, the RE element in the magnesium matrix decreases, which promotes the precipitation of Mg5(Gd,Y) phase.30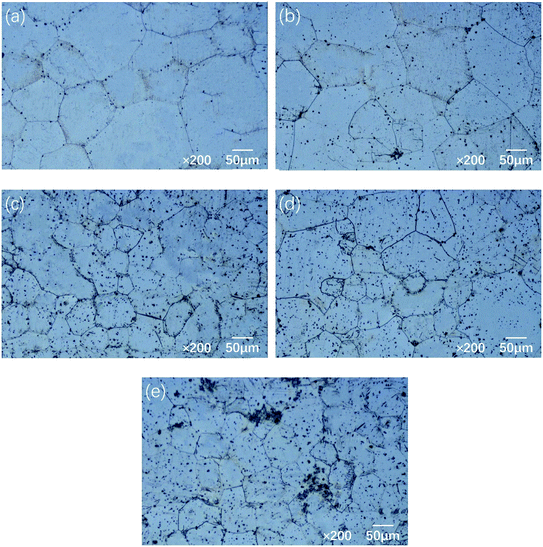 | ||
| Fig. 1 Optical microstructures of the Mg–5Gd–3Y–xSn–0.5Zr alloys: (a) x = 0, (b) x = 0.5, (c) x = 1, (d) x = 1.5, (e) x = 2. | ||
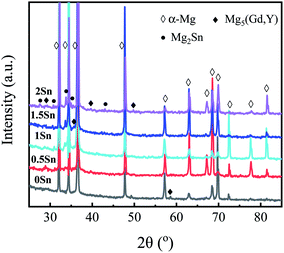
Fig. 2 shows the SEM images of Mg–5Gd–3Y–0.5Zr alloy with different Sn contents. With increasing Sn content, the number of precipitated phases increases gradually, and the morphology changes. The precipitated phases in the 0Sn, 0.5Sn and 1Sn alloys are mainly in the form of small squares, while the precipitated phases in the 1.5Sn alloys are needle-like. Henes et al.31 found that the orientation relationship between Mg2Sn phase precipitated from Mg–Sn alloy and the matrix depends on the aging temperature. When the temperature is 200–250 °C, the phase relationship between the matrix and Mg2Sn phase is (0001)Mg//(111)Mg2Sn, and the Mg2Sn phase forms rod shapes on the (0001)Mg surface. When the content of Sn is excessive, the coarsening of precipitated phases can be observed in the 2Sn alloy. XRD analysis of the Mg–5Gd–3Y–xSn–0.5Zr alloys was carried out to reveal the phase compositions of Mg–RE–Sn alloy. As shown in Fig. 3, the phase composition of the Mg–5Gd–3Y–xSn–0.5Zr alloys is mainly α-Mg phase, Mg5(Gd,Y) and Mg2Sn phase.
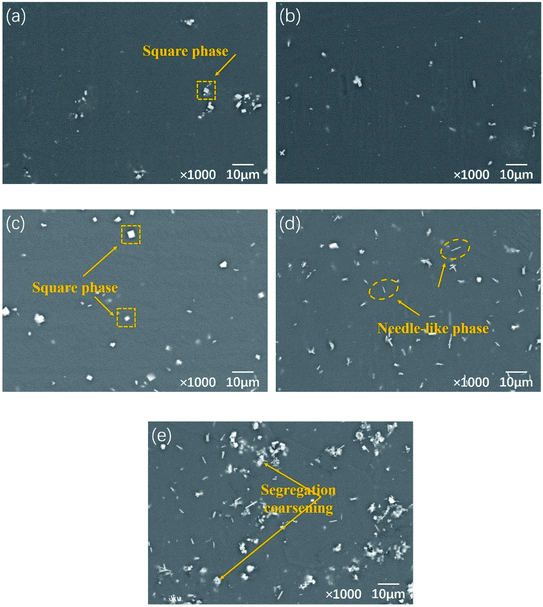 | ||
| Fig. 2 SEM microstructures of the Mg–5Gd–3Y–xSn–0.5Zr alloys: (a) x = 0, (b) x = 0.5, (c) x = 1, (d) x = 1.5, (e) x = 2. | ||
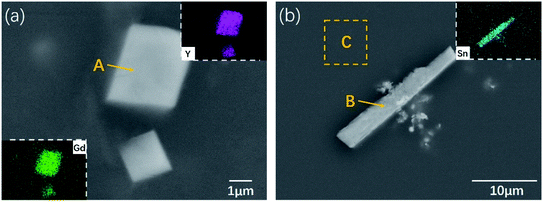
In order to study the existing forms and distributions of the alloying element Sn in the Mg–5Gd–3Y–0.5Zr alloy, the chemical compositions of the phases in the alloys were analyzed by SEM-EDS. Fig. 4 shows the SEM images of the main precipitates in the Mg–5Gd–3Y–0.5Zr–1.5Sn alloy, and Table 2 shows the EDS analysis results at points A and B and region C in Fig. 4. He et al.32 determined by TEM and EDS that these square phases are Mg5(Gd,Y) phase with FCC structure. This result was confirmed in the research report of Liang et al.33 It can be seen from the EDS results in Table 2 that the atomic ratio of Mg, Gd + Y at point A is close to 5![[thin space (1/6-em)]](https://www.rsc.org/images/entities/char_2009.gif) :
:![[thin space (1/6-em)]](https://www.rsc.org/images/entities/char_2009.gif) 1. Due to the similar chemical properties and atomic radii of Gd and Y, they can coexist randomly in the solid solution and precipitated phase of the alloy.34 Therefore, the composition of the square phase can be determined as Mg5(Gd,Y) by XRD analysis. The β′ phase precipitated in the peak-aged Mg–Gd–Y–Zr alloy reported in ref. 32–34 was not detected in the XRD results; this may be due to the fact that the β′ phase precipitated under the peak aging process is an unstable phase with a very small size, so it cannot be detected due to its large inversion zone, wide diffraction peak and low diffraction intensity. It can be seen from Fig. 2(d) and (e) that a large number of needle-like precipitated phases appear in the alloys when the Sn content is 1.5–2 wt%. According to the EDS results at point B in Fig. 4, the needle-like precipitated phase mainly contains Mg and Sn elements as well as a small amount of Y element, which can be determined as Mg2Sn. In addition to Mg2Sn and Mg24Y5, the phase equilibria of α-Mg/MgSnY and α-Mg/Sn3Y5 exist in the Mg-rich angle, and both compounds have high thermal stability.35–37 However, MgSnY and Sn3Y5 phases were not detected in this study, which may be related to the low contents of Sn and Y in the matrix. Therefore, the Mg–5Gd–3Y–xSn–0.5Zr alloys mainly consist of α-Mg matrix, square Mg5(Gd,Y) phase and needle-like Mg2Sn phase. There are small amounts of Sn, Gd and Y elements in the α-Mg matrix in the C region. According to a previous report,37 Sn and Y cannot coexist in the α-Mg matrix, which is inconsistent with the results observed in this study. It is believed that the reason may be the uneven distribution of elements in the matrix. At 200 °C, the solid solubilities of Gd and Y in magnesium are 3.8 wt% (0.61 at%) and 2.2 wt% (0.61 at%), respectively; meanwhile, the EDS data are far from this level, which also indicates that Sn can promote the precipitation of Gd and Y in the form of intermetallic compounds. In order to further analyze the distribution of Sn in the alloy, Fig. 4 also shows the EDXS element diagram of the 1.5Sn alloy. A large amount of Sn is uniformly distributed in the matrix alloy and tends to accumulate into needle-like precipitated phases. It can be inferred that Sn exists in the matrix alloy in the form of a solid solution. When the content of Sn is too high, Sn-rich intermetallic compounds will be formed.
1. Due to the similar chemical properties and atomic radii of Gd and Y, they can coexist randomly in the solid solution and precipitated phase of the alloy.34 Therefore, the composition of the square phase can be determined as Mg5(Gd,Y) by XRD analysis. The β′ phase precipitated in the peak-aged Mg–Gd–Y–Zr alloy reported in ref. 32–34 was not detected in the XRD results; this may be due to the fact that the β′ phase precipitated under the peak aging process is an unstable phase with a very small size, so it cannot be detected due to its large inversion zone, wide diffraction peak and low diffraction intensity. It can be seen from Fig. 2(d) and (e) that a large number of needle-like precipitated phases appear in the alloys when the Sn content is 1.5–2 wt%. According to the EDS results at point B in Fig. 4, the needle-like precipitated phase mainly contains Mg and Sn elements as well as a small amount of Y element, which can be determined as Mg2Sn. In addition to Mg2Sn and Mg24Y5, the phase equilibria of α-Mg/MgSnY and α-Mg/Sn3Y5 exist in the Mg-rich angle, and both compounds have high thermal stability.35–37 However, MgSnY and Sn3Y5 phases were not detected in this study, which may be related to the low contents of Sn and Y in the matrix. Therefore, the Mg–5Gd–3Y–xSn–0.5Zr alloys mainly consist of α-Mg matrix, square Mg5(Gd,Y) phase and needle-like Mg2Sn phase. There are small amounts of Sn, Gd and Y elements in the α-Mg matrix in the C region. According to a previous report,37 Sn and Y cannot coexist in the α-Mg matrix, which is inconsistent with the results observed in this study. It is believed that the reason may be the uneven distribution of elements in the matrix. At 200 °C, the solid solubilities of Gd and Y in magnesium are 3.8 wt% (0.61 at%) and 2.2 wt% (0.61 at%), respectively; meanwhile, the EDS data are far from this level, which also indicates that Sn can promote the precipitation of Gd and Y in the form of intermetallic compounds. In order to further analyze the distribution of Sn in the alloy, Fig. 4 also shows the EDXS element diagram of the 1.5Sn alloy. A large amount of Sn is uniformly distributed in the matrix alloy and tends to accumulate into needle-like precipitated phases. It can be inferred that Sn exists in the matrix alloy in the form of a solid solution. When the content of Sn is too high, Sn-rich intermetallic compounds will be formed.
| Elements | A (at%) | B (at%) | C (at%) |
|---|---|---|---|
| Mg | 80.2 | 77.2 | 99.0 |
| Gd | 6.0 | — | 0.5 |
| Y | 13.8 | 1.4 | 0.2 |
| Sn | — | 21.4 | 0.3 |
| Zr | — | — | — |
3.2. Corrosion resistance
| Alloys | Ecorr (V) | Icorr (A cm−2) |
|---|---|---|
| 0Sn | −1.5237 | 1.248 × 10⁻⁴ |
| 0.5Sn | −1.5169 | 9.752 × 10⁻⁵ |
| 1Sn | −1.5345 | 4.169 × 10⁻⁵ |
| 1.5Sn | −1.4727 | 1.085 × 10⁻⁴ |
| 2Sn | −1.4825 | 1.284 × 10⁻⁴ |
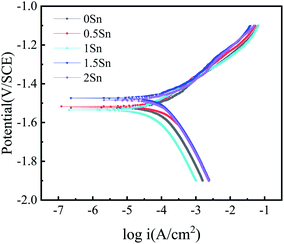
When the Sn content is between 0–1 wt%, the self-corrosion potential of the alloy changes little; however, when the content of Sn continues to increase, it can be seen that the self-corrosion potential of the 1.5Sn alloy moves 51 mV compared with that of the 0Sn alloy. When Sn is dissolved into the matrix, the Ecorr of the matrix increases and the driving force of corrosion is reduced. To some extent, this result indicates that Sn element can reduce the corrosion tendency of magnesium alloy; however, the corrosion potential is not a thermodynamic parameter. Therefore, the positive movement of the self-corrosion potential cannot accurately reflect the change in the corrosion resistance of the magnesium alloy.18
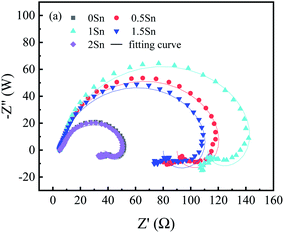
The EIS of the Mg–5Gd–3Y–xSn–0.5Zr alloys were simulated by zsimpwin software, and the equivalent circuit was R(QR(LR)), as shown in Fig. 7. In these studies, Rs is the solution resistance; CPEdl is a constant phase angle element; Rct is the charge transfer resistance; L is the inductance, which represents the breakdown of the local protective film on the alloy surface; and RL is the inductance resistance. The polarization resistance Rp is an important parameter for evaluating corrosion resistance, and 1/Rp is considered to be proportional to the corrosion rate.44,45 According to the fitting results of the equivalent circuit, Rp can be calculated as follows:
| Rp = Rs + (Rct × RL)/(Rct + RL) | (2) |
It can be seen from Fig. 6(a) that the fitting curve is basically consistent with the test curve, indicating that the proposed equivalent circuit is reasonable and basically reflects the corrosion process of the alloy and the corrosion characteristics of the alloy at various stages. The values of each circuit element simulated by the equivalent circuit shown in Fig. 7 are shown in Table 4. It can be seen from the simulated values of each element in Table 4 that n of the constant phase angle element is close to 1, which can be regarded as the electric double layer capacitance of the anode. Compared with the charge transfer resistance Rct, the solution resistance Rs is very small and negligible. With the addition of Sn, the Rp value first increases and then decreases, and 1Sn alloy has the largest Rp value. This shows that the dissolution rate of 1Sn alloy is the lowest and the corrosion resistance is the best.
| Alloys | Rs (Ω cm2) | CPEdl (×10−5 μF cm−2 Hz1−n) | n | Rct (Ω cm2) | RL (Ω cm2) | L (H cm2) | Rp (Ω cm2) | Error (%) |
|---|---|---|---|---|---|---|---|---|
| 0Sn | 5.423 | 7.952 | 0.8147 | 51.05 | 91.70 | 4.538 | 38.22 | 4.668 |
| 0.5Sn | 4.676 | 3.619 | 0.8765 | 124.9 | 270.9 | 12.35 | 90.16 | 3.264 |
| 1Sn | 5.115 | 3.573 | 0.8803 | 151.0 | 371.1 | 14.70 | 107.33 | 4.107 |
| 1.5Sn | 4.700 | 4.115 | 0.8694 | 114.6 | 220.3 | 10.08 | 80.08 | 3.515 |
| 2Sn | 5.493 | 9.682 | 0.8092 | 50.53 | 85.08 | 3.759 | 37.19 | 4.866 |
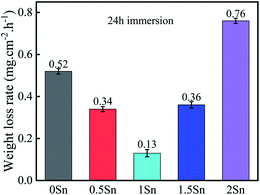 | ||
| Fig. 8 Corrosion rates of the Mg–5Gd–3Y–xSn–0.5Zr alloys immersed in 3.5% NaCl solution at 25 °C for 24 h. | ||
Fig. 9 shows SEM images of the Mg–5Gd–3Y–xSn–0.5Zr alloys after being immersed in 3.5% NaCl solution for 24 h to remove corrosion products. It can be seen from Fig. 9(a) that the corrosion surface of the 0Sn alloy presents a complete honeycomb structure, which is mainly related to the uneven distribution of the alloy elements. Along the grain boundary in the intragranular direction, the alloying elements present a gradually decreasing distribution, and the corresponding Ecorr value decreases, resulting in a gradual increase in the corrosion rate; therefore, the alloy corrosion surface presents a honeycomb structure. It can be seen from Fig. 9(b) and (c) that the addition of Sn can significantly improve the corrosion resistance of the alloy. The corrosion characteristics of the alloy are mainly filiform corrosion, accompanied by a large number of uncorroded surfaces. The filiform corrosion characteristics on the corrosion surface of the alloy may be caused by the different order in which the corrosion product protective film appears. The area where the protective film is formed first is not susceptible to corrosion; therefore, the corrosion extends along the edge of the protective film and continues to spread. When the Sn content is 1 wt%, the filiform corrosion is the lowest and the alloy surface is relatively smooth. The reason why a proper amount of Sn improves the corrosion resistance of Mg–5Gd–3Y–0.5Zr alloy can be attributed to the following three points (combining the microstructures of the Mg–5Gd–3Y–xSn–0.5Zr alloys, the morphologies after corrosion and the changes in the corrosion rate of the alloys with different Sn contents; a schematic of the corrosion model was established, as shown in Fig. 10):
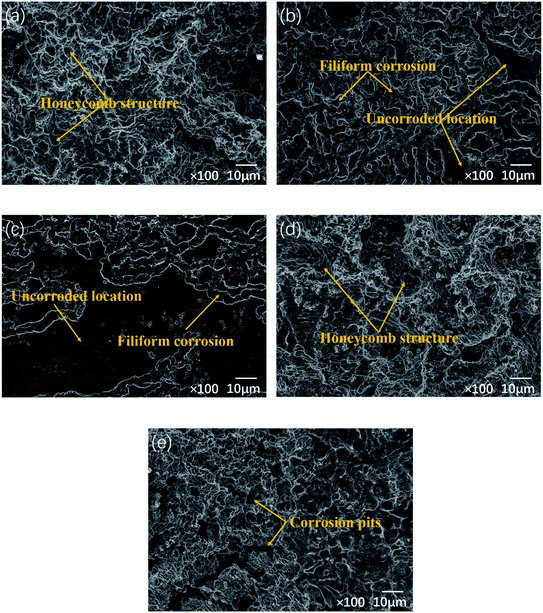 | ||
| Fig. 9 Surface morphologies of the Mg–5Gd–3Y–xSn–0.5Zr alloys without corrosion products: (a) x = 0, (b) x = 0.5, (c) x = 1, (d) x = 1.5, (e) x = 2. | ||
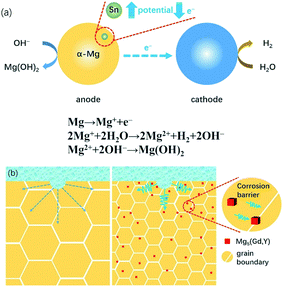 | ||
| Fig. 10 Schematics of the corrosion mechanism of the Mg–5Gd–3Y–xSn–0.5Zr alloys in NaCl solution: (a) microgalvanic corrosion; (b) corrosion barrier. | ||
(1) The electrode potential of Sn is −0.136 V, which is much higher than that of Mg (−2.73 V). When Sn is dissolved in the Mg matrix, the chemical activity of Mg alloy can be reduced. As shown in Fig. 10(a), when the magnesium matrix as the anode cannot provide enough electrons for microgalvanic corrosion consumption, the corrosion driving force decreases and the corrosion tendency of the magnesium matrix itself is inhibited. In addition, Sn has a high hydrogen evolution overpotential, and at a higher hydrogen evolution overpotential, less hydrogen is produced.46 The XRD analysis shows that the Mg5(Gd,Y) phase in 0–1 wt% Sn alloy increases; however, the diffraction peak of Mg2Sn is not obvious. Therefore, Sn element exists in the magnesium matrix in the form of a solid solution, which can improve the self-corrosion potential and corrosion resistance of the magnesium alloy. The content and types of solid solution elements in the magnesium matrix also play an important role in the equilibrium potential of the magnesium matrix; however, the overall corrosion resistance of the alloy should be considered in combination with other factors. Song et al.47 found that the second phase of β-Mg17Al12 in over-aged AZ91D alloy can inhibit corrosion propagation; however, the matrix becomes more active and is more easily corroded due to the large amount of precipitation of Al element in the matrix.
(2) The slow diffusion of the solute Sn leads to a decrease of the average grain size of α-Mg, and the grain boundary region increases with decreasing average grain size. The increase of the grain boundary area improves the chemical uniformity of the magnesium alloy, and the higher the chemical uniformity of the alloy, the better its corrosion resistance. The increase of the grain boundary region will reduce the concentration of impurities in the alloy and weaken the adverse effects of impurities on the corrosion resistance of the alloy.48 Moreover, the grain boundary can act as a barrier to inhibit the propagation of corrosion between grains, as shown in Fig. 10(b). This is because for magnesium alloy, the grain interior always presents an anode relative to the grain boundary, and the corrosion inside the grain is always prior to the grain boundary.49 Therefore, when corrosion occurs at a certain point in the grain, due to the barrier of the grain boundary, these small corrosion points will not gather, thus preventing the corrosion propagation. Cao et al.50 studied the effects of 11 elements, including Al and Sn, on the corrosion resistance of magnesium alloy. It was found that the corrosion rate of magnesium alloy was lower when the grain size and the second phase size in the structure became smaller.
(3) Mg–RE phase played a dual role in the corrosion process, which depended on its volume fraction and distribution state. When the content of precipitates is high and the distance between them is close, they will play an effective role in preventing corrosion. However, if they show large-scale segregation and the distance between them is far, the microgalvanic corrosion will be intensified and the corrosion resistance of the alloy will be reduced. Combined with the XRD and SEM images, Sn can promote the precipitation of Mg5(Gd,Y) phase. In previous research reports,51–53 it could be seen that the smaller size and uniform distribution of Mg–RE phase can effectively enhance the corrosion resistance of magnesium alloy. This is because the Mg–RE phase has better corrosion resistance and can act as a corrosion barrier. The more uniform the distribution of Mg–RE phase, the lower the activity of the microcell formed between α-Mg and the precipitated phase, and the slower the corrosion rate (see Fig. 10(b)). In the study by Morales et al.,54 it was also found that a stable protective film was formed on the alloy surface due to the addition of RE element, which significantly inhibited the corrosion propagation. However, in this study, it can be seen from the polarization curve that the passivation zone of the anode branch is not obvious, which may be caused by the low contents of Gd and Y in the magnesium matrix. This also demonstrates that Sn can reduce the solid solubility of Gd and Y in magnesium.
It can be seen from Fig. 9(d) that a large local honeycomb structure appears on the corrosion surface of 1.5Sn alloy. This is because the Sn element content increases and segregates toward the grain boundary, and the Ecorr difference between the grain boundary and the inside of the grain becomes larger; thereby, the galvanic corrosion is intensified and the size of the honeycomb structure increases. With increasing Sn content, Mg2Sn is formed in the Mg–5Gd–3Y–xSn–0.5Zr alloys. Because of its high potential, Mg2Sn will act as a cathode phase to intensify local galvanic corrosion. Ding et al.55 studied the corrosion resistance of Mg–5Zn–4Al–xSn; they showed that Mg2Sn increased the possibility of pitting corrosion and promoted the dissolution of the matrix. Liu et al.56 reported that the corrosion mode and corrosion rate of Sn-containing magnesium alloys were related to the amount of Mg2Sn phase in the matrix and the concentration of Sn. When Sn exists in the form of Mg2Sn intermetallic compound, the corrosion mode is pitting corrosion, which accelerates the corrosion rate. When most of the Sn is dissolved in the matrix, the corrosion mode is filiform corrosion, and the corrosion rate decreases. It can be seen from Fig. 9(e) that as the Sn content continues to increase, filiform corrosion develops along the grain boundary and extends to the whole alloy surface. Excessive addition of Sn will lead to segregation and coarsening of the Mg2Sn phase, which will enhance the power of electrochemical corrosion between Mg2Sn and the surrounding magnesium matrix. The galvanic corrosion will be intensified, and the corrosion will spread along the area around the Mg2Sn phase, forming a large area of serious corrosion pits. During the corrosion period and the process of removing corrosion products, the falling off of the precipitated phase also led to enlargement and increased depth of the corrosion pits. Moreover, the uneven distribution of precipitates enables the corrosion medium to easily invade the matrix at the loose places, thus reducing the corrosion resistance of the alloy. There are many large and deep corrosion pits on the corrosion surface of the 2Sn alloy, which shows the worst corrosion resistance; this corresponds to the results of the weight loss tests. It should be noted that the honeycomb corrosion morphology of the 2Sn alloy is not serious; however, the corrosion pits is deep, and the corrosion pit extends longitudinally to the interior of the alloy. In practical processing and application, corrosion with this feature readily causes more serious impacts on the products. The longitudinal corrosion rate of pitting corrosion in the 2Sn alloy is obviously higher than that in the transverse direction. The segregation of Mg2Sn phase and the magnesium matrix forms a large number of corrosion microcells. The corrosion rate is large, and the corrosion pit contacts the Mg2Sn phase in the lower layer. At this time, the corrosion pit will preferentially corrode at this place, and the corrosion pit develops along the depth of Mg2Sn phase. A large amount of corrosion products accumulated and blocked the corrosion hole, which hindered the ion exchange between the environment inside the hole and the outside, forming a blocked battery; this led to the autocatalytic effect and further intensified the pitting corrosion. In the solution containing Cl−, the magnesium base is corroded prior to the precipitated phase because of its anode. When the pitting corrosion is serious, a part of the matrix is preferentially dissolved, and the precipitates distributed in the grain boundary will fall off under the action of gravity due to the lack of surrounding support, which will aggravate the corrosion degree of the alloy and increase the weight loss rate.
3.3. Mechanical properties
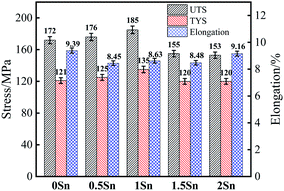
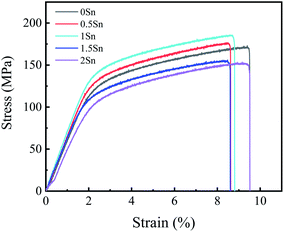
When Sn element is added to Mg–RE alloy, the morphology of the precipitated phase depends on the content of Sn element. When the content of Sn is small, the precipitates are mostly needle-like; when the content of Sn is excessive or even greater than that of RE, massive amounts of second phase will be precipitated in the Mg–RE–Sn alloy.57 Lim et al.57 found that the needle-like precipitate has a low-symmetry crystal structure, and EDS analysis showed that the atomic stoichiometric ratio of the needle-like precipitate is close to Mg3RE1Sn1; also, it was found that the needle-like precipitate could not effectively hinder the dislocation slip. The needle-like precipitates in this study are similar to those reported in Mg–Ce–Sn57 and Mg–Dy–Sn58 alloys; however, there are some differences in the compositions of the precipitates. As far as the present report is concerned, there is no consistent expression for the needle-like precipitate structure.Due to the promotion of Sn in the precipitation of Mg5(Gd,Y) phase, the square Mg5(Gd,Y) phase is dispersed in the matrix, which is helpful to improve the mechanical properties. According to the Hall–Petch formula, σy = σ0 + Kyd−1/2,59 where σ0 and Ky are material constants at a certain experimental temperature and strain rate and d is the average grain diameter. Therefore, the smaller the grain size, the higher the yield strength of the alloy, and the mechanical properties of magnesium alloy can be obviously improved by fine grain strengthening. Fine grains can also play a role in adjusting the deformation during the tensile process. It can be seen from Fig. 11 and 12 that the strength and plasticity of the 1Sn alloy remained at a high level.
When plastic deformation occurs, the movement of dislocations will be hindered by the precipitated phase and bend around it. When the external force increases further, dislocation loops will be formed which contain particles of the second phase. When the dispersion of the second phase increases, the number of dislocation loops increases correspondingly, and the strengthening effect on the alloy is more obvious. However, due to the excessive addition of Sn, needle-like precipitates appear in the 1.5Sn alloy; this places the stress concentration of the alloy under load, forming a crack source in the grains and grain boundaries and reducing the mechanical properties. According to the mechanical condition of the second phase particle separating from the matrix interface, σ ∝ d−1,60 where σ is the tensile stress required for the second phase particle to separate from the interface and d is the diameter of the second phase particle. Therefore, the larger the size of the second phase, the more readily it separates from the matrix interface and forms micropores there, leading to crack propagation.
4. Conclusion
(1) When the content of Sn is 0–1 wt%, Sn first dissolves in the α-Mg matrix, which plays a role in refining the grains and promoting the precipitation of Mg5(Gd,Y) phase. Needle-like Mg2Sn phase precipitates when excess Sn is added.(2) With increasing Sn content, the weight loss first decreases and then increases. The grain boundaries and dispersed Mg5(Gd,Y) phase can prevent corrosion. The 1Sn alloy has the minimum corrosion current density and the maximum polarization resistance, which indicates that it has the best corrosion resistance; the potential of the Mg2Sn phase in the 1.5Sn and 2Sn alloys is higher, and it can be used as local cathode to accelerate microgalvanic corrosion.
(3) Grain refinement and dispersed Mg5(Gd,Y) phase lead to the best comprehensive mechanical properties of the 1Sn alloy. In the 1.5Sn and 2Sn alloys, the cleavage effect of the needle-like Mg2Sn phase on the matrix will reduce the mechanical properties.
Author contributions
Qian Zhang: investigation, writing – original draft. Quanan Li: writing – review & editing. Xiaoya Chen: writing – review & editing.Conflicts of interest
The authors declare no conflict interest.Acknowledgements
This project is sponsored by the National Natural Science Foundation of China (No. 51571084).References
- J. Xu, Q. L. Yang, M. S. Javed, Y. L. Gong, M. K. Aslam and C. G. Chen, RSC Adv., 2017, 7, 5880 RSC.
- X. L. Cao, Q. Y. Ren, Y. K. Yang, X. L. Hou, Y. B. Yan, J. Hu, H. D. Deng, D. L. Yu, W. Lan and F. S. Pan, RSC Adv., 2020, 10, 35480 RSC.
- Y. L. Xu, F. Gensch, Z. Ren, K. U. Kainer and N. Hort, Prog. Nat. Sci., 2018, 28, 724 CrossRef CAS.
- K. Gusieva, C. H. J. Davies, J. R. Scully and N. Birbilis, Int. Mater. Rev., 2015, 60, 169 CrossRef CAS.
- G. Song and A. Atrens, Adv. Eng. Mater., 2003, 5, 837 CrossRef CAS.
- Z. Qiao, Z. Shi, N. Hort, N. I. Zainal Abidin and A. Atrens, Corros. Sci., 2012, 61, 185 CrossRef CAS.
- P. Metalnikov, G. Ben-Hamu, D. Eliezer and K. S. Shin, J. Alloys Compd., 2019, 777, 835 CrossRef CAS.
- H. S. Brar, J. P. Ball, I. S. Berglund, J. B. Allen and M. V. Manuel, Acta Biomater., 2013, 9, 5331 CrossRef CAS.
- X. U. Li-Ping, E. L. Zhang and K. Yang, Trans. Nonferrous Met. Soc. China, 2012, 22, 2014 CrossRef.
- Y. Lu, A. R. Bradshaw, Y. L. Chiu and I. P. Jones, J. Alloys Compd., 2014, 614, 345 CrossRef CAS.
- X. B. Zhang, Z. X. Ba, Z. Z. Wang, Y. J. Wu and Y. J. Xue, Mater. Lett., 2016, 163, 250 CrossRef CAS.
- J. She, F. S. Pan, H. H. Hu, H. C. Pan, A. T. Tang, K. Song, Z. W. Yu and S. Q. Luo, Prog. Nat. Sci.: Mater. Int., 2015, 25, 267 CrossRef CAS.
- H. J. Kim, B. Kim, S. M. Baek, S. D. Sohn, H. J. Shin, H. Y. Jeong, C. D. Yim, B. S. You, H. Y. Ha and S. S. Park, Corros. Sci., 2015, 95, 133 CrossRef CAS.
- N. D. Nam, M. Mathesh, T. V. Le and H. T. Nguyen, J. Alloys Compd., 2014, 616, 662 CrossRef CAS.
- L. D. Hou, Z. Li, H. Zhao, Y. Pan, S. Pavlinich, X. W. Liu, X. L. Li, Y. F. Zheng and L. Li, J. Mater. Sci. Technol., 2016, 32, 874 CrossRef CAS.
- H. M. Liu, Y. G. Chen, Y. B. Tang, D. Huang and Y. Li, Rare Met. Mater. Eng., 2006, 35, 1912 CAS.
- M. Zhang, W. Z. Zhang, G. Z. Zhu and K. Yu, Trans. Nonferrous Met. Soc. China, 2007, 17, 1428 CrossRef CAS.
- H. Y. Ha, J. Y. Kang, S. G. Kim, B. Kim, S. S. Park, C. D. Yim and B. S. You, Corros. Sci., 2014, 82, 369 CrossRef CAS.
- S. Han, PhD thesis, South China University of Technology, Guangzhou, China, 2019.
- K. C. Park, B. H. Kim, H. Kimura, Y. H. Park and I. M. Park, Mater. Trans., 2010, 51, 472 CrossRef CAS.
- R. C. Zeng, Z. Jin, W. J. Huang, W. Dietzel and K. E. Wei, Trans. Nonferrous Met. Soc. China, 2006, 16, 763 CrossRef.
- G. L. Song, Effect of tin modification on corrosion of AM70 magnesium alloy, Corros. Sci., 2009, 51, 2063 CrossRef CAS.
- X. Liu, D. Shan, Y. Song, R. Chen and E. Han, Electrochim. Acta, 2011, 56, 2582 CrossRef CAS.
- H. Y. Ha, J. Y. Kang, J. Yang, D. Y. Chang and B. S. You, Corros. Sci., 2016, 102, 355 CrossRef CAS.
- S. Moon and Y. Nam, Corros. Sci., 2012, 65, 494 CrossRef CAS.
- Z. C. Yu, Q. F. Huang, W. T. Zhang, C. Luo and L. Chasssagne, Mater. Res. Express, 2020, 7, 076505 CrossRef CAS.
- H. Zengin, Y. Turen, H. Ahlatci, Y. Sun and A. C. Karaoglanli, Trans. Nonferrous Met. Soc. China, 2019, 29, 1413 CrossRef CAS.
- D. Fang, X. M. Cheng, Y. Y. Li and Z. Sun, RSC Adv., 2016, 6, 96327 RSC.
- H. M. Liu, Y. G. Chen, Y. B. Tang, S. H. Wei and G. Niu, J. Alloys Compd., 2007, 440, 122 CrossRef CAS.
- X. Dong, J. Fu, J. Wang and Y. Yang, Mater. Des., 2013, 51, 567 CrossRef CAS.
- S. Henes and V. Gerold, Z. Metallkd., 1962, 53, 743 CAS.
- S. M. He, X. Q. Zeng, L. M. Peng, X. Gao, J. F. Nie and W. J. Ding, J. Alloys Compd., 2007, 427, 316 CrossRef CAS.
- S. Q. Liang, D. K. Guan, L. Chen, Z. H. Gao, H. X. Tang, X. T. Tong and R. Xiao, Mater. Des., 2011, 32, 361 CrossRef CAS.
- S. M. He, PhD thesis, Shanghai Jiao Tong University, Shanghai, China, 2007.
- H. D. Zhao, G. W. Qin, Y. P. Ren, W. L. Pei, D. Chen and Y. Guo, J. Alloys Compd., 2009, 481, 140 CrossRef CAS.
- H. D. Zhao, G. W. Qin, Y. P. Ren, W. L. Pei, D. Chen and Y. Guo, J. Alloys Compd., 2010, 509, 627 CrossRef.
- H. D. Zhao, G. W. Qin, Y. P. Ren, W. L. Pei, D. Chen and Y. Guo, Trans. Nonferrous Met. Soc. China, 2010, 20, 493 CrossRef.
- G. L. Song, Corros. Sci., 1999, 41, 249 CrossRef CAS.
- G. L. Song, A. Atrens, D. St John, X. Wu and J. Nairn, Corros. Sci., 1997, 39, 1981 CrossRef CAS.
- J. G. He, J. B. Wen, L. M. Sun, J. W. Gao and D. H. Li, Trans. Nonferrous Met. Soc. China, 2015, 25, 150 CAS.
- X. J. Cui, X. Z. Lin, C. H. Liu, R. S. Yang, X. W. Zheng and M. Gong, Corros. Sci., 2015, 90, 402 CrossRef CAS.
- M. Anik and I. M. Gunesdogdu, Mater. Des., 2010, 31, 3100 CrossRef CAS.
- N. D. Nam, W. C. Kim, J. G. Kim, K. S. Shin and H. C. Jung, Corros. Sci., 2009, 51, 2942 CrossRef CAS.
- T. Zhang, G. Z. Meng, Y. W. Shao, Z. Y. Cui and F. H. Wang, Corros. Sci., 2011, 53, 2934 CrossRef CAS.
- J. Chen, J. Q. Wang, E. H. Han and W. Ke, Corros. Eng., Sci. Technol., 2009, 46, 277 CrossRef.
- C. Jihua, C. Zhenhua, Y. Hongge, Z. Fuquan and C. Yingliang, Mater. Corros., 2008, 59, 934 CrossRef CAS.
- G. Song, A. L. Bowles and D. H. St John, Mater. Sci. Eng., A, 2004, 366, 74 CrossRef.
- S. T. Vagge and V. S. Raja, Surf. Coat. Technol., 2009, 203, 3092 CrossRef CAS.
- D. Song, A. B. Ma, J. H. Jiang, P. H. Lin, D. H. Yang and J. F. Fan, Corros. Sci., 2011, 53, 362 CrossRef CAS.
- F. Cao, Z. Shi, G. L. Song, M. Liu, M. S. Dargusch and A. Atrens, Corros. Sci., 2015, 90, 176 CrossRef CAS.
- T. T. Zhang, H. W. Cui, Q. R. Jia, X. L. Cui, R. Feng, Y. K. Pan and J. Zhao, Nonferrous Met. Eng., 2019, 9, 22 Search PubMed.
- Y. Bai and C. J. Xu, Foundry Technol., 2017, 38, 2335 Search PubMed.
- J. Y. Zhang, M. Xu, X. Y. Teng and M. Zuo, J. Alloys Compd., 2016, 4, 319 CAS.
- E. D. Morales, E. Ghali, N. Hort, W. Dietzel and K. U. Kainer, Mater. Sci. Forum, 2003, 419, 867 Search PubMed.
- J. Ding, X. Liu, Y. J. Wang, W. Huang and B. S. Xu, Materials, 2019, 12, 2069 CrossRef CAS.
- X. B. Liu, D. Y. Shan, Y. W. Song, R. S. Chen and E. H. Han, Electrochim. Acta, 2011, 56, 2582 CrossRef CAS.
- H. K. Lim, S. W. Sohn, D. H. Kim, J. Y. Lee, W. T. Kim and D. H. Kim, J. Alloys Compd., 2008, 454, 515 CrossRef CAS.
- H. M. Liu, Y. G. Chen, Y. B. Tang, D. M. Huang and G. Niu, Mater. Sci. Eng., A, 2006, 437, 348 CrossRef.
- W. Yuan, S. K. Panigrahi, J. Q. Su and R. S. Mishra, Scr. Mater., 2011, 65, 994 CrossRef CAS.
- J. Chen, Q. A. Li, K. J. Li, X. F. Li, X. Y. Zhang and Q. Zhang, Rare Met. Mater. Eng., 2010, 39, 1180 CAS.
| This journal is © The Royal Society of Chemistry 2021 |

