 Open Access Article
Comparison of fractal dimensions from nitrogen adsorption data in shale via different models
Kouqi Liu *a,
Mehdi Ostadhassan*b,
Ho Won Jang
 *c,
Natalia V. Zakharova
 a and
Mohammadreza Shokouhimehr
 *c
*c
aDepartment of Earth and Atmospheric Sciences, Central Michigan University, Mount Pleasant, MI 48859, USA. E-mail: liu3k@cmich.edu
bKey Laboratory of Continental Shale Hydrocarbon Accumulation and Efficient Development, Ministry of Education, Northeast Petroleum University, Daqing, 163318, China. E-mail: mehdi.ostadhassan@nepu.edu.cn
cDepartment of Materials Science and Engineering, Research Institute of Advanced Materials, Seoul National University, Seoul 08826, Republic of Korea. E-mail: hwjang@snu.ac.kr; mrsh2@snu.ac.kr
First published on 8th January 2021
Abstract
The roughness of pore surfaces in shale reservoirs can affect the fluid flow, which makes it necessary to be characterized. Fractal dimension, a key component in fractal geometry, can be used to describe the surface irregularities. In this paper, we evaluated and compared the fractal dimensions of several shale samples with three major fractal models based on nitrogen adsorption isotherms. The results showed that Frenkel–Halsey–Hill (FHH), Neimark, and Wang–Li models all can be applied for fractal dimension characterization of shale samples. From theoretical thermodynamics, these three models should be considered identical based on the FHH equation. However, the experimental data obtained from these samples showed that the fractal dimensions that are derived from the Neimark model and Wang–Li model are the same while a discrepancy was observed with the results from the FHH model. The difference in the fractal dimensions in the experimental data among these three models was attributed to the micropore structures. It was found that as the micropore surface area or the micropore volume increases in the samples, the difference in the fractal dimensions would increase as well. If the number of micropores present in the samples is limited, all three models can become suitable for fractal dimension calculation in shale samples, otherwise, the Neimark or Wang–Li model is preferred.
1. Introduction
Unconventional reservoir resources now play an important role in total energy consumption.1,2 For the unconventional reservoirs with low porosity and permeability, the surface roughness of the pores in a porous media would impact fluid flow and heat transfer.3 During oil production in two-phase flow in the subsurface, the roughness of the pore surface can affect the phase distribution of flow regimes and lead to variations in phase relative permeability.4 Knowing the surface roughness of the pores can assist in understanding oil/gas flow which requires characterization of pore surface precisely. Traditional techniques to evaluate surface roughness are based on the concept of isolated deviations from a planar surface area. However, this method has the difficulty of identifying a small number of structural parameters that can describe the roughness for a variety of purposes that can accurately reflect the pore surface.5 Fractal dimensionality proposed by Avnir et al. (1984) is an excellent method to characterize the complex surface geometries that can overcome the limitations of traditional methods. Avnir et al. (1984) found that at the molecular level, the surface of most materials reflects a fractal behavior with fractal dimension varying from 2 to 3, where 2 means a perfectly smooth surface and 3, significantly rough and a disordered surface.6The fractal dimension of a solid surface can be determined with a variety of techniques such as porosimetry,7 electrochemical methods,8 small angle scattering,9 and adsorption isotherms.5 With some assumptions, adsorption isotherms have been employed for the surface roughness characterization in different materials such as carbon blacks,10 carbon fibers,11 and aerosol particles.12 Up to date, various fractal models based on the adsorption isotherms have been proposed and applied to analyze the fractal dimension of the solid surface such as the fractal version of Frenkel–Halsey–Hill (FHH) model which is based on the classical FHH theory,5,13 the thermodynamic model which was developed by Neimark14 and the Wang–Li model.15
Nitrogen adsorption nowadays has become a standard technique for pore structure analysis in shale characterization.16–21 In addition to its applicability for pore size distribution, pore surface area and pore volume determination, researchers have combined fractal dimension analysis with adsorption isotherms to obtain more information from the pores.22–26 Based on the literature, nearly all the authors utilized the FHH model solely to characterize fractal dimensions of shale rocks without any strong basis. Thus, to date, the following questions have remained unanswered: is the FHH model the most suitable one for fractal dimension analysis of shale rocks? If not, which model would provide us with more accurate understanding of this complicated rock pore structures?
This study attempts to answer the above questions. In order to do so, 19 shale samples from the Bakken Formation have been collected and gas adsorption data has been acquired from these samples. In the next step, several mainstream fractal models were employed to analyze the adsorption isotherms. Based on the comparison of the results, some suggestions have been made to select the best fractal model for analyzing the pore structure of shale samples in the future.
2. Basic fractal theory of the gas adsorption
2.1. FHH fractal theory
In order to apply the classical Frenkel–Halsey–Hill (FHH) theory on fractal materials, Pfeifer et al. (1989, 1984)5,13 assumed the film of the fluid that is absorbed on the sample surface could be regarded as a number of spheres with radius z representing a monolayer. Thus, the volume of this absorbing film is equal to the number n(z) of spheres multiplied by the sphere volume (≈z3). Therefore, the fractal dimension can be defined by assuming that n(z) is proportional to z−D. Then the amount of fluid that is adsorbed as a function of the film thickness z on a fractal surface is given by:| N ∝ z3−D | (1) |
z ∝ [−ln![[thin space (1/6-em)]](https://www.rsc.org/images/entities/char_2009.gif) X]−1 X]−1
| (2) |
ln![[thin space (1/6-em)]](https://www.rsc.org/images/entities/char_2009.gif) N = a + (D − 3) N = a + (D − 3)![[thin space (1/6-em)]](https://www.rsc.org/images/entities/char_2009.gif) ln(−ln ln(−ln![[thin space (1/6-em)]](https://www.rsc.org/images/entities/char_2009.gif) X) X)
| (3) |
2.2. Neimark fractal theory
Neimark took a thermodynamic approach to determine the surface fractal dimension of a porous solid (DN) which can be expressed by:28| S(r) ∼ r2−DN | (4) |
ln![[thin space (1/6-em)]](https://www.rsc.org/images/entities/char_2009.gif) S(r) = k − (DN − 2) S(r) = k − (DN − 2)![[thin space (1/6-em)]](https://www.rsc.org/images/entities/char_2009.gif) ln ln![[thin space (1/6-em)]](https://www.rsc.org/images/entities/char_2009.gif) r r
| (5) |
 | (6) |
 | (7) |
2.3. Wang–Li fractal theory
Considering the correlation between the area of the fractal surface and the volume circumscribed by the surface that is proposed by Mandelbrot (1982),28 Wang and Li calculated the fractal dimension based on the following equation:15| S(r) = k0DWLr2−DWLVDWL/3 | (8) |
| V = [Ns − N(X)]VL | (9) |
Combining eqn (5) and (7)–(9), the following expression can be obtained:
ln![[thin space (1/6-em)]](https://www.rsc.org/images/entities/char_2009.gif) A(X) = l + DWL A(X) = l + DWL![[thin space (1/6-em)]](https://www.rsc.org/images/entities/char_2009.gif) ln ln![[thin space (1/6-em)]](https://www.rsc.org/images/entities/char_2009.gif) B(X) B(X)
| (10) |
 | (11) |
3. Materials and methods
19 shale aliquots were collected from the Bakken Formation from the cores that are retrieved from several wells drilled in the Williston Basin, ND. These shale samples are mainly composed of quartz and clay minerals. All samples were crushed into powders with grain size less than 250 μm (60 mesh). Data from samples #17, #18, and #19 were analyzed previously and presented in the study by Liu et al. (2017)26 and some of the other samples are studied by Abarghani et al. (2020) who focused more on the organic chemistry.29 Prior to the adsorption measurements, all powders were degassed for 8 hours at 110 °C to remove moisture and volatiles that may exist in the sample pores. Low-pressure nitrogen adsorption experiment was performed on a Micromeritics® Tristar II apparatus at 77 K. The gas adsorption quantity was monitored and recorded as the relative pressure increases from 0.01 to 1. The outcome will provide us with the pore structure information such as the pore size distribution (PSD) while micropore volume and micropore surface area can be quantified using the Barrett–Joyner–Halenda (BJH) model.304. Results
4.1. Nitrogen adsorption isotherms
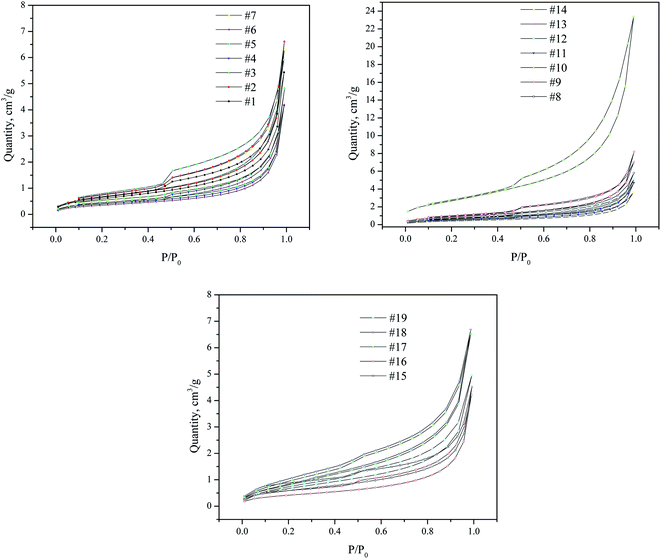
Gas adsorption isotherms of all shale samples can be seen in Fig. 1. At extremely low relative pressures, the amount of adsorbed gas will depend on the micro-pore volume. As the relative pressure increases, multilayer adsorption will be formed. Hence, the knee-bend shape of the adsorption isotherms in the figure can indicate the transition from the monolayer adsorption to the onset of the poly-molecular adsorption. At the higher relative pressure, the gas in the mesopores and macropores starts to condense. During the desorption stage, as the relative pressure decreases, the quantity of the gas adsorbed will decrease. Therefore, the desorption curve will coincide with the adsorption curve which is caused by the “tensile strength effect”, creating hysteresis loops. The hysteresis loops that is observed in all isotherms indicate the existence of mesopores. Based on the recommendations by the International Union of Pure and Applied Chemistry,31 the shape of these hysteresis loops show the major pores in these samples are slit shaped. The difference between the gas adsorption quantities at the same relative pressure of these samples explains that these samples have different pore structures, such as pore volume and pore surface area.4.2. FHH fractal model
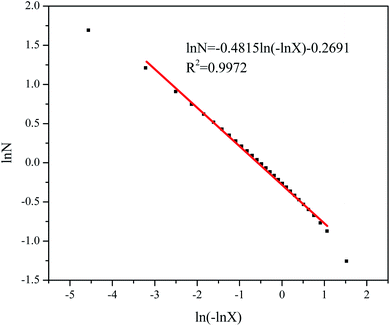
The adsorption branch of the isotherms in these samples was used for fractal dimension analysis. Fig. 2 displays the FHH fractal analysis of sample #1 as a representative of all samples. In a certain P/P0 range (0.0085–0.961) (mainly the poly-molecular adsorption region), linear correlations exist between ln(−ln![[thin space (1/6-em)]](https://www.rsc.org/images/entities/char_2009.gif) X) and ln
X) and ln![[thin space (1/6-em)]](https://www.rsc.org/images/entities/char_2009.gif) N which demonstrate that eqn (3) can be applied for fractal dimension calculations and analysis. Table 1 summarizes fractal dimensions of all samples with corresponding relative pressure intervals. The fractal dimension of all samples was calculated between 2 and 3, meaning those values are in a reasonable data range (2–3) based on the literature. Sample #15 has the largest DFHH values while sample #17 the smallest value. The P/P0 range of these samples based on the FHH analysis varies between 0.10–0.88, showing that most measured data points in the experiment can be utilized for the FHH fractal analysis (Table 1).
N which demonstrate that eqn (3) can be applied for fractal dimension calculations and analysis. Table 1 summarizes fractal dimensions of all samples with corresponding relative pressure intervals. The fractal dimension of all samples was calculated between 2 and 3, meaning those values are in a reasonable data range (2–3) based on the literature. Sample #15 has the largest DFHH values while sample #17 the smallest value. The P/P0 range of these samples based on the FHH analysis varies between 0.10–0.88, showing that most measured data points in the experiment can be utilized for the FHH fractal analysis (Table 1).
| Samples | DFHH | P/P0 range scale | R2 |
|---|---|---|---|
| #1 | 2.519 | 0.085–0.961 | 0.997 |
| #2 | 2.506 | 0.084–0.956 | 0.999 |
| #3 | 2.529 | 0.056–0.953 | 0.998 |
| #4 | 2.519 | 0.053–0.990 | 0.995 |
| #5 | 2.491 | 0.092–0.959 | 0.998 |
| #6 | 2.503 | 0.055–0.990 | 0.999 |
| #7 | 2.506 | 0.055–0.959 | 0.998 |
| #8 | 2.507 | 0.050–0.956 | 0.996 |
| #9 | 2.506 | 0.084–0.957 | 0.996 |
| #10 | 2.487 | 0.050–0.954 | 0.998 |
| #11 | 2.534 | 0.055–0.991 | 0.996 |
| #12 | 2.528 | 0.080–0.958 | 0.996 |
| #13 | 2.498 | 0.048–0.958 | 0.995 |
| #14 | 2.499 | 0.094–0.956 | 0.997 |
| #15 | 2.565 | 0.084–0.959 | 0.992 |
| #16 | 2.495 | 0.053–0.956 | 0.999 |
| #17 | 2.435 | 0.113–0.883 | 0.984 |
| #18 | 2.454 | 0.112–0.884 | 0.981 |
| #19 | 2.522 | 0.071–0.935 | 0.990 |
4.3. Neimark fractal model
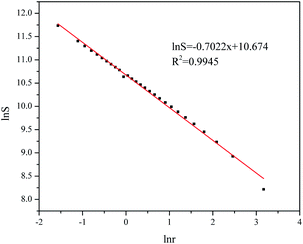
Neimark fractal model was employed to estimate the fractal dimension of shale samples in this study as well. Fig. 3 shows the analysis result of sample #1 as a general representation. If relative pressure value is measured between the 0.010 and 0.961, linear correlations could exist between ln![[thin space (1/6-em)]](https://www.rsc.org/images/entities/char_2009.gif) S and ln
S and ln![[thin space (1/6-em)]](https://www.rsc.org/images/entities/char_2009.gif) r, indicating the suitability of the application of the Neimark fractal model in the calculation of fractal dimension of the samples. The Neimark fractal dimensions DN of all samples can be seen in Table 2. All fractal dimensions are also measured in the reasonable interval (2–3) based on previous studies and recommendation.4 The P/P0 range which can be utilized in Neimark theory is very similar as the P/P0 range in the FHH model. From Table 2, sample #18 was calculated with the largest fractal value while sample # 6 had the smallest fractal dimension value.
r, indicating the suitability of the application of the Neimark fractal model in the calculation of fractal dimension of the samples. The Neimark fractal dimensions DN of all samples can be seen in Table 2. All fractal dimensions are also measured in the reasonable interval (2–3) based on previous studies and recommendation.4 The P/P0 range which can be utilized in Neimark theory is very similar as the P/P0 range in the FHH model. From Table 2, sample #18 was calculated with the largest fractal value while sample # 6 had the smallest fractal dimension value.
| Samples | DN | P/P0 range scale | R2 |
|---|---|---|---|
| #1 | 2.702 | 0.010–0.961 | 0.994 |
| #2 | 2.631 | 0.010–0.956 | 0.997 |
| #3 | 2.619 | 0.010–0.953 | 0.996 |
| #4 | 2.498 | 0.010–0.953 | 0.989 |
| #5 | 2.696 | 0.010–0.959 | 0.993 |
| #6 | 2.495 | 0.055–0.959 | 0.991 |
| #7 | 2.680 | 0.010–0.991 | 0.995 |
| #8 | 2.702 | 0.010–0.956 | 0.995 |
| #9 | 2.718 | 0.010–0.957 | 0.994 |
| #10 | 2.743 | 0.053–0.921 | 0.993 |
| #11 | 2.591 | 0.010–0.959 | 0.996 |
| #12 | 2.742 | 0.010–0.958 | 0.993 |
| #13 | 2.747 | 0.011–0.958 | 0.990 |
| #14 | 2.687 | 0.010–0.956 | 0.995 |
| #15 | 2.804 | 0.010–0.959 | 0.992 |
| #16 | 2.539 | 0.010–0.956 | 0.994 |
| #17 | 2.866 | 0.011–0.832 | 0.988 |
| #18 | 2.898 | 0.010–0.883 | 0.994 |
| #19 | 2.882 | 0.011–0.884 | 0.986 |
4.4. Wang–Li model
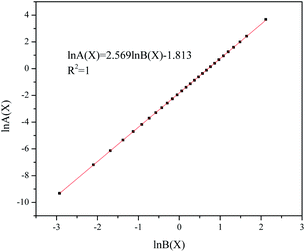
Fig. 4 shows the fractal analysis results of representative sample #1 based on the Wang–Li fractal model. If the relative pressure ranges from 0.010 to 0.961, linear correlations can be established between the ln![[thin space (1/6-em)]](https://www.rsc.org/images/entities/char_2009.gif) A(X) and ln
A(X) and ln![[thin space (1/6-em)]](https://www.rsc.org/images/entities/char_2009.gif) B(X). The fractal dimension values of all samples from this model also are found between 2 and 3 (Table 3), indicating that Wang–Li fractal model can also be applied in the fractal dimension calculation of our shale samples. Sample #4 and sample #6 have very close fractal dimension values and sample #17, #18, #19 have larger fractal dimension values compared with other samples, and these findings follow the results that are obtained by the Neimark model.
B(X). The fractal dimension values of all samples from this model also are found between 2 and 3 (Table 3), indicating that Wang–Li fractal model can also be applied in the fractal dimension calculation of our shale samples. Sample #4 and sample #6 have very close fractal dimension values and sample #17, #18, #19 have larger fractal dimension values compared with other samples, and these findings follow the results that are obtained by the Neimark model.
| Samples | DWL | P/P0 range scale | R2 |
|---|---|---|---|
| #1 | 2.569 | 0.010–0.961 | 1.000 |
| #2 | 2.517 | 0.010–0.956 | 1.000 |
| #3 | 2.528 | 0.010–0.953 | 1.000 |
| #4 | 2.392 | 0.010–0.958 | 0.999 |
| #5 | 2.540 | 0.010–0.959 | 1.000 |
| #6 | 2.408 | 0.010–0.959 | 0.999 |
| #7 | 2.556 | 0.010–0.959 | 1.000 |
| #8 | 2.564 | 0.010–0.959 | 1.000 |
| #9 | 2.589 | 0.010–0.957 | 1.000 |
| #10 | 2.627 | 0.010–0.954 | 1.000 |
| #11 | 2.473 | 0.010–0.959 | 1.000 |
| #12 | 2.596 | 0.010–0.958 | 1.000 |
| #13 | 2.586 | 0.011–0.958 | 1.000 |
| #14 | 2.549 | 0.010–0.956 | 1.000 |
| #15 | 2.666 | 0.010–0.959 | 1.000 |
| #16 | 2.425 | 0.010–0.956 | 1.000 |
| #17 | 2.782 | 0.011–0.883 | 0.999 |
| #18 | 2.820 | 0.010–0.883 | 0.998 |
| #19 | 2.866 | 0.011–0.934 | 0.995 |
5. Discussions
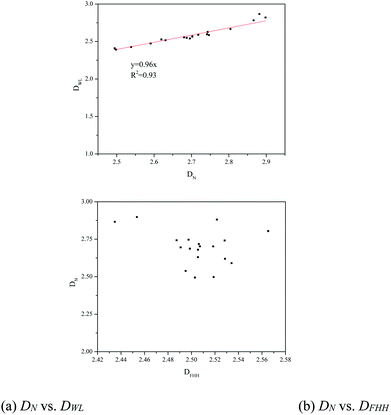
Considering Tables 1–3, it is concluded that the fractal dimensions of samples would vary based on the model that is used. It can be seen that the FHH fractal dimension varies between 2.435 (sample #17) to 2.565 (sample#15) which is within a smaller range compared to the Neimark model (2.495–2.898) and the Wang–Li model (2.392–2.866). Furthermore, comparing all shale samples in this study, the fractal dimension values of the samples are close based on the Neimark model and Wang–Li model which were not the case in the FHH model. Overall, the results show that it'd necessary to compare all mainstream fractal dimension performance in pore structure analysis and make an informed decision for future studies as which model is truly representing the samples nature.Fig. 5 is a simple correlation between the fractal dimensions of these three models. Linear correlations exist between the DN and DWL (Fig. 5a) with the slope of the curve close to unity. This is an indication that fractal dimensions from Neimark and Wang–Li model for these shale samples are almost similar. However, it can be seen that there isn't any meaningful correlation between DFHH and DN (Fig. 5b).
The fundamental dependence of FHH model is on the pore volume of the absorbing film and its relationship with the pore radius (eqn (3)) while Neimark method foster to relate the surface area of the absorbing film to the pore radius.32 Considering the Wang–Li model, the fundamental dependence of the theory is to correlate the pore volume of the absorbing film, pore surface area and the pore radius altogether. FHH model operates based on eqn (2) while Neimark and Wang–Li models are based on eqn (6) in a condensation regime. It should be note that both equations are very similar in their mathematical/physical format thus all the three models are based on Kelvin's equation.
In the condensation regime, concerning eqn (3), the FHH model can be written as:
| N = K[(ln(P0/P)]−(3−DFHH) | (12) |
The partial differentiation of eqn (12) can will become:
| dN = K(DFHH − 3)[ln(P0/P)]DFHH−4d[ln(P0/P)] | (13) |
Substituting dN in eqn (13) into eqn (6) ends in the following expression:
 | (14) |
In the next step, substituting r in eqn (7) to replace ln(P0/P), the following equation will be derived:
 | (15) |
 | (16) |
Through transforming eqn (15) and (16) into the double log format, the following is obtained:
 | (17) |
 | (18) |
Eqn (17) is representing the curve in Fig. 5 while the format of eqn (18) is similar to eqn (10). These findings confirm that from a theoretical point of view, the fractal dimension calculation equations provided by the Neimark and Wang–Li can be derived by combining the Kelvin equation and the FHH fractal model. FHH model can also be viewed as a model with thermodynamics basis. From the thermodynamics viewpoint, these three models should be identical in the applicability of the FHH equation.33
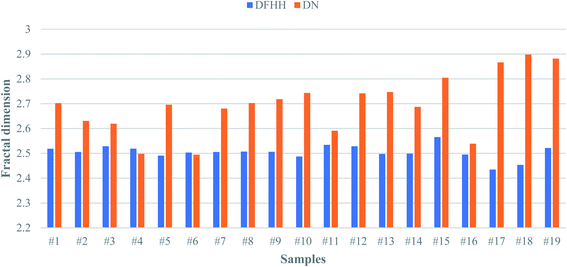
However, the discrepancy that is observed in the experimental data from these shale samples from each model does exist. In order to find the answer to this important question, one should reconsider factors that introduce the difference in the data between among these models. Since the results from DN and DWL are very close, it was decided to only compare DN and DFHH in this study. Fig. 6 illustrates the histogram of fractal dimensions of from DN and DFHH of these shale samples. This figure explains that the DFHH and DN values from some of the samples are very close, for example, samples #4, #6, though the DFHH and DN values of samples # 17, sample #18 are notably different.
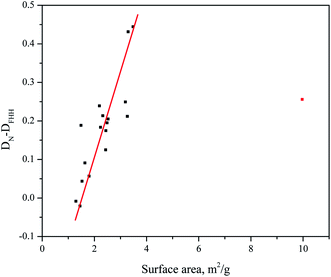
Sahouli et al. (1996)10 acquired FHH and Neimark model to study the fractal dimensions of commercial rubber grade carbon blacks. They found that the BET surface area can be used to explain the difference between the fractal dimensions that are calculated from different models. They argued if the BET surface area is large, the difference between the fractal dimensions would become significant. On the contrary, if the BET surface area is measured smaller, the fractal dimensions from these two methods will get closer to one another. In order to verify whether this theory is applicable to geomaterial samples as well, correlations between the BET surface area on the x-axis and the difference between the DN and DFHH (DN − DFHH) on the y-axis is plotted in Fig. 7. For the most samples, as the BET surface area increases, the difference between the DN and DFHH increases except sample #10 (the red point in Fig. 7). Therefore, it can be concluded that BET theory and its relationship with various outcomes by different fractal models that is proposed by Sahouli et al. (1996)10 cannot fully explain the factors that may cause the difference in fractal dimensions or at least fully explain such discrepancy on geomaterials.
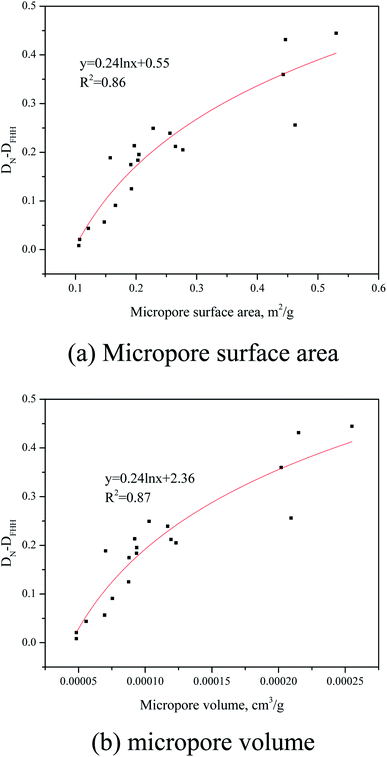
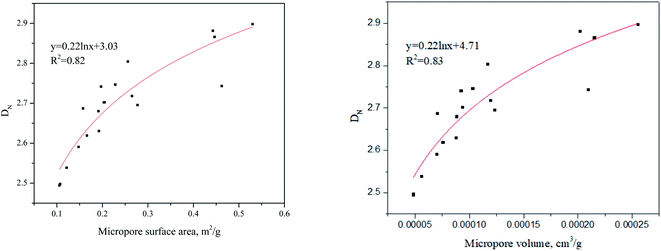
We further correlated the micropore structures (micropore volume and micropore surface area) and the DN − DFHH value which can be seen in Fig. 8. As the micropore surface area or the micropore volume increases in the samples, the value of DN − DFHH increases which fits the logarithmic law. This infers that in the shale samples, micropore structures could be responsible for the difference in fractal dimensions from these two different models.
6. Model selection
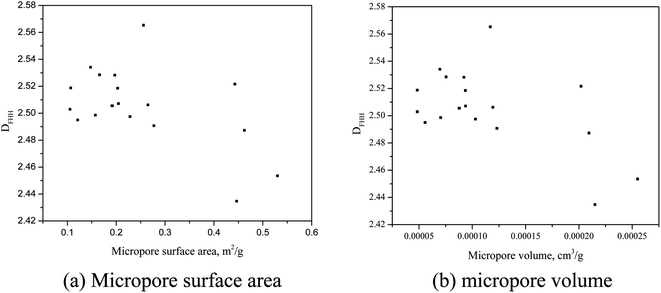
Considering the shale samples in this study, fractal dimensions from Wang–Li and Neimark model found to be similar and different from the FHH model results. As a result, Neimark and FHH models are compared in this section for further verifications. Based on the discussion earlier, both FHH and Neimark models are based on thermodynamics theories. Jaroniec et al. (1990)34 studied the gas adsorption behavior on fractal surfaces in heterogeneous microporous solids from the thermodynamics viewpoint and concluded that microstructures could affect the fractal dimensions outcome. The correlations between the DFHH, DN and the micropore surface area and micropore volume can be seen in Fig. 9 and 10, respectively. It can be seen that there isn't any clear correlation between the micropore surface area, micropore volume and DFHH (Fig. 9) while positive relationships can be established between the micropore structures and DN (Fig. 10). Collectively, this means that the DN would not only reflect the fractal dimension in the capillary condensation regime but also infers to the micropore information of geomaterials. This is found beyond the ability of FHH model.Based on the above discussion, it can be said, if micropores in the shale samples are not abundant, then either of the three models can be used and they will generate similar results. However, if shale sample or any geomaterial that has a fractal behavior has abundant micropores, the whole gas adsorption process will be a mixture of the poly-molecular and capillary condensation, thus DN and DWL which are affected by the micropores and the capillary condensation are preferred. Based on our previous studies, the micopores in the Bakken shale are mainly existing in the organic matter and clay minerals.29 If the Bakken shale samples have abundant organic matter and clay minerals, the DFHH will not be suitable for the characterization of pore structure. However, if the Bakken is free from huge quantities of clay minerals and organic matter, these three models can all be appropriate for analysis.
7. Conclusions
In this study, 19 shale samples were selected from the Bakken Formation and N2 adsorption experiments were performed to analyze their pore structures. Three different models (FHH model, Neimark model, and Wang–Li model) were employed to study and compare the fractal dimensions in these shale samples. The following few conclusions can be derived from this study:(1) The FHH, Neimark model and Wang–Li model all can be applied for fractal dimension analysis of shale samples. The fractal dimensions obtained from the Neimark and Wang–Li model are similar while the results are different from the fractal dimension values calculated from FHH model.
(2) The microstructures in the shale samples are the main reason to explain the disagreement of the fractal dimensions results from the Neimark and FHH models. It is concluded that a larger micropore surface area (or the micropore volume), will lead to the major discrepancy between these two aforesaid models.
(3) If there aren't a large number of micropores in the shale sample, all these three models can be applied for fractal dimension calculation of geomaterials.
(4) Ultimately, DN (or DWL) do not denote only the capillary condensation process in the pores but also infer to the micropore information which makes them preferred models to be used when micropores are abundant in the sample compare to DFHH.
Conflicts of interest
There are no conflicts to declare.Acknowledgements
The authors appreciate ND Core Library, Jeff Bader – the director and state geologist – as well as Kent Holland – library technician – for providing us with the samples. This research was supported by the National Research Foundation of Korea (NRF) funded by the Ministry of Science and ICT (2020M2D8A206983011). Furthermore, the financial supports of the Basic Science Research Program (2017R1A2B3009135) through the National 18 Research Foundation of Korea is appreciated.References
- B. Liu, Y. Yang, J. Li, Y. Chi, J. Li and X. Fu, Stress sensitivity of tight reservoirs and its effect on oil saturation: a case study of lower cretaceous tight clastic reservoirs in the Hailar Basin, Northeast China, J. Pet. Sci. Eng., 2020, 184, 106484 CrossRef CAS.
- B. Liu, Y. Song, K. Zhu, P. Su, X. Ye and W. Zhao, Mineralogy and element geochemistry of salinized lacustrine organic-rich shale in the middle Permian Santanghu Basin: implications for paleoenvironment, provenance, tectonic setting and shale oil potential, Mar. Pet. Geol., 2020, 120, 104569 CrossRef CAS.
- C. K. Stimpson, J. C. Snyder, K. A. Thole and D. Mongillo, Roughness effects on flow and heat transfer for additively manufactured channels, Journal of Turbomachinery, 2016, 138(5), 051008 CrossRef.
- A. A. Alturki, B. B. Maini and I. D. Gates, The effect of wall roughness on two-phase flow in a rough-walled Hele-Shaw cell, J. Pet. Explor. Prod. Technol., 2014, 4(4), 397–426 CrossRef CAS.
- P. Y. J. M. W. J. Pfeifer, Y. J. Wu, M. W. Cole and J. Krim, Multilayer adsorption on a fractally rough surface, Phys. Rev. Lett., 1989, 62(17), 1997 CrossRef CAS.
- D. Avnir, D. Farin and P. Pfeifer, Molecular fractal surfaces, Nature, 1984, 308(5956), 261–263 CAS.
- B. Zhang and S. Li, Determination of the surface fractal dimension for porous media by mercury porosimetry, Ind. Eng. Chem. Res., 1995, 34(4), 1383–1386 CrossRef CAS.
- A. Imre, T. Pajkossy and L. Nyikos, Electrochemical determination of the fractal dimension of fractured surfaces, Acta Metall. Mater., 1992, 40(8), 1819–1826 CrossRef CAS.
- G. Beaucage, Small-angle scattering from polymeric mass fractals of arbitrary mass-fractal dimension, J. Appl. Crystallogr., 1996, 29(2), 134–146 CrossRef CAS.
- B. Sahouli, S. Blacher and F. Brouers, Fractal surface analysis by using nitrogen adsorption data: the case of the capillary condensation regime, Langmuir, 1996, 12(11), 2872–2874 CrossRef CAS.
- I. M. Ismail and P. Pfeifer, Fractal analysis and surface roughness of nonporous carbon fibers and carbon blacks, Langmuir, 1994, 10(5), 1532–1538 CrossRef CAS.
- M. K. Wu, The roughness of aerosol particles: surface fractal dimension measured using nitrogen adsorption, Aerosol Sci. Technol., 1996, 25(4), 392–398 CrossRef CAS.
- P. Pfeifer, Fractal dimension as working tool for surface-roughness problems, Appl. Surf. Sci., 1984, 18(1–2), 146–164 CrossRef CAS.
- A. Neimark, A new approach to the determination of the surface fractal dimension of porous solids, Phys. A, 1992, 191(1–4), 258–262 CrossRef CAS.
- F. Wang and S. Li, Determination of the surface fractal dimension for porous media by capillary condensation, Ind. Eng. Chem. Res., 1997, 36(5), 1598–1602 CrossRef CAS.
- K. Liu, M. Ostadhassan and L. A. Sun, comprehensive pore structure study of the Bakken Shale with SANS, N2 adsorption and mercury intrusion, Fuel, 2019, 245, 274–285 CrossRef CAS.
- K. Liu, M. Ostadhassan and J. Zou, et al., Nanopore structures of isolated kerogen and bulk shale in Bakken Formation, Fuel, 2018, 226, 441–453 CrossRef CAS.
- C. R. Clarkson, N. Solano, R. M. Bustin, A. M. M. Bustin, G. R. L. Chalmers, L. He and T. P. Blach, Pore structure characterization of North American shale gas reservoirs using USANS/SANS, gas adsorption, and mercury intrusion, Fuel, 2013, 103, 606–616 CrossRef CAS.
- F. Yang, Z. Ning and H. Liu, Fractal characteristics of shales from a shale gas reservoir in the Sichuan Basin, China, Fuel, 2014, 115, 378–384 CrossRef CAS.
- Z. Gao, Y. Fan, Q. Xuan and G. Zheng, A review of shale pore structure evolution characteristics with increasing thermal maturities, Adv. Geo-Energy Res., 2020, 4(3), 247–259 CrossRef.
- R. Yang, A. Jia, Q. Hu, X. Guo and M. Sun, Particle size effect on water vapor sorption measurement of organic shale: one example from Dongyuemiao Member of Lower Jurassic Ziliujing Formation in Jiannan Area of China, Adv. Geo-Energy Res., 2020, 4(2), 207–218 CrossRef.
- Y. Yuan and R. Rezaee, Fractal analysis of the pore structure for clay bound water and potential gas storage in shales based on NMR and N2 gas adsorption, J. Pet. Sci. Eng., 2019, 177, 756–765 CrossRef CAS.
- Y. Li, Z. Wang, Z. Pan, X. Niu, Y. Yu and S. Meng, Pore structure and its fractal dimensions of transitional shale: a cross-section from east margin of the Ordos Basin, China, Fuel, 2019, 241, 417–431 CrossRef CAS.
- N. Peng, S. He, Q. Hu, B. Zhang, X. He, G. Zhai and R. Yang, Organic nanopore structure and fractal characteristics of Wufeng and lower member of Longmaxi shales in southeastern Sichuan, China, Mar. Pet. Geol., 2019, 103, 456–472 CrossRef CAS.
- B. Hazra, D. A. Wood, S. Kumar, S. Saha, S. Dutta, P. Kumari and A. K. Singh, Fractal disposition, porosity characterization and relationships to thermal maturity for the Lower Permian Raniganj basin shales, India, J. Nat. Gas Sci. Eng., 2018, 59, 452–465 CrossRef CAS.
- K. Liu, M. Ostadhassan and J. Zou, et al., Nanoscale pore structure characterization of the Bakken shale in the USA, Fuel, 2017, 209, 567–578 CrossRef CAS.
- P. Pfeifer and M. W. Cole, Fractals in surface science: scattering and thermodynamics of adsorbed films. II, New J. Chem., 1990, 14(3), 221–232 CAS.
- B. B. Mandelbrot, The fractal geometry of nature, WH Freeman, New York, 1982, vol. 2 Search PubMed.
- A. Abarghani, T. Gentzis, B. Liu, S. Khatibi, B. Bubach and M. Ostadhassan, Preliminary Investigation of the Effects of Thermal Maturity on Redox-Sensitive Trace Metal Concentration in the Bakken Source Rock, North Dakota, USA, ACS Omega, 2020, 5(13), 7135–7148 CrossRef CAS.
- E. P. Barrett, L. G. Joyner and P. P. Halenda, The determination of pore volume and area distributions in porous substances. I. Computations from nitrogen isotherms, J. Am. Chem. Soc., 1951, 73(1), 373–380 CrossRef CAS.
- J. Rouquerolb, D. Avnir and C. W. Fairbridge, et al., Recommendations for the characterization of porous solids (Technical Report), Pure Appl. Chem., 1994, 66(8), 1739–1758 Search PubMed.
- M. Jaroniec, Evaluation of the fractal dimension from a single adsorption isotherm, Langmuir, 1995, 11(6), 2316–2317 CrossRef CAS.
- Y. Yin, Adsorption isotherm on fractally porous materials, Langmuir, 1991, 7(2), 216–217 CrossRef CAS.
- M. Jaroniec, X. Lu, R. Madey and D. Avnir, Thermodynamics of gas adsorption on fractal surfaces of heterogeneous microporous solids, J. Chem. Phys., 1990, 92(12), 7589–7595 CrossRef CAS.
| This journal is © The Royal Society of Chemistry 2021 |

