 Open Access Article
Preparation of ZnO/two-layer self-doped black TiO2 nanotube arrays and their enhanced photochemical properties†
Dengji Yu,
Yunfang Zhang,
Fang Wang * and
Jun Dai
 *
*
Department of Physics, School of Science, Jiangsu University of Science and Technology, Zhenjiang 212003, China. E-mail: wangfang@just.edu.cn; daijun@just.edu.cn
First published on 8th January 2021
Abstract
Highly efficient TiO2 photoanodes can be achieved by enhancing electrical conductivity and improving charge separation and transfer. In this paper, Ti foils were used to fabricate TiO2 nanotubes by anodic oxidation and ZnO/two-layer self-doped black TiO2 nanotubes were prepared by electrochemical reduction and a hydrothermal method. The formed black TiO2 nanotubes have a better photoconversion efficiency and the maximum photoconversion efficiency increased by 59% compared with the pure nanotubes. The deposition of ZnO further improves the maximum photoconversion efficiency to 456% based on black TiO2. The photocurrent responses also increase by about 5 times in our results. This work is instructive for the development of highly robust and efficient photoanode materials in fields including photoelectrochemistry and photocatalysis.
Introduction
The capability of the solar-driven photocatalytic processes of hydrogen production and water pollution treatment depends on the light absorption ability of the semiconductor materials. TiO2, as one of the most promising photoanodes, is widely used in solar water splitting systems for its favorable band-edge positions, superior chemical and optical stability, low toxicity and low cost.1,2 Unfortunately, the water splitting performance of TiO2-based materials is limited by their wide band gap which makes them only responsive to ultraviolet light. Besides, the poor electrical conductivity of TiO2 leads to a greater recombination of electron–hole pairs which shortens the lifetime of the electrons and holes. Over the last decade, various approaches have been explored to improve photoactivity and light absorption in the visible light region. Nevertheless, these methods are fixed in form and monotonous in content, mainly concentrated on ion doping3,4 and metal5,6 or nonmetal7,8 decorated TiO2 surfaces.In 2011, Chen et al. first changed the band gap to 1.5 eV by hydrogenation of TiO2 and achieved the black TiO2 by introducing the lattice defects and the reduced band gap could enhance the quantum efficiency and lengthen the range of light responses to a great extent.9 Since then, research efforts have been promoted to the black TiO2 to improve its photoelectrochemical properties.10,11 However, either the high temperature or the long time for the annealing processes are limited for its practical application. Alternatively, the electrochemical reduction provides a simpler method for the fabrication of the black TiO2 which will not introduce other chemical elements and is more economic and environmentally friendly.12 Under the cathodic potential, the pristine TiO2 will rapidly turn to the black by reducing the Ti4+ to Ti3+ in the TiO2 lattice and introducing oxygen vacancies.13 Simultaneously, a shallow electron donor state is created to associate with increasing charge transport and lowering the electrical conductivity impedance14
Moreover, compared with traditional nanoparticles, one-dimensional (1-D) TiO2 nanotube arrays have the advantages of high surface-to-volume ratio, carrier-directed migration path and single migration direction and are also easily fabricated by the electrochemical method.15,16 Recently, the growth of the heterojunction on the surface of TiO2 nanotubes has become a common means to improve the water splitting performances.17 ZnO shows its talent among other nano-materials because it has a band gap (3.37 eV) of very close to that of TiO2. Meanwhile, a much better carrier transport efficiency can make up for the shortcomings of TiO2 in this field for its high charge carrier mobility (120 cm2 V−1 s−1) which is about one order higher than that of TiO2.18,19 Though such ZnO/TiO2 nanotube heterostructures have been extensively studied, the techniques used in those studies are complex, time consuming and require costly equipment.20,21 Our present study is based on the earlier successes of the TiO2 and ZnO/TiO2 heterostructures and persuades to simplify and enhance the photoelectrochemical properties.
In this work, two-step anodic oxidation was used to fabricate the TiO2 nanotubes on metal Ti as a simple and scalable synthesis method. Then we propose the electrochemical reduction to induce Ti3+ and oxygen vacancies and a hydrothermal method to directly grow ZnO nanorods. The results indicate that the largely improved photoconversion efficiency and photoresponses were achieved for a synergistic function of the Ti3+ and oxygen vacancies and the combined heterojunction between ZnO and TiO2. The electrochemical performances can be responsible for the enhanced electrical conductivity and improved charge separation and transfer.
2 Experimental section
2.1. Fabrication of TiO2 nanotubes
The TiO2 nanotubes were fabricated by two-step anodic oxidation on Ti substrate. The detailed fabrication is described in ESI.†2.2. Electrochemical reduction of TiO2
The electrochemical reduction was performed in a similar approach as previously reported.13 The TiO2 nanotubes were treated for a brief activation in the same and pristine electrolyte solution of anodic oxidation mentioned above at 60 V for 30 s. An applied potential on the sample film for the cathode was then used for 200 s to form the black TiO2 nanotubes.2.3. Growth of ZnO nanorods
The ZnO nanotubes were grown on the black TiO2 nanotubes by the hydrothermal method without the assist of ZnO seed layer. The black TiO2 nanotube samples were directly immersed in the solution of zinc nitrate hydrate (Zn(NO3)2·6H20) and hexamethylene tetramine ((CH2)6N4) with the molar ratio 1![[thin space (1/6-em)]](https://www.rsc.org/images/entities/char_2009.gif) :
:![[thin space (1/6-em)]](https://www.rsc.org/images/entities/char_2009.gif) 1. Teflon-lined stainless steel autoclaves were used to perform the hydrothermal growth process at 90 °C for 4 h. Finally, the as-prepared samples were cleaned in the deionized water and dried in the air.
1. Teflon-lined stainless steel autoclaves were used to perform the hydrothermal growth process at 90 °C for 4 h. Finally, the as-prepared samples were cleaned in the deionized water and dried in the air.
3 Results and discussion
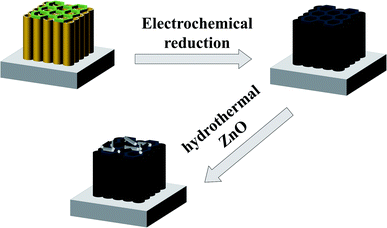
The procedure for the construction of the ZnO/two-layer black TiO2 nanotubes is exhibited in Schemes 1 and S1.† The spatially hierarchically ordered TiO2 nanotubes were first fabricated by two-step anodic oxidation on Ti substrate. Afterwards, the electrochemical reduction was used to obtain black nanotubes. Finally, the ZnO nanorods were hydrothermally grown to form a heterostructure.The Field emission scanning microscopy (FESEM) was used to investigate the microscopic morphology of TiO2 nanotubes and ZnO/TiO2 heterostructure in Fig. 1. Fig. 1(a) shows TiO2 nanotube arrays fabricated by one-step anodic oxidation. It is clearly seen that the pure one-layer TiO2 nanotubes (1-TNTs) are highly ordered and compactly arranged grown on Ti foil substrate with an average diameter of about 50 nm. Fig. 1(b) and (c) exhibit the top and the cross-sectional view of the two-layer TiO2 nanotubes (2-TNTs) fabricated by two-step anodic oxidation. The different nanoring/nanotube combined structure was characterized. The TiO2 nanorings have about twice the diameter of the nanotube arrays and are ultra-thin compared with the length of nanotubes (The nanotubes and nanoring is around 4 μm and lower than 50 nm in length). The nanorings with the hexagonal shapes which increase the surface-to-volume ratio will improve the ability of absorption of irradiation in more or less. Clearly, the morphology and dimensions of the black two-layer TiO2 nanotubes (2-B-TNTs) in Fig. 1(d) is similar to the 2-TNTs in Fig. 1(b) which indicates the hierarchical structure was not changed in the electrochemical reduction process. Meanwhile, the stable and firm TiO2 nanotubes provides consistent conditions for the fabrication of ZnO nanorods. The ZnO nanorods are dense and uniform grown on the 2-B-TNTs and the nanoring/nanotube combined structure still remain available under the ZnO nanorods, as shown in Fig. 1(e) and (f), which is beneficial to the light absorption and could enhance the photocurrent. No ZnO seed layer was introduced to the growth of nanorods, but intimate interfacial contact between TiO2 nanotubes and ZnO nanorods are formed dramatically in TEM and HRTEM in Fig. S2.† Consistently, the HRTEM image of the ZnO/2-B-TNTs demonstrates two sets of lattice fringes of 0.353 and 0.282 nm, corresponding to the (101) and (100) crystal planes of anatase TiO2 and ZnO nanorods, respectively.22,23
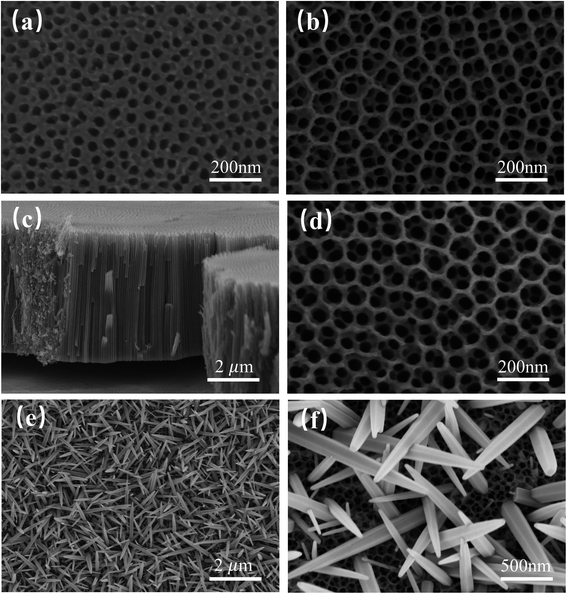 | ||
| Fig. 1 FESEM images of (a) top view of the 1-TNTs; (b) top and (c) cross-sectional view of the 2-TNTs; (d) top view of the 2-B-TNTs; (e and f) top view of the ZnO/2-B-TNTs. | ||
The crystal structure of the samples was determined by XRD in Fig. 2(a). It is clear that the main diffraction peaks at 25.3°, 38°, 48.2°, 54.1°, 55.2°, 62.9°, which are related to the (101), (004), (200), (105), (204) crystal planes respectively are highly crystallized in pure TiO2 anatase phase (JCPDS no. 21-1272).17 The only anatase phase was found without any other phase, like rutile, makes the TiO2 nanotubes own better photoelectrochemical properties and indicates that TiO2 is almost unchanged after electrochemical reduction and growth of ZnO. With the deposition of ZnO nanorods on 2-TNTs and 2-B-TNTs, the new diffraction peaks at 31.7°, 34.4°, 36.2°, 47.5°, and 62.9° are discovered corresponding to the (100), (002), (101), (102) and (103) crystal planes of ZnO.24 Noticeablely, the intensity ratios of TiO2 and ZnO for the ZnO/2-TNTS and ZnO/2-B-TNTS are changed, which may prove the existence of the black TiO2 nanotubes by electrochemical reduction and the formation of 2-B-TNTs can improve the growth of ZnO.
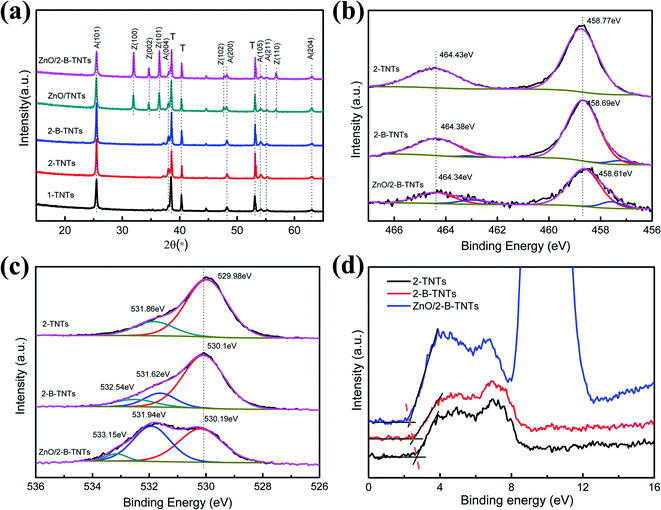 | ||
| Fig. 2 (a) XRD patterns of 1-TNTs, 2-TNTs, 2-B-TNTs, ZnO/2-TNTs, ZnO/2-B-TNTs; (b) Ti 2p XPS spectra; (c) O 1s XPS spectra; (d) XPS valence band spectra of 2-TNTs, 2-B-TNTs, ZnO/2-B-TNTs. | ||
To further explore the chemical composition and the change of the surface bonding of the TiO2 nanotubes after electrochemical reduction and the deposition of ZnO, XPS was characterized, as shown in Fig. 2(b) and (c). Fig. 2(b) shows the binding energies of Ti4+ 2p3/2 and 2p1/2 in the 2-TNTs at the 464.43 eV and 458.61 eV, which is typical for the Ti–O bonds in TiO2.25 Compared with 2-TNTs, additional small peaks discovered in the 2-B-TNTs and ZnO/2-B-TNTs correspond to the Ti3+ 2p3/2 and 2p1/2.26 The formation of new peaks of Ti3+ is attributed to Ti4+ reduction by electrochemical reduction and a shift to the lower binding energy of the Ti4+ peaks also indicate Ti4+ is reduced to Ti3+. The O 1s XPS spectra is divided into two or three major peaks, which are classified as the lattice oxygen (OL), oxygen vacancies (OV) and hydroxyl groups (OH) in Fig. 2(c).27 The lattice oxygen tends to have a shift to a higher binding energy indicates the existence of the black TiO2 nanotubes which corresponds to the shift of Ti4+ 2p3/2 and 2p1/2. Moreover, the extra new peak of OV is another evidence to confirm the truth of the formation of the black TiO2 nanotubes.13 Compared with 2-B-TNTs, the more OV was found in the ZnO/2-B-TNTs, which indicates that the more oxygen defects were introduced by the growth of ZnO. The PL spectra in Fig. S3† also certifies ZnO nanorods would introduce oxygen defects for the framework. The XPS valence band spectra shown in Fig. 2(d) and S4† estimates the valence band maximum. The smaller valence band maximum for the 2-B-TNTs comform an upward shift effect at the TiO2 nanotubes, which is basically consistent with the previous reports.28 The blue shift of the valence band maximum brings a narrowed band gap which both enhances the production of photoexcited electrons and holes and promotes carrier transport at the surface of ZnO and TiO2.
The photoelectrochemical properties were measured under simulated solar light of AM 1.5 G (100 mW cm−2). The Fig. 3(a) exhibits the linear sweep voltammogram (LSV) curves at a scan rate of 5 mV s−1 in the dark and under the illumination. On one hand, the photocurrent of the TiO2 nanotubes is unconspicuous in dark while the high photocurrent densities appear under the light irradiation in the photoelectrodes, which indicates that no drastic electrocatalytic water splitting occurs. On the other hand, the photocurrent densities are dramatically increasing with the new double-layer structure, electrochemical reduction and growth of ZnO nanotubes. Fig. 3(a) can be analyzed separately in three aspects: photocurrent values, photocurrent tendencies and the onest potential. The potential of 1.23 V vs. RHE is chosen as a standard to evaluate the quality of the photoanode for the same potential of the water oxidation. For the photocurrent values, the 2-B-TNTs and ZnO/2-B-TNTs have the photocurrent densities of 94 μA cm−2 and 298 μA cm−2, which are about 3.7 and 11.7 times of the 1-TNTs at that potential. For the tendencies of the photocurrent curves, with the increasing applied potential bias, the photocurrent densities of the 1-TNTs, 2-TNTs and 2-B-TNTs improve fast at first and then tend to the saturation state, while the photocurrent densities of ZnO/2-TNTs and ZnO/2-B-TNTs are a curve with a slowly decreasing slope. Besides, the photocurrent tendencies of 2-B-TNTs and ZnO/2-B-TNTs show a cathodic offset of saturation potential compared with the 2-TNTs, separately. The cathodic offset of saturation potential demonstrates that both the formation of the heterostructure and the addition of Ti3+ and OV will accelerate the charge carrier separation and migration in the TiO2 nanotubes.29 Furthermore, the onset potential of the ZnO/2-B-TNTs inserted in Fig. 3(a) reveals a slight cathodic shift from 0.297 V for the 1-TNTs to 0.246 V. Compared with pristine TiO2 nanotubes, the lower onset potential reduces the applied bias to the redox reaction and indicates more effective charge separation and transport in the ZnO/2-B-TNTs.
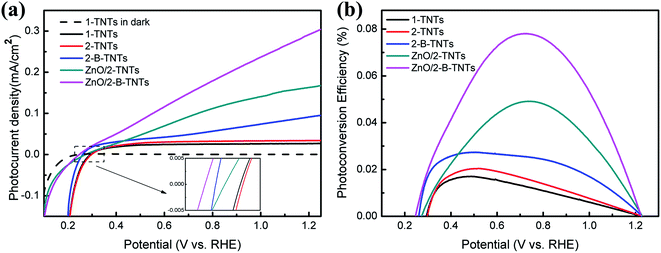 | ||
| Fig. 3 (a) Linear-sweep voltammograms, collected with a scan rate of 5 mV s−1 under simulated solar light of am 1.5 g (100 mW cm−2). (b) Photoconversion efficiency as a function of applied potential. | ||
The applied bias photoconversion efficiencies (η) of the 1-TNTs, 2-TNTs, 2-B-TNTs, ZnO/2-TNTs and ZnO/2-B-TNTs were calculated using the following equation:30
| η (%) = I(1.23 V − Vbias)/Jlight |
Fig. 4(a) shows the transient photocurrent responses of 1-TNTs, 2-TNTs, 2-B-TNTs, ZnO/TNTs, ZnO/2-B-TNTs with on/off light cycles of intermittent irradiation. All the samples are observed with good repeatable photoresponses in chopped light cycles. Upon illumination, the photocurrent values will rapidly rise to a steady state and no obvious decay photocurrent is found for several on/off cycles. The pure 1-TNTs have the photocurrent density of 24.6 μA cm−2, while the best photocurrent density of the ZnO/2-B-TNTs reaches to 121.8 μA cm−2, which is the intensity of about 5 times that of the 1-TNTs, indicating more efficient charge separation of photo-induced carriers and larger amount of photogenerated electrons and holes in the transport process for treating by electrochemical reduction and depositing ZnO nanorods. With regard to the transient photocurrent responses of the light “off”, as shown in Fig. 3(a), the trend of photocurrent density changes a lot with each other. At the moment of the light off, the transient photocurrent responses of 1-TNTs, 2-TNTs and ZnO/TNTs will finally tend to zero, while the photocurrent of 2-B-TNTs and ZnO/2-B-TNTs will gradually decay to a certain value. The different trend is mainly attributed to Ti3+ at the surface of the 2-B-TNTs and ZnO/2-B-TNTs. The introduced Ti3+ cause a more disordered defect state, which helps to reduce the recombination of electrons and holes and may cause some carriers remain and release as a carrier centre after taking off the light.33 Meanwhile, the addition of Ti3+ is beneficial to the increase of the carrier density which enhances the electrical conductivity of the 2-B-TNTs and ZnO/2-B-TNTs.34 Considering that there was a decline in the first 200 s under the light irradiation, the photocurrent stability of the ZnO/2-B-TNTs was performed under the continuous simulated sun illumination for 5000 s (Fig. S7†). The basically-steady photocurrent is discovered during the long-time test, suggesting that the combined heterojunction is stable under the photoelectrochemical water oxidation condition.
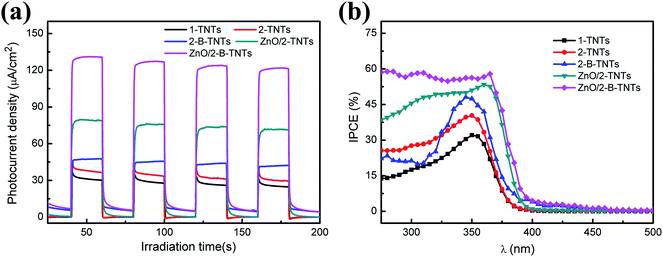 | ||
| Fig. 4 (a) Transient photocurrent responses at 0.6 V vs. RHE; (b) IPCE spectra of 1-TNTs, 2-TNTs, 2-B-TNTs, ZnO/TNT and ZnO/2-B-TNTs at 0.6 V vs. RHE. | ||
IPCE spectra is often used to estimate the interplay between the photoactivity and the light absorption of photoelectrodes. Fig. 4(b) characterizes the IPCE spectra on the these five TiO2 relevant samples in the absence of external bias, respectively. The IPCE can be calculated by the equation:31
| IPCE = (1240I)/(λJlight) |
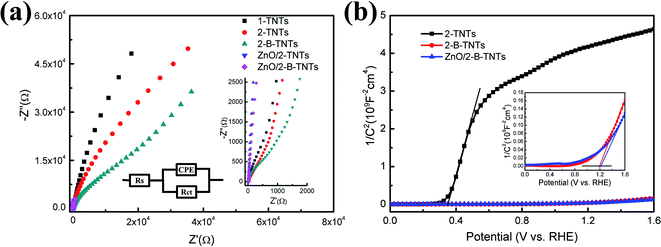
The electrochemical impedance spectroscopy (EIS) was measured to expert the interfacial properties of electrodes and electrolyte. Fig. 5(a) shows Nyquist plots of 1-TNTs, 2-TNTs, 2-B-TNTs, ZnO/TNTs and ZnO/2-B-TNTs. The relevant equivalent circuit for the Nyquist plots contains constant-phase element (CPE), series resistance (Rs) and charge transfer resistance Rct, which is in accordance with equivalent circuit proposed in earlier works22 (inset of Fig. 5(a)). Obviously, the real and imaginary impedance of ZnO/TNTs and ZnO/2-B-TNTs are both lower than that of the 1-TNTs, 2-TNTs, 2-B-TNTs at the open circuit potential. The values of the real axis reflect the equivalent series impedance, which indicates the 2-B-TNTs and ZnO/2-B-TNTs have a smaller equivalent series impedance for induced Ti3+ and OV and Ti3+ and OV could efficiently enhance the electrical conductivity for the TiO2 nanotubes. Meanwhile, the semicircles of the curves reflect the charge transport process of a sample. As shown in Fig. 5(a) and its insert, the smaller semicircular diameters exhibit the lower charge transport impedance, which represents a more efficient charge transport and a faster redox reaction with the growth of the ZnO nanorods.
Mott–Schottky plots were collected by performing potential-dependent capacity measurement at a frequency of 1 kHz. It is used to determine the semiconductor type, the flat band potential and the carrier density of the TiO2 nanotube treated before and after the electrochemical reduction and the deposition of ZnO nanorods. According to its theory, the space charge capacity of a semiconductor is expressed by the following equation below :35
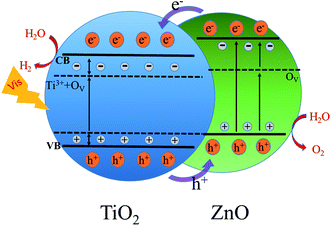
Based on the above analysis, the possible mechanism of the ZnO/2-B-TNTs heterostructure is proposed as shown in Fig. 6. The ZnO/2-B-TNTs sample treated by the electrochemical reduction will achieve a smaller valence band maximum which is shown in the Fig. 2(d). Unfortunately, the surface of ZnO/2-B-TNTs will be oxidized easily when exposed to the air atmosphere, although its interior nanotubes are almost intact.36 Therefore, a new impurity level will be generated above the valence band (VB) of the 2-B-TNTs. Furthermore, the Ti3+ and OV in the TiO2 lattice will introduce a shallow electron donor state at the bottom of the conduction band (CB) of TiO2, which can help to trap more electrons for transferring to CB of TiO2 and thus enhance the charge separation and transfer under the light irradiation. What's more, the formation of the heterostructure with coupling with ZnO, the photoactivity can be further enhanced in the photoelectrochemical solar water splitting. Under the illumination, the electrons will transfer from CB of ZnO to CB of TiO2 and the holes in turn move from VB of TiO2 to ZnO due to a bit more negative in potential of ZnO. Meanwhile, OV in ZnO will also synergistically to promote the charge transfer and reduce the recombination in the process of transport. Abundant catalytic sites for H2 evolution will be concomitantly provided expect for inhibiting the recombination during the surface of heterostructure under the bias. Therefore, electrons will be efficiently collected on CB of TiO2 and be communed to accomplish a redox for H2 evolution in these photoactivation sites. In one word, the special structure can efficiently enhance photoexcited electron–holes pairs' separation and transfer, which is crucial for the electrochemical splitting of water.
4 Conclusion
In summary, this work demonstrates that the TiO2 nanotubes have been optimized by the electrochemical reduction and the deposition of the ZnO nanorods. The induced Ti3+ and OV by electrochemical reduction can not only work as the donor of excess carriers to reduce charge transport impedance and enhance the electrical conductivity, but also availably increase the quantum efficiency the range of photoresponse for the visible light. Moreover, the growth of ZnO will suppresses the recombination of photoexcited electrons and holes and accelerate the charge separation and transfer. Therefore, compared with the pristine 1-TNTs, the ZnO/2-B-TNTs exhibit a large photocurrent of 121.8 μA cm−2, which is about 5 times of the 1-TNTs. Consequently, it is hoped to further improve the electrochemical properties based on our present work.Conflicts of interest
The authors declare no competing financial interest.Acknowledgements
This work is supported by National Natural Science Foundation of China (11874185).References
- H. W. Jeong, K. J. Park, D. S. Han and H. Park, Appl. Catal., B, 2018, 226, 194–201 CrossRef CAS.
- Y. Ye, Y. Feng, H. Bruning, D. Yntema and H. H. M. Rijnaarts, Appl. Catal., B, 2018, 220, 171–181 CrossRef CAS.
- P. Mazierski, W. Lisowski, T. Grzyb, M. J. Winiarski, T. Klimczuk, A. Mikołajczyk, J. Flisikowski, A. Hirsch, A. Kołakowska, T. Puzyn, A. Zaleska-Medynska and J. Nadolna, Appl. Catal., B, 2017, 205, 376–385 CrossRef CAS.
- Y. Yang, L. C. Kao, Y. Liu, K. Sun, H. Yu, J. Guo, S. Y. H. Liou and M. R. Hoffmann, ACS Catal., 2018, 8, 4278–4287 CrossRef CAS.
- K. Du, G. Liu, X. Chen and K. Wang, Electrochim. Acta, 2018, 277, 244–254 CrossRef CAS.
- W. Zhang, Y. Liu, D. Zhou, J. Wen, L. Zheng, W. Liang and F. Yang, RSC Adv., 2016, 6, 48580–48588 RSC.
- Y. Li, Z. Yin, G. Ji, Z. Liang, Y. Xue, Y. Guo, J. Tian, X. Wang and H. Cui, Appl. Catal., B, 2019, 246, 12–20 CrossRef CAS.
- S. Hou, Z. Q. Wei, X. C. Dai, M. H. Huang and F. X. Xiao, Inorg. Chem., 2020, 59, 7325–7334 CrossRef CAS.
- X. Chen, L. Liu, P. Y. Yu and S. S. Mao, Science, 2011, 331, 746–750 CrossRef CAS.
- K. Cho, S. Lee, H. Kim, H.-E. Kim, A. Son, E.-j. Kim, M. Li, Z. Qiang and S. W. Hong, Appl. Catal., B, 2019, 257, 117910 CrossRef CAS.
- A. Naldoni, M. Altomare, G. Zoppellaro, N. Liu, Š. Kment, R. Zbořil and P. Schmuki, ACS Catal., 2018, 9, 345–364 CrossRef.
- F. F. Hudari, G. G. Bessegato, F. C. Bedatty Fernandes, M. V. B. Zanoni and P. R. Bueno, Anal. Chem., 2018, 90, 7651–7658 CrossRef CAS.
- H. Li, Z. Chen, C. K. Tsang, Z. Li, X. Ran, C. Lee, B. Nie, L. Zheng, T. Hung, J. Lu, B. Pan and Y. Y. Li, J. Mater. Chem. A, 2014, 2, 229–236 RSC.
- N. S. Peighambardoust, S. Khameneh Asl, R. Mohammadpour and S. K. Asl, Electrochim. Acta, 2018, 270, 245–255 CrossRef CAS.
- J. Ni, S. Fu, Y. Yuan, L. Ma, Y. Jiang, L. Li and J. Lu, Adv. Mater., 2018, 30, 1704337 CrossRef.
- J. Yoo, R. Zazpe, G. Cha, J. Prikryl, I. Hwang, J. M. Macak and P. Schmuki, Electrochem. Commun., 2018, 86, 6–11 CrossRef CAS.
- Y. Chen, H. Yin, F. Li, J. Zhou, L. Wang, J. Wang and S. Ai, Chem. Eng. J., 2020, 393, 124707 CrossRef CAS.
- C. B. Ong, L. Y. Ng and A. W. Mohammad, Renewable Sustainable Energy Rev., 2018, 81, 536–551 CrossRef CAS.
- H. N. Hieu, N. V. Nghia, N. M. Vuong and H. Van Bui, Chem. Commun., 2020, 56, 3975–3978 RSC.
- M. Kwiatkowski, R. Chassagnon, O. Heintz, N. Geoffroy, M. Skompska and I. Bezverkhyy, Appl. Catal., B, 2017, 204, 200–208 CrossRef CAS.
- M. Zeng, X. Zeng, X. Peng, Z. Zhu, J. Liao, K. Liu, G. Wang and S. Lin, Appl. Surf. Sci., 2016, 388, 352–358 CrossRef CAS.
- Z.-Q. Wei, X.-C. Dai, S. Hou, Y.-B. Li, M.-H. Huang, T. Li, S. Xu and F.-X. Xiao, J. Mater. Chem. A, 2020, 8, 177–189 RSC.
- X.-C. Dai, M.-H. Huang, Y.-B. Li, T. Li, B.-B. Zhang, Y. He, G. Xiao and F.-X. Xiao, J. Mater. Chem. A, 2019, 7, 2741–2753 RSC.
- F.-X. Xiao, S.-F. Hung, H. B. Tao, J. Miao, H. B. Yang and B. Liu, Nanoscale, 2014, 6, 14950–14961 RSC.
- L. Assaud, N. Brazeau, M. K. S. Barr, M. Hanbücken, S. Ntais, E. A. Baranova and L. Santinacci, ACS Appl. Mater. Interfaces, 2015, 7, 24533–24542 CrossRef CAS.
- S. Zhao, Y. Chen, Z. Zhao, L. Jiang, C. Zhang, J. Kong and X. Zhu, Electrochim. Acta, 2018, 266, 233–241 CrossRef CAS.
- X. Liu, Z. Xing, Y. Zhang, Z. Li, X. Wu, S. Tan, X. Yu, Q. Zhu and W. Zhou, Appl. Catal., B, 2017, 201, 119–127 CrossRef CAS.
- Y. Yang and M. R. Hoffmann, J. Environ. Sci. Technol., 2016, 50, 11888–11894 CrossRef CAS.
- G. Wang, H. Wang, Y. Ling, Y. Tang, X. Yang, R. C. Fitzmorris, C. Wang, J. Z. Zhang and Y. Li, Nano Lett., 2011, 11, 3026–3033 CrossRef CAS.
- C.-C. Wang, C.-Y. Chou, S.-R. Yi and H.-D. Chen, Int. J. Hydrogen Energy, 2019, 44, 28685–28697 CrossRef CAS.
- H. Cui, W. Zhao, C. Yang, H. Yin, T. Lin, Y. Shan, Y. Xie, H. Gu and F. Huang, J. Mater. Chem. A, 2014, 2, 8612–8616 RSC.
- Y. He, P. Wang, J. Zhu, Y. Yang, Y. Liu, M. Chen, D. Cao and X. Yan, ACS Appl. Mater. Interfaces, 2019, 11, 37322–37329 CrossRef CAS.
- H. Zhou and Y. Zhang, J. Phys. Chem. C, 2014, 118, 5626–5636 CrossRef CAS.
- N. Liu, C. Schneider, D. Freitag, M. Hartmann, U. Venkatesan, J. Müller, E. Spiecker and P. Schmuki, Nano Lett., 2014, 14, 3309–3313 CrossRef CAS.
- H. Zhu, M. Zhao, J. Zhou, W. Li, H. Wang, Z. Xu, L. Lu, L. Pei, Z. Shi, S. Yan, Z. Li and Z. Zou, Appl. Catal., B, 2018, 234, 100–108 CrossRef CAS.
- A. Kubiak, K. Siwińska-Ciesielczyk and T. Jesionowski, Materials, 2018, 11, 2295 CrossRef.
Footnote |
| † Electronic supplementary information (ESI) available. See DOI: 10.1039/d0ra09099a |
| This journal is © The Royal Society of Chemistry 2021 |

