
 Open Access Article
 This Open Access Article is licensed under a Creative Commons Attribution-Non Commercial 3.0 Unported Licence
Tunable ductility of a nano-network from few-layered graphene bonded with benzene: a molecular dynamics study†
Jiao Shi *ab,
Jia-Long Zhanga,
Jia-Xing Jia and
Bo Song*c
*ab,
Jia-Long Zhanga,
Jia-Xing Jia and
Bo Song*c
aCollege of Water Resources and Architectural Engineering, Northwest A&F University, Yangling 712100, China. E-mail: shijiaoau@163.com
bState Key Laboratory of Structural Analysis for Industrial Equipment, Dalian University of Technology, Dalian 116024, China
cInstitute of Advanced Structure Technology, Beijing Institute of Technology, Beijing, 100081, China. E-mail: songbo943@163.com
First published on 4th January 2021
Abstract
Developing novel graphene-based materials with unique mechanical properties is of significance to meet the requirements in new applications. The pristine graphene shows a brittle fracture when the stretching strain on it exceeds the critical value. Further, it fails to bear the external load. Herein, to enhance the ductility of the pristine graphene, we proposed a corrugated sandwich carbon network based on few-layered graphene, in which the two surface layers are bonded with several corrugated core layers via benzene molecules. The effects of factors such as the geometry, temperature, and strain rate on the ductility of the carbon network were evaluated using the uniaxial tension tests by molecular dynamics simulations. Results show that the new carbon material has more than one peak fracture strain in stretching. The second peak fracture strain is proportional to the length difference between the surface layers and core layers. Hence, the carbon network has a tunable ductility, which suggests a flexible design of such novel materials in a nanostructure/nanodevice with large deformation.
1 Introduction
As a popular two-dimensional (2D) sheet, graphene has excellent mechanical, electrical and thermal properties.1–5 In recent years, a lot of graphene-based new carbon materials with targeted mechanical properties have been developed.6–11 Since monolayer graphene is too soft, Qin et al.6 preassembled 2D graphene to a stable three-dimensional (3D) porous scaffold, which inherited the high stiffness and strength of graphene. Yang et al.12,13 proposed models of nano-textures from graphene ribbons, which can be applied in the design of sensors or molecular sieves. By combining graphene sheets and carbon nanotubes in a pillared way, Xu et al.14 constructed a 3D network with new mechanical and thermal properties. Cai et al.9 designed a re-entrant 2D graphene-based kirigami15 and evaluated the size and surface effects on its auxetic properties. Jiang et al.16 introduced a new semi-conductive carbon allotrope called twin-graphene with a strain-dependent bandgap. In the reports by Liu et al.,17,18 the irradiation method was adopted to form carbon networks from multi-layered graphene. Shi et al.19 formed a new carbon network from few-layered graphene by the shot peening method. The bonded graphene ribbon has no relative sliding between adjacent layers. Contrary to the graphene's typical brittle fracture, a new ductile 2D graphene–diamond nanocomposite superstructure was formed by bonding the twisted bilayer graphene.20At the nanoscale, the motion and/or deformation of an object is usually realized by a probe.15,21,22 The large-deformed object should have high ductility under an external load. The literature indicates that when a pristine graphene ribbon is under uniaxial tension along the armchair and zigzag directions, its critical fracture strains are about 14% and 21%, respectively, at room temperature.19,23 Once the stretching strain exceeds the corresponding critical value, it breaks in brittle style. As a result, the low ductility hampers the pristine graphene's application in a nanostructure/nanodevice with large deformation.
For enhancing the graphene ductility, this study proposes a new sandwich-like graphene/benzene-based carbon network (Fig. 1), which mimics the sandwich structures.24–26 In the new carbon network, the two surface layers and core layers are bonded with benzene molecules. The tensile properties of the new carbon network are evaluated by molecular dynamics simulations.
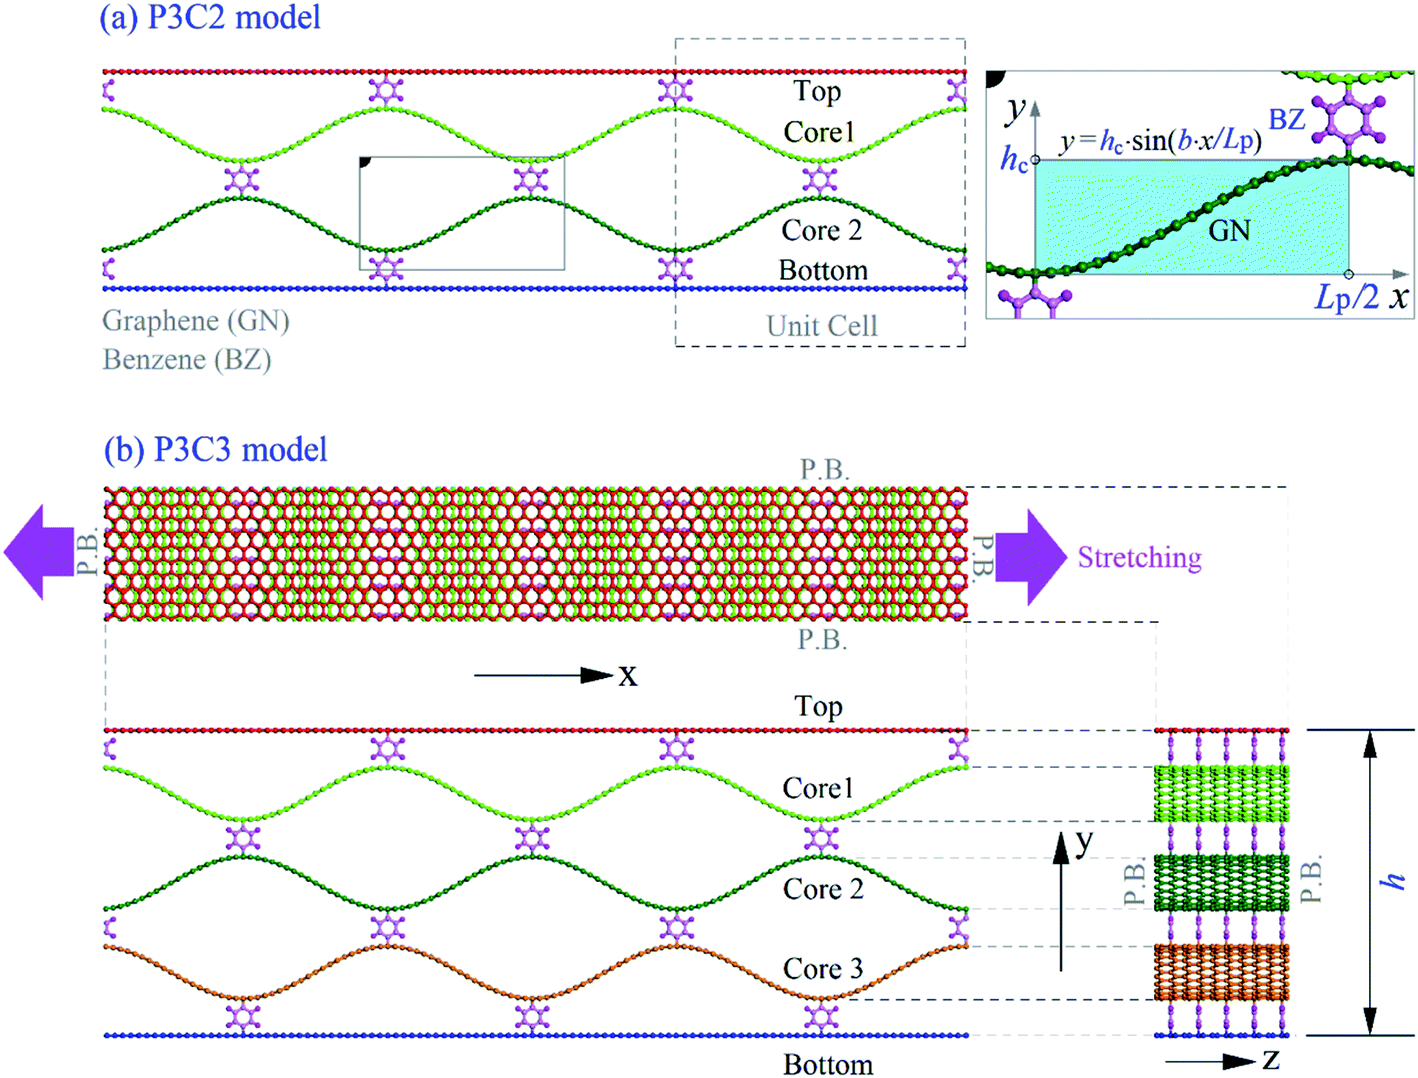 | ||
| Fig. 1 Initial geometries of sandwich nano-networks from graphene ribbons bonded with benzene (BZ) molecules. The network contains two surface layers (top and bottom) and two or three core layers. The neighboring layers are connected with benzene molecules. The boundaries in the x-/z-directions are set as periodic boundaries (P.B.). For simplicity, the core layers have the same shape of sine functions. “PmCn” means that the network has m periodic cells along the stretching direction and n core layers, e.g., (a) the P3C2 model has two core layers (Nc = 2) and three periodic cells (Np = 3), (b) the P3C3 model has three core layers (Nc = 3) and three periods (Np = 3) in the stretching direction. | ||
2 Model and methodology
2.1 Model
The initial configurations of the two carbon networks shown in Fig. 1 are made of graphene ribbons and benzene molecules. The core layers are curved according to a sine function. The period and the amplitude of the sine function are shown in Table 1. Different from the macrosandwich beam formed by adhesives,24 the surface layers and the core layers are bonded with benzene molecules in the present model. In the stretching direction (zigzag direction), the core has several unit cells, e.g., Np = 3. The initial length of surfaces equals Np × Lp. We evaluate the effect of Np on the carbon network's strength considering four different values of Np. Periodic boundary conditions are applied along the x and z directions to eliminate the edge effect. More details on the involved models are listed in Table 1.| Model | Nc | Np | Lp (Å) | hc (Å) | h (Å) | Surface layer | Core layer | RL layer |
|---|---|---|---|---|---|---|---|---|
| P3C2 | 2 | 3 | 44.28 | 8.0 | 33.04 | 1080C | 1200C | 111.1% |
| P3C3 | 3 | 3 | 44.28 | 8.0 | 46.72 | 1080C | 1200C | 111.1% |
| P4C2 | 2 | 4 | 31.98 | 8.0 | 33.04 | 1040C | 1200C | 115.4% |
| P4C3 | 3 | 4 | 31.98 | 8.0 | 46.72 | 1040C | 1200C | 115.4% |
| P5C2 | 2 | 5 | 24.60 | 8.0 | 33.04 | 1000C | 1200C | 120.0% |
| P5C3 | 3 | 5 | 24.60 | 8.0 | 46.72 | 1000C | 1200C | 120.0% |
| P6C2 | 2 | 6 | 19.68 | 8.0 | 33.04 | 960C | 1200C | 125.0% |
| P6C3 | 3 | 6 | 19.68 | 8.0 | 46.72 | 960C | 1200C | 125.0% |
2.2 Methodology
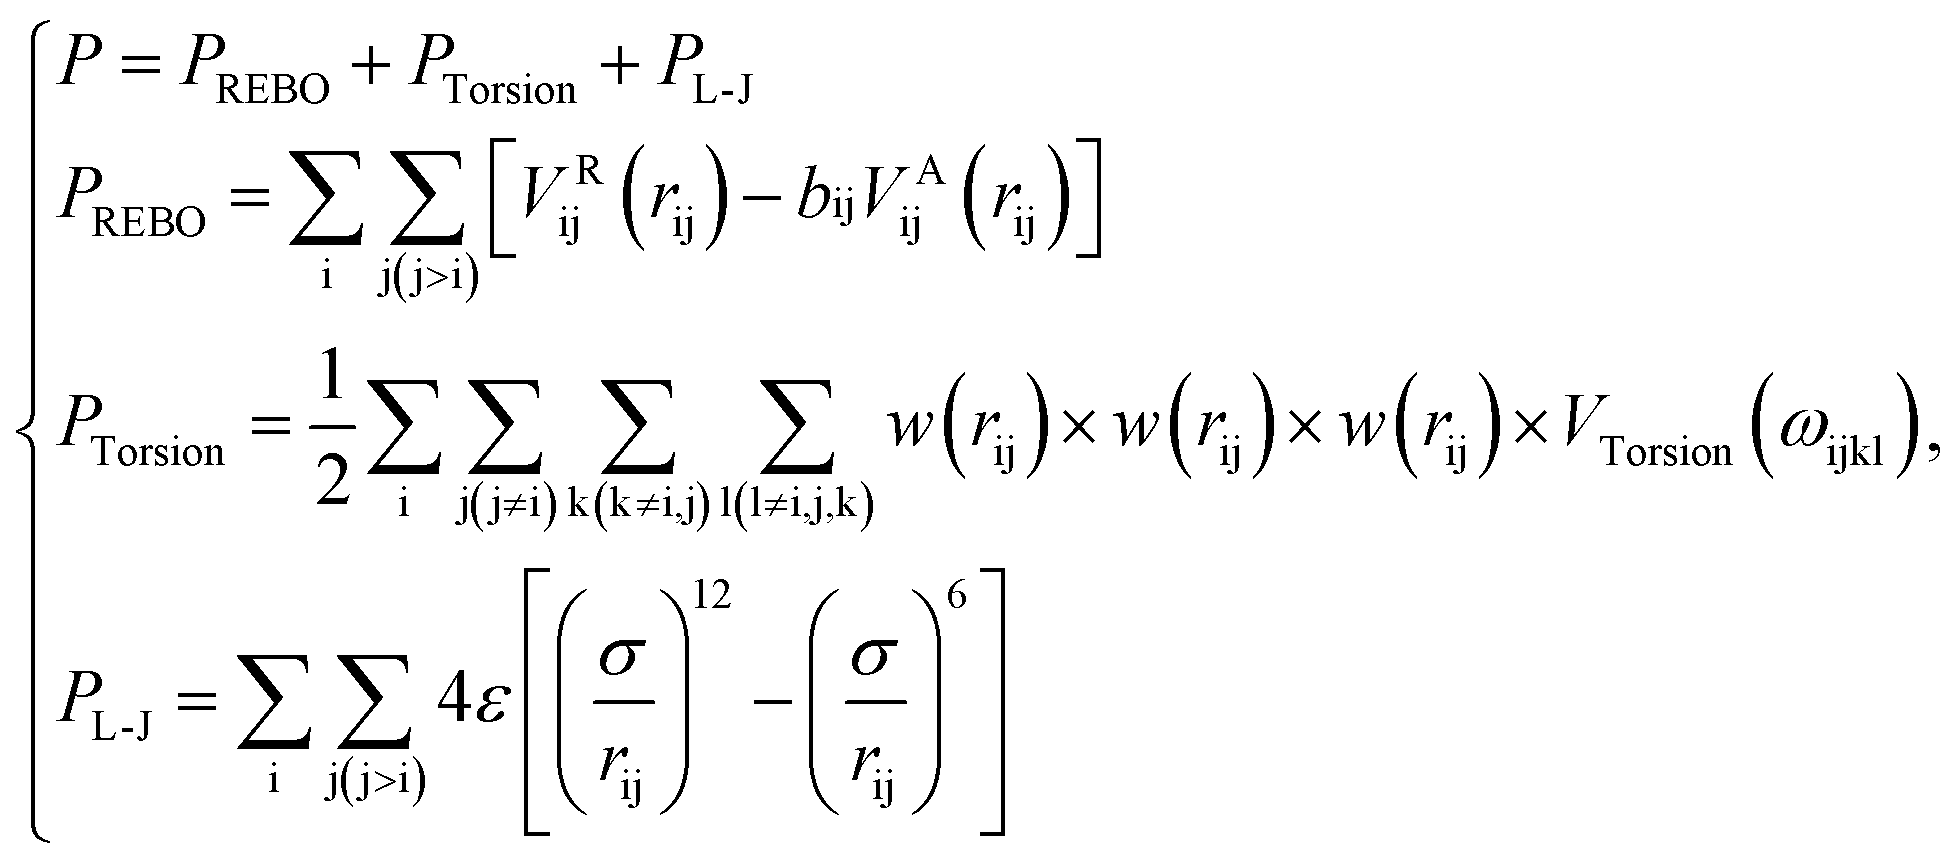 | (1) |
For a deep understanding of the carbon network's tunable ductility, the uniaxial tension tests are conducted with constant strain rate loading. Before stretching, the initial configuration shown in Fig. 1 is reshaped by minimizing its potential energy. Then, the system is relaxed in NPT (constant number of atoms, constant pressure and temperature of the system) ensemble for 10 ps. The environment temperature is controlled by the Nose–Hoover thermostat.38,39 After that, a uniaxial tensile loading with a specified strain rate is applied along the x-direction without any pressure in the other two directions. The time step for the integration of atoms' motion equations is set as 1 fs.
Moreover, the uniaxial tensile tests for a mono-layer pristine graphene ribbon along the same direction are conducted for comparison. The size of the pristine graphene ribbon is 131.6 Å × 19.9 Å, which is similar to that of the surface layers in the P3C3 model. For mitigating the size effect, periodic boundaries are adopted in the stretching plane. Critical strains of PGN under different temperatures obtained here (see the second column in Table 2) agree well with the corresponding values given by Shi et al.19 and Zhao et al.,23 which also confirm the validity of the simulation methods used here.
| T/K | References | PGN | ●Peak 1 | ↓Δσ/GPa | ♦Trough | ▼Peak 2 | ||||
|---|---|---|---|---|---|---|---|---|---|---|
| εc | εc | 1st σ/GPa | 1st εc | σ/GPa | εTr | 2nd σ/GPa | Δε | 2nd εc | ||
| 8 | 26.9% (ref. 19) | 27.0% | 33.98 | 19.1% | 22.79 | 11.19 | 20.4% | 22.70 | 8.2% | 28.6% |
| 50 | 25.0% | 32.69 | 19.1% | 20.85 | 11.84 | 18.7% | 20.61 | 7.8% | 26.5% | |
| 100 | 23.7% (ref. 19) | 23.8% | 31.62 | 18.5% | 21.10 | 10.52 | 18.8% | 20.03 | 7.0% | 25.8% |
| 200 | 23.1% | 29.46 | 17.4% | 19.62 | 9.84 | 17.8% | 19.38 | 7.4% | 25.2% | |
| 300 | 20.4% (ref. 19)/20.0% (ref. 23) | 21.7% | 26.22 | 16.4% | 18.31 | 7.91 | 16.9% | 18.12 | 7.7% | 24.6% |
| 500 | 18.5% | 19.66 | 13.6% | 14.49 | 5.17 | 15.6% | 15.95 | 7.6% | 23.2% | |
| VPE = (P(t) − P(t0))/N, | (2) |
The stretching strength of a sample will be expressed by the critical values of x-strain, and the effects of the major factors, such as temperature, strain rate/loading speed, Np and Nc, on the strength will be demonstrated. Accordingly, the stress along the stretching direction, referred to as x-stress, will be recorded at each x-strain (the engineering strain rate times steps in the x-direction). Actually, the x-stress is the virial stress40 considering 3.4 Å as the thickness of a surface layer. The normal stress in the x-direction in the virial stress tensor is defined as
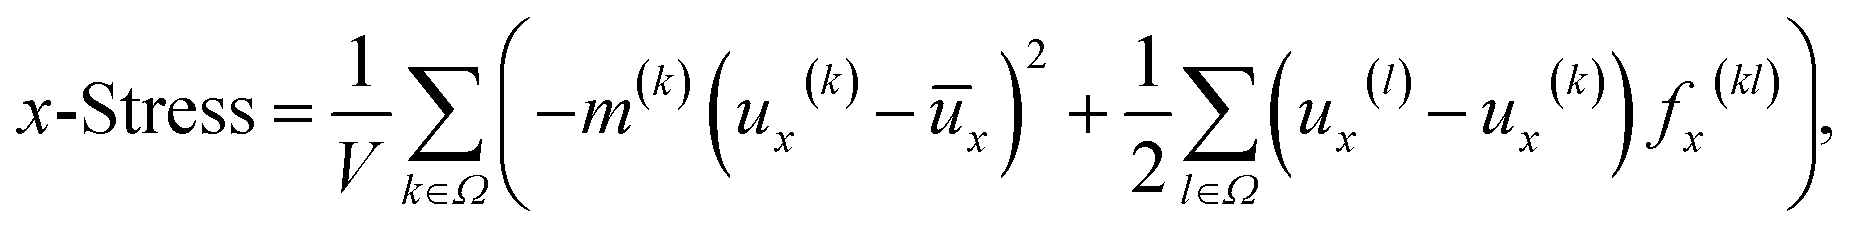 | (3) |
When stretching under the given engineering strain rate έ, the length of the sample can be calculated by
| L(t) = L(t0) × [1 + έ(t − t0)], | (4) |
3 Results and discussion
3.1 Responses of carbon networks with Np = 3 under uni-axial tension
(a) P3C2 modelIn Fig. 2, the VPE of the four layers (i.e., top, core 1, core 2 and bottom) in the P3C2 sample at a temperature between 8 K and 500 K is illustrated. The results indicate several characteristics of the sample under uniaxial tension.
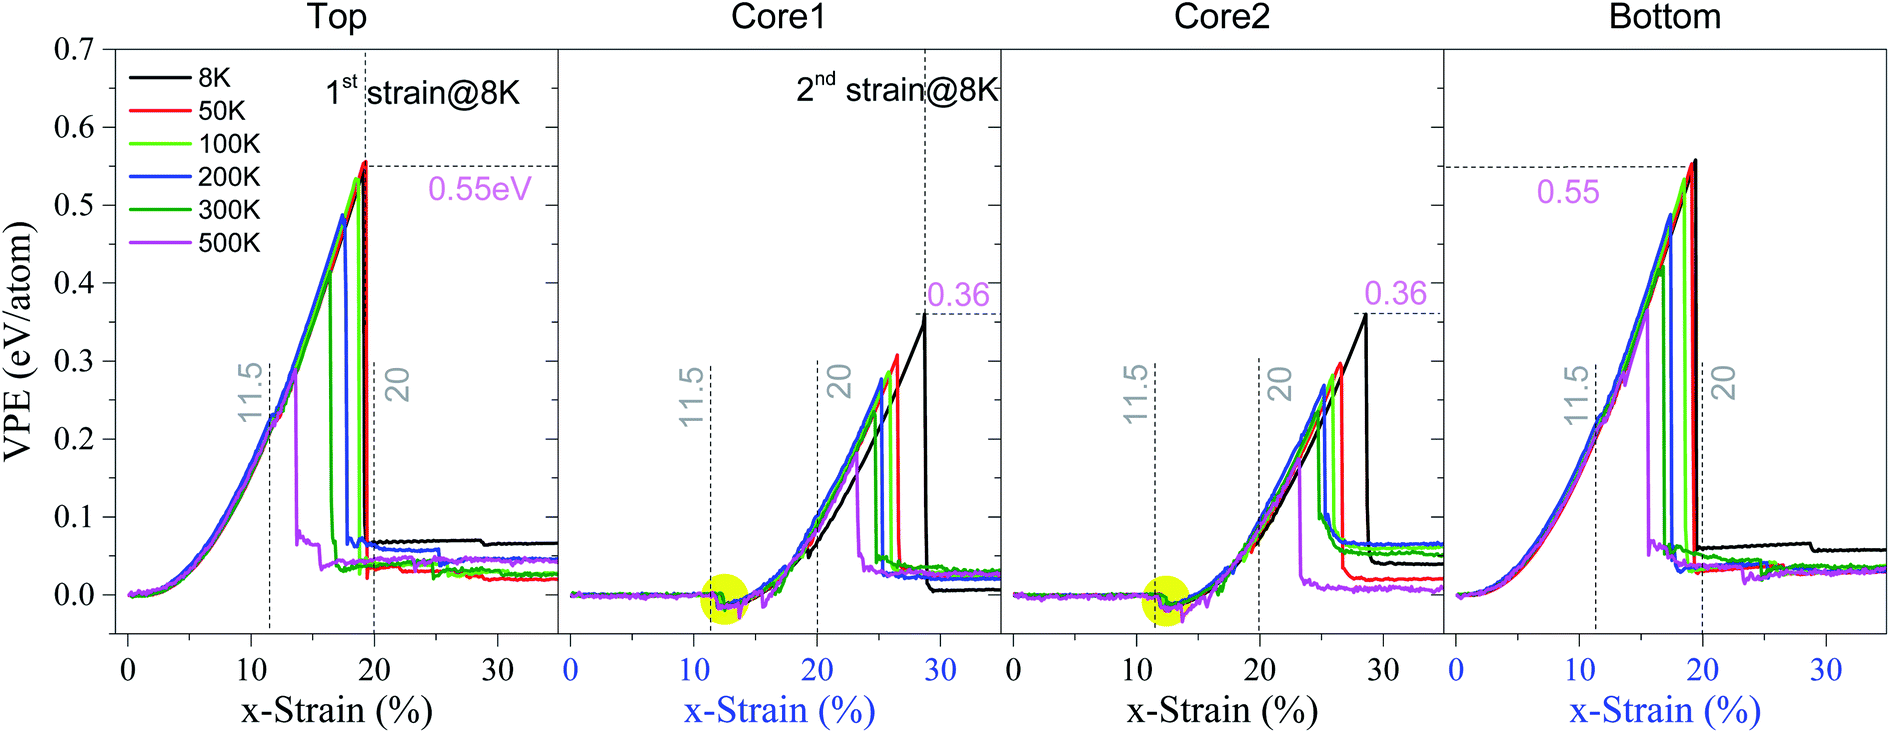 | ||
| Fig. 2 Histories of VPE per atom of the P3C2 sample under the strain rate of 0.1% per ps at different temperatures. Note that 1st strain = 1st εc and 2nd strain = 2nd εc. | ||
First, the two surface layers have approximately the same critical strain, i.e., 1st critical strain labeled as 1st εc. Similarly, the two core layers have the same 2nd critical strain (and labeled as 2nd εc). The two critical strains demonstrate the sample's stretching strength. Details on ductility will be given below.
Second, temperature influences the tensile strength significantly. For example, at a temperature below 100 K, the two surface layers have a critical strain of ∼19%. However, the value of 1st εc reduces to 16.4% at 300 K or 13.6% at 500 K, which is lower than that of the pristine graphene under the same conditions (see Tables 2 or S1 in ESI†). This reduction is due to the sp3 bonds that connect surface layers and core layers via benzene molecules.
Third, the VPE curve of a surface layer contains two stages, i.e., continuous increasing and a sharp drop after the strain exceeds the 1st εc. However, the VPE curve of the core layer has one more stage, i.e., VPE keeps unchanged near zero with a small x-strain, which demonstrates that the core layer has no elastic deformation in this stage.
Fourth, for the sample with x-strain between 11.5% and 20%, the VPE of the core layers decreases first and then increases untill approaching 1st εc. The VPE decreases due to two facts. One is the core layers being attracted by and attaching to the surface layer (Fig. 3a). The other is the core layer attached during deformation (snapshot in Fig. 3a with x-strain of 12.3%). In this period, the core buckles41–44 and the carbon network shrinks along the y-direction according to the snapshot in Fig. 3a. After that, the core layers work together with the two surface layers against the stretching load, which means that the system is in the co-working state. For example, at 8 K, the carbon network is kept undamaged before x-strain approaching 19%. However, at 19.1% (1st εc), the surface layer breaks (Fig. 3b). The core layers break after the x-strain reaches 28.6% (2nd εc) (Fig. 3c and Table 2), which is greater than that of the pristine graphene under the same conditions (detailed data can also be found in Table S1 in ESI†). It means that the sandwich carbon network's ductility is enhanced when considering the bond breakage in surface layers as “plastic deformation”.
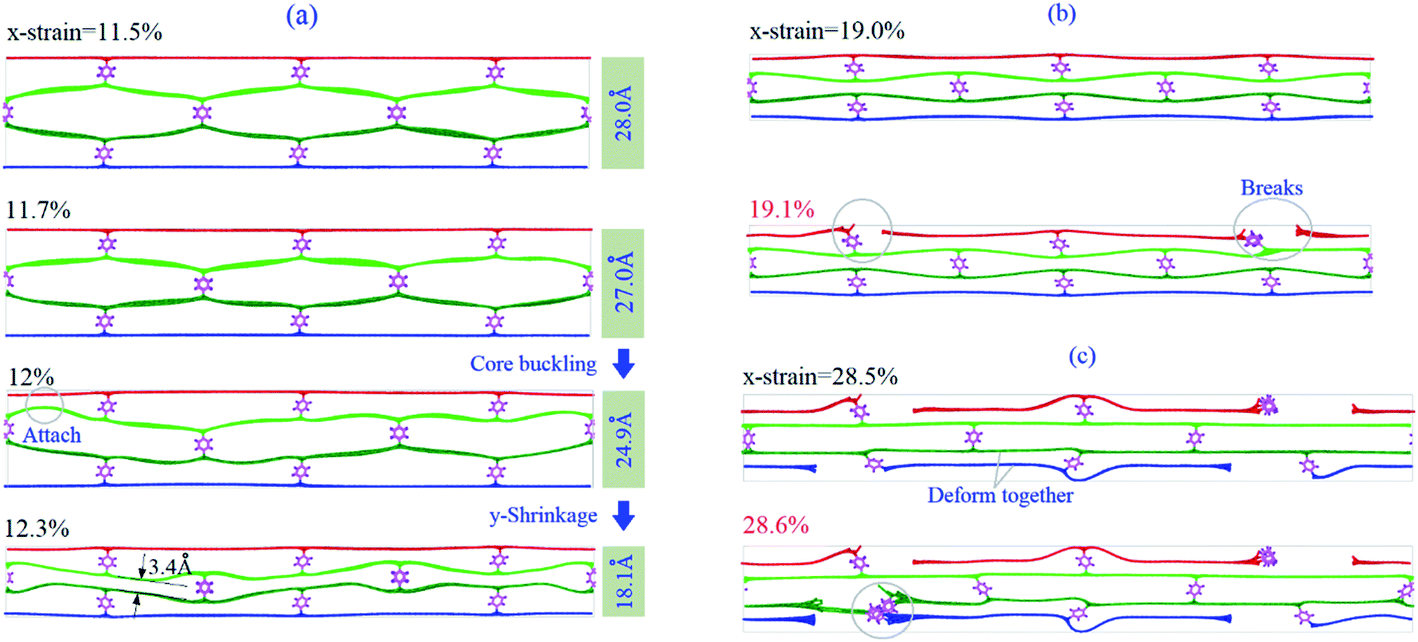 | ||
| Fig. 3 Typical snapshots of the P3C2 sample under the strain rate of 0.1% per ps at 8 K. (a) The sample buckles with a sharply decreasing height when the x-strain is between 11.7% and 12.3%, (b) top layer breaks at x-strain = 19.1%, and (c) core 2 breaks when x-strain = 28.6%. | ||
Fig. 4 shows the stress–strain curves of the P3C2 sample under different stretching conditions. In Fig. 4a, the curves differ slightly before x-strain approaching 11.5%, and the (first) slope/modulus is ∼130 GPa (Fig. 4b). When x-strain is between 12.5% and 19.1%, the increment of stress is ∼15.3 GPa, which means the (second) modulus is ∼232 GPa. The second modulus of the sample is much higher than the first modulus due to two facts, which are the four layers work together in the co-working period, and the sample shrinks in y-direction leading to a lower volume of the sample (see eqn (3)). For the sample with the x-strain between 20% and 28.5%, the stress increases 10.5 GPa, which indicates that the (third) modulus of the sample is ∼124 GPa. It is lower than the first modulus only because the simulation box's volume becomes higher when the surface layer breaks (Fig. 3c).
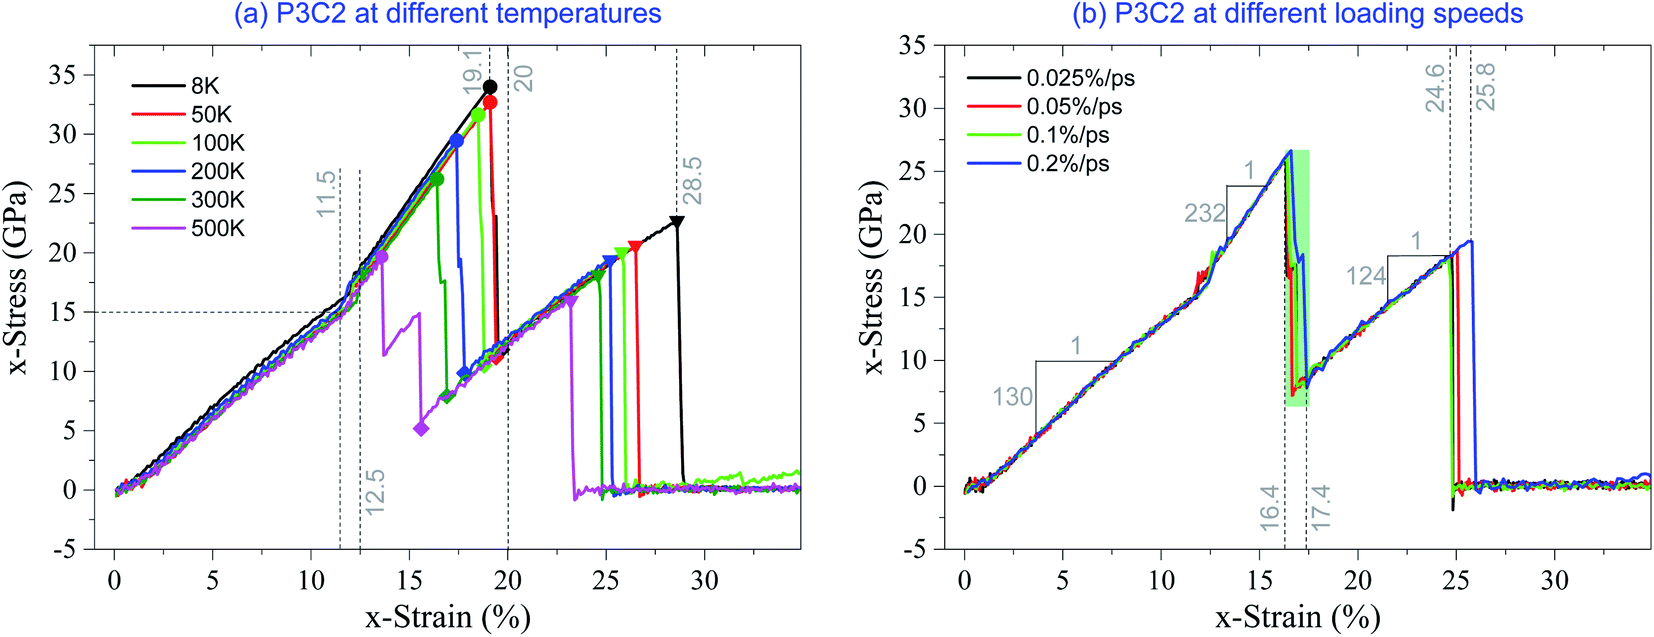 | ||
| Fig. 4 Stress–strain curves of the P3C2 sample under tension, (a) at different temperatures with strain rate of 0.1% per ps, and (b) at different loading speeds with temperature of 300 K. | ||
From eqn (3), we know that the magnitude of stress is inversely proportional to the simulation box's volume. To reflect the stretching strength of the carbon network, we measure the strength using the two critical strains. As shown in Table 2, 1st εc decreases with the increase in temperature, and 2nd εc changes from 28.6% at 8 K to 23.2% at 500 K. However, after breaking of surface layers, the increment of strain is not sensitive to temperature.
Fig. 4b shows the stress–strain curves to different loading speeds. The curves are overlapped when x-strain is between 0 and 11.5%, or between 13.2% and 14.6%, or between 18% and 24.6%, which means that the loading speeds slightly influence the three moduli. When x-strain is in the interval (11.5%, 13.2%), noticeable differences exist among the curves since the core layers have different buckling process at different loading speeds, when in the interval of (16.4%, 17.4%), curves differ, as the surface layers have different breakage processes.
(b) P3C3 model
Fig. 5a gives the VPE curves of the five layers in the P3C3 model under the strain rate of 0.1% per ps at 300 K. The two surface layers have the same values of VPE before breakage happens. The top layer breaks at x-strain = 16.7%, while the bottom layer breaks when the x-strain exceeds 17.4%. The three core layers have approximately the same VPE in tension before breakage happening at x-strain = 25.8% (Fig. 5b). The co-working region of x-strain is between 12.3% and 16.6% (highlighted with a gray background in Fig. 5a).
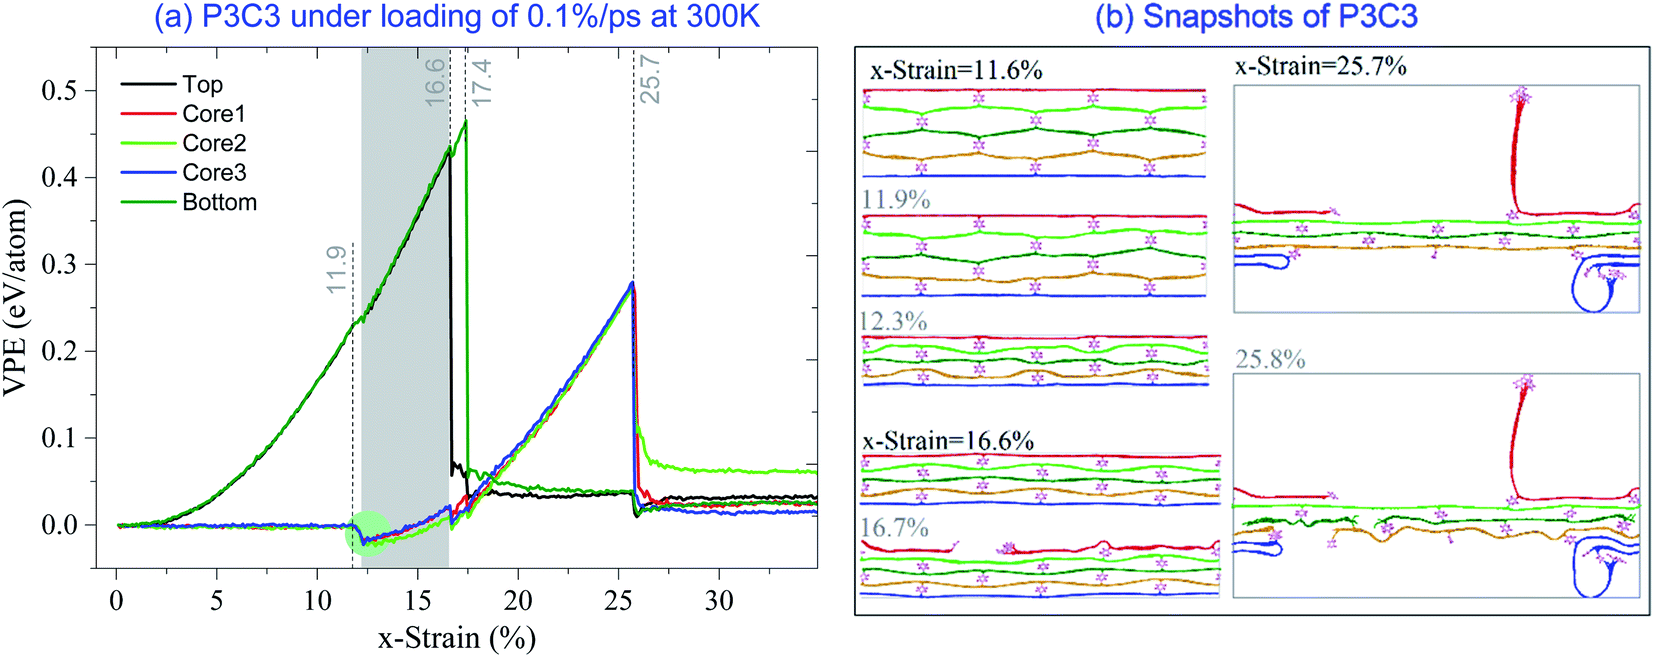 | ||
| Fig. 5 VPE per atom of the P3C3 sample under the strain rate of 0.1% per ps at 300 K. (a) VPE curves, (b) snapshots. | ||
The same phenomenon, i.e., VPE of the core layers decreases soon after the x-strain > 11.9%, as shown in Fig. 5a. According to the snapshots in Fig. 5b, the sample shrinks sharply between x-strain = 11.9% and 12.3%. The core structure buckles,41–44 and the three core layers attach. Between 16.6% and 17.4% of x-strain, VPE of the core layers has fluctuations caused by the co-working of the surface layers and the core 1 and core 3 layers in deformation (similar to 25.7%-snapshot in Fig. 5b).
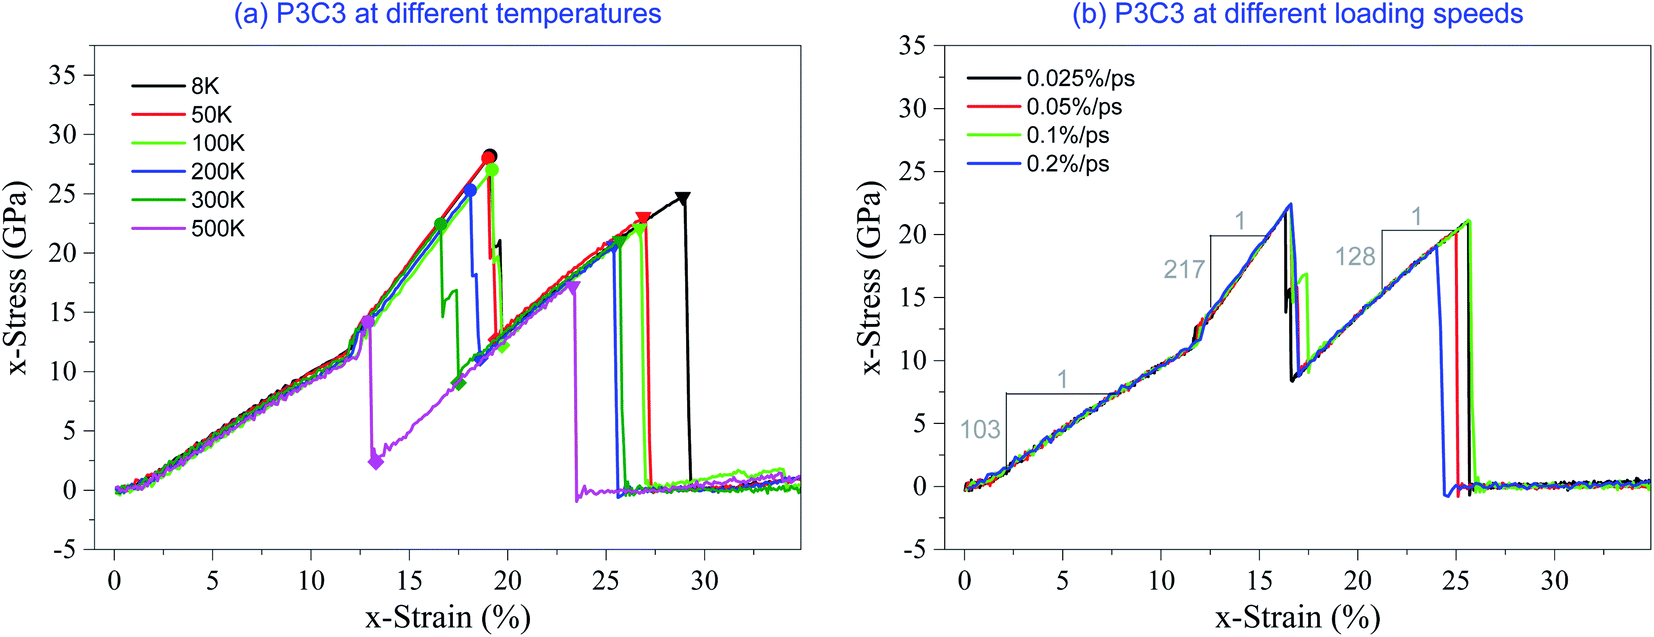
Fig. 6 shows the stress–strain curves of the P3C3 sample considering the effects of temperature and loading rate. It demonstrates that the critical strains are sensitive to temperature but insensitive to the loading rate. The results listed in Table 3 indicate that the critical strains are slightly different from those obtained from the P3C2 model at the same temperature below 500 K. Hence, the critical strain is independent of the number of core layers.
 | ||
| Fig. 6 Stress–strain curves of the P3C3 sample under tension. (a) At different temperatures at the strain rate of 0.1% per ps, (b) at different loading speeds with a temperature of 300 K. | ||
| T | PGN | ●Peak 1 | ↓Δσ/GPa | ♦Trough | ▼Peak 2 | ||||
|---|---|---|---|---|---|---|---|---|---|
| εc | 1st σ/GPa | 1st εc | σ/GPa | εTr | 2nd σ/GPa | Δε | 2nd εc | ||
| 8 K | 27.0% | 28.2 | 19.1% | 15.5 | 12.6 | 19.7% | 24.7 | 9.2% | 28.9% |
| 50 K | 25.0% | 28.0 | 19.0% | 15.3 | 12.7 | 19.4% | 23.1 | 7.8% | 26.9% |
| 100 K | 23.8% | 27.0 | 19.2% | 14.7 | 12.2 | 19.7% | 22.1 | 7.0% | 26.7% |
| 200 K | 23.1% | 25.3 | 18.1% | 14.5 | 11.1 | 18.6% | 20.6 | 7.4% | 25.4% |
| 300 K | 21.7% | 22.4 | 16.6% | 13.5 | 9.0 | 17.5% | 21.0 | 7.7% | 25.7% |
| 500 K | 18.5% | 14.2 | 12.9% | 11.8 | 2.4 | 13.3% | 17.2 | 7.6% | 23.3% |
However, compared to P3C2 at the same temperature, P3C3 has a lower stress level due to the larger volume with the same critical strain according to eqn (3). Comparing the values of a sharp jump of stress (↓σ) at the first critical strains in Tables 2 and 3, P3C3 has a lower stress decline than P3C2, i.e., the stress fluctuation of P3C3 is weaker. It implies that more core layers will reduce stress fluctuation, which is significant for the application of the carbon network in bearing displacement load.
We also calculated the three moduli of P3C3 according to its stress–strain curves. It shows that the first modulus is only 103 GPa (Fig. 6b), which is less than 130 GPa of P3C2. In this stage, only surface layers bear the external load. The two samples have the same surface layers, but P3C3 has a larger volume leading to lower stress levels. Hence, P3C3 has a lower 1st modulus. The second and third moduli are 217 GPa and 128 GPa, respectively, which are slightly different from those calculated for P3C2. In this stage, only the core layers are under stretching, and the sample volume is approximately proportional to the number of core layers. Therefore, the 2nd or the 3rd modulus of the two samples differ slightly. It is also the major reason for providing no more discussion on the samples with more core layers in this study.
3.2 Responses of carbon networks with more periodic cells in stretching direction
Based on the above discussion, the stress–strain curve can well describe the mechanical behavior of the sandwich carbon network under the uniaxial tension. In Fig. 7, the stress–strain curves of the samples with more periodic cells are given considering the temperature effect. Detailed information on critical strains and stresses can be found in Table S1 in the ESI.† It can be found that the two samples with Np = 4 have a narrow co-working region at low temperature (highlighted with a light green background in Fig. 7a). However, when Np > 4, there is no co-working region for all the layers in a sample. The reason is that the length difference between the core and the surface layers becomes larger with greater Np.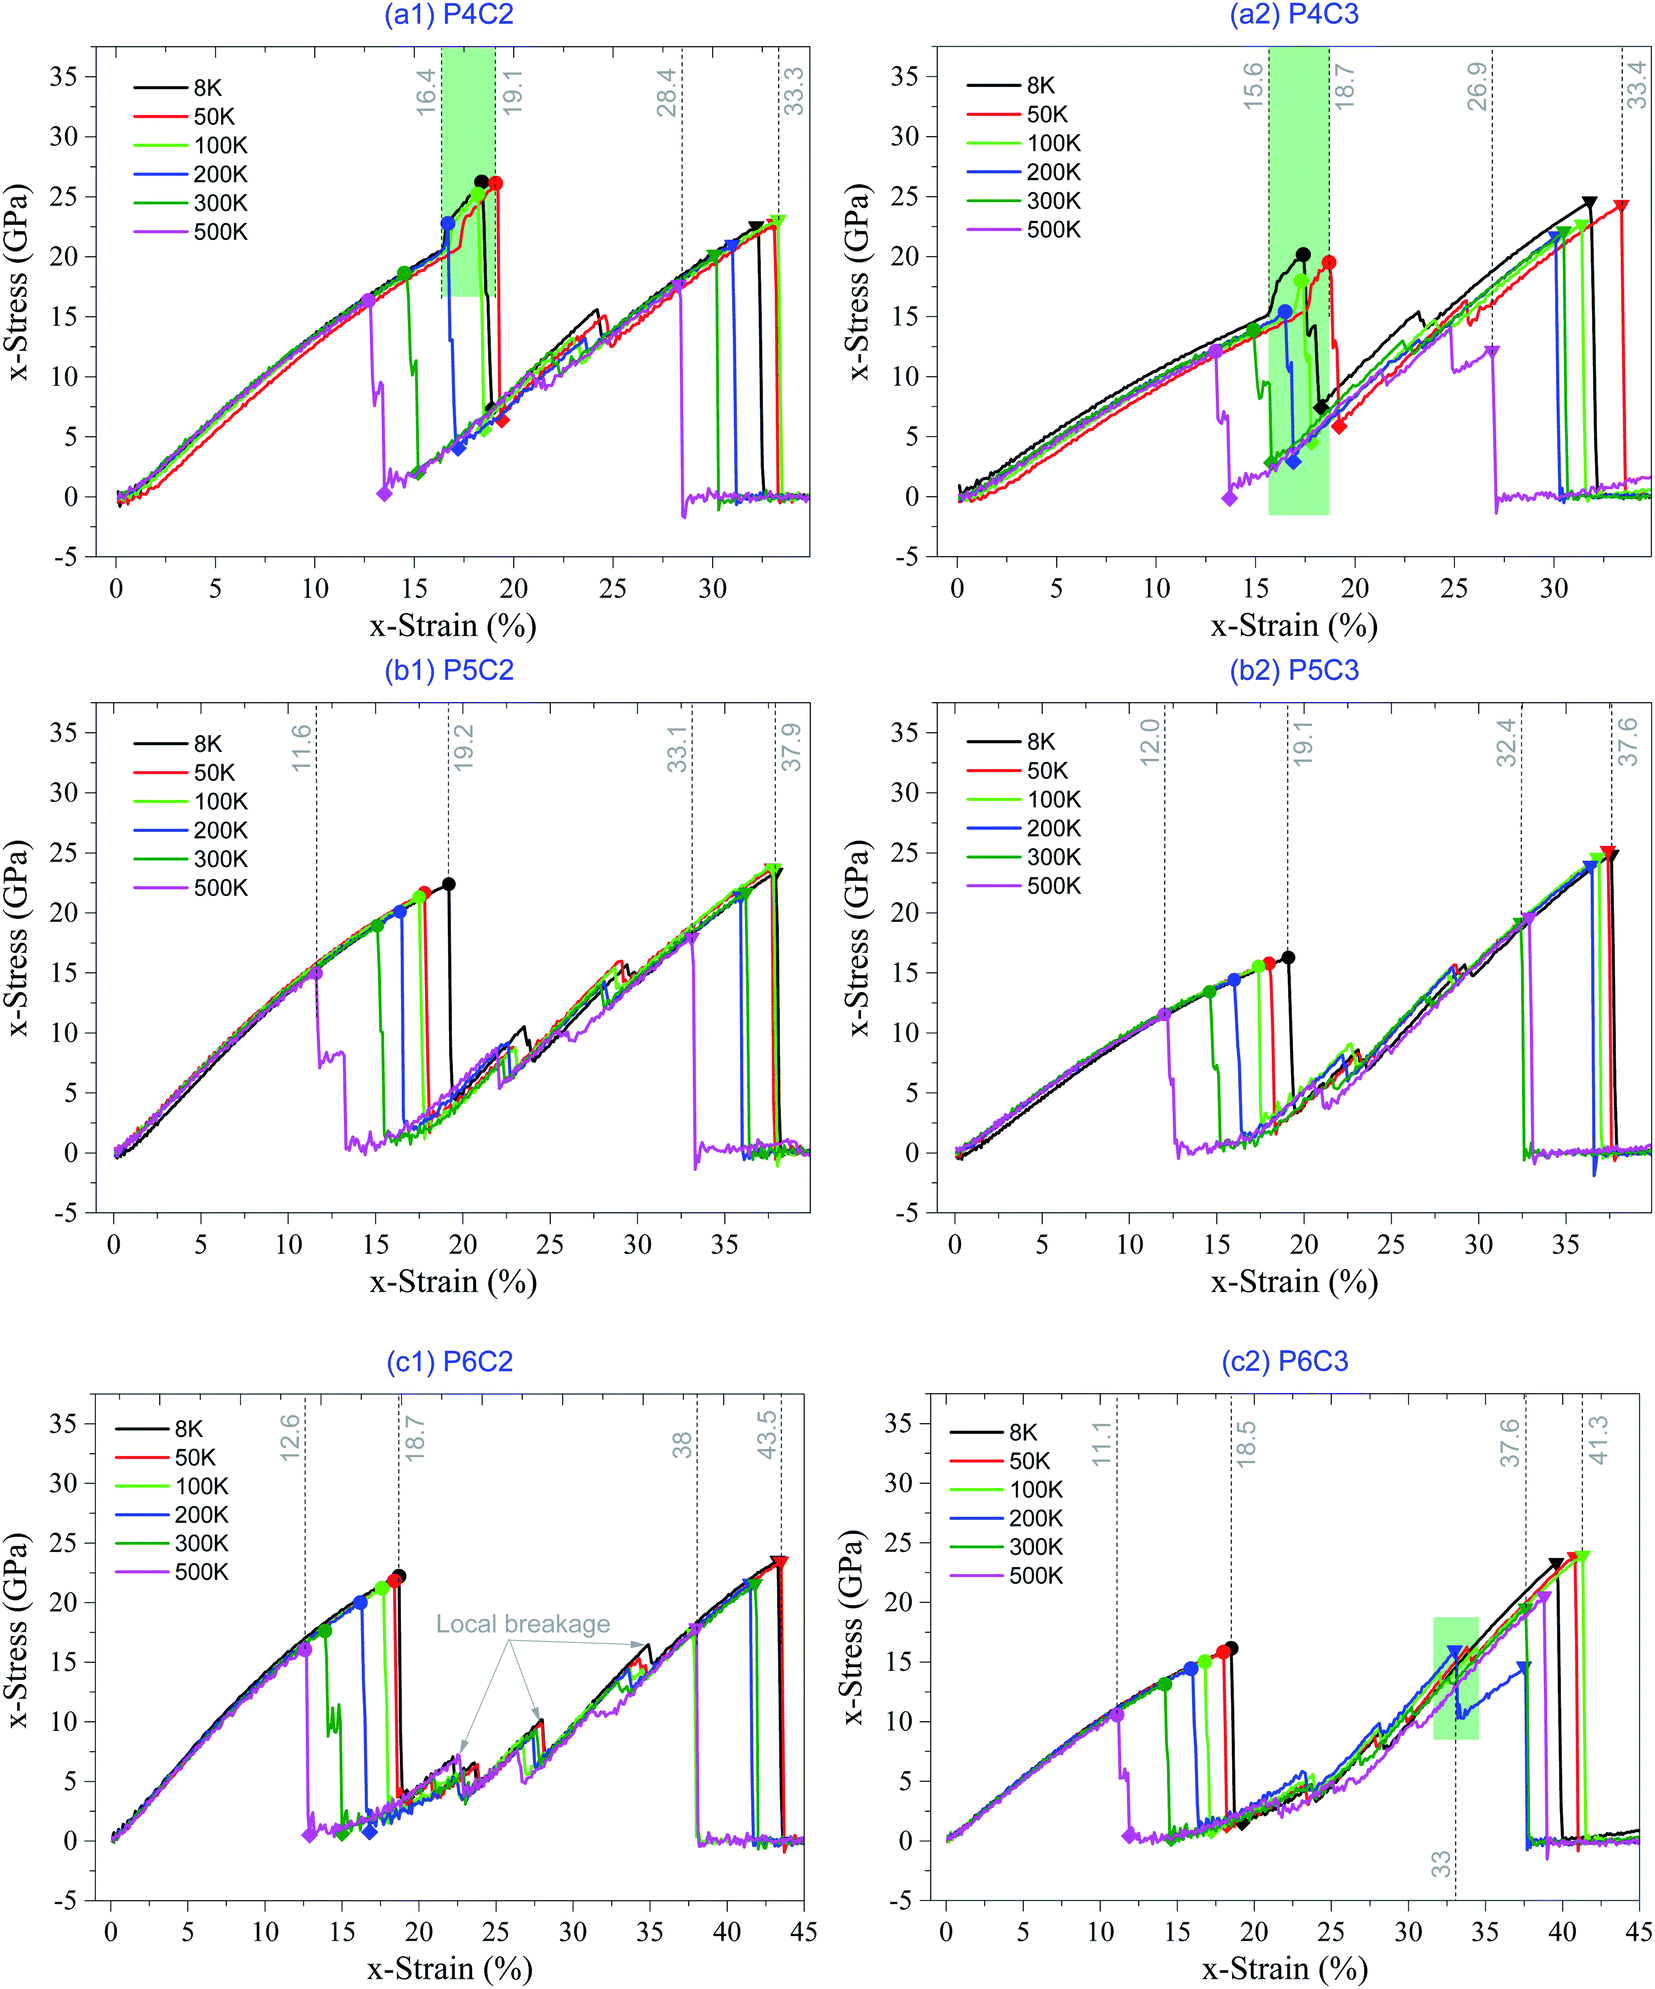 | ||
| Fig. 7 Stress–strain curves of the samples under loading speed of 0.1% per ps at different temperatures. (a) P4C2 and P4C3, (b) P5C2 and P5C3, and (c) P6C2 and P6C3. | ||
Another interesting phenomenon in Fig. 7 is that more sudden jumps in the stress–strain curves happen after the surface layers break (i.e., x-strain > 1st εc), when the sample has more periodic cells. The reason is that the surface breakage first happens at one benzene-bonded line in the surface layer (either the top or bottom). However, the broken surface layers and the core layers are still connected via the rest lines of benzene molecules (Fig. 8b and 9b). It also indicates the ductility of the sandwich carbon network is improved when the local breakages are considered as the plastic deformation of the sample. During further stretching, the co-working segments in the surface layers break one by one (Fig. 8b and 9b), and each breakage leads to a sudden drop of stress. In further relaxing the system, VPE (Fig. 8a and 9a) decreases due to self-attraction between core layers.
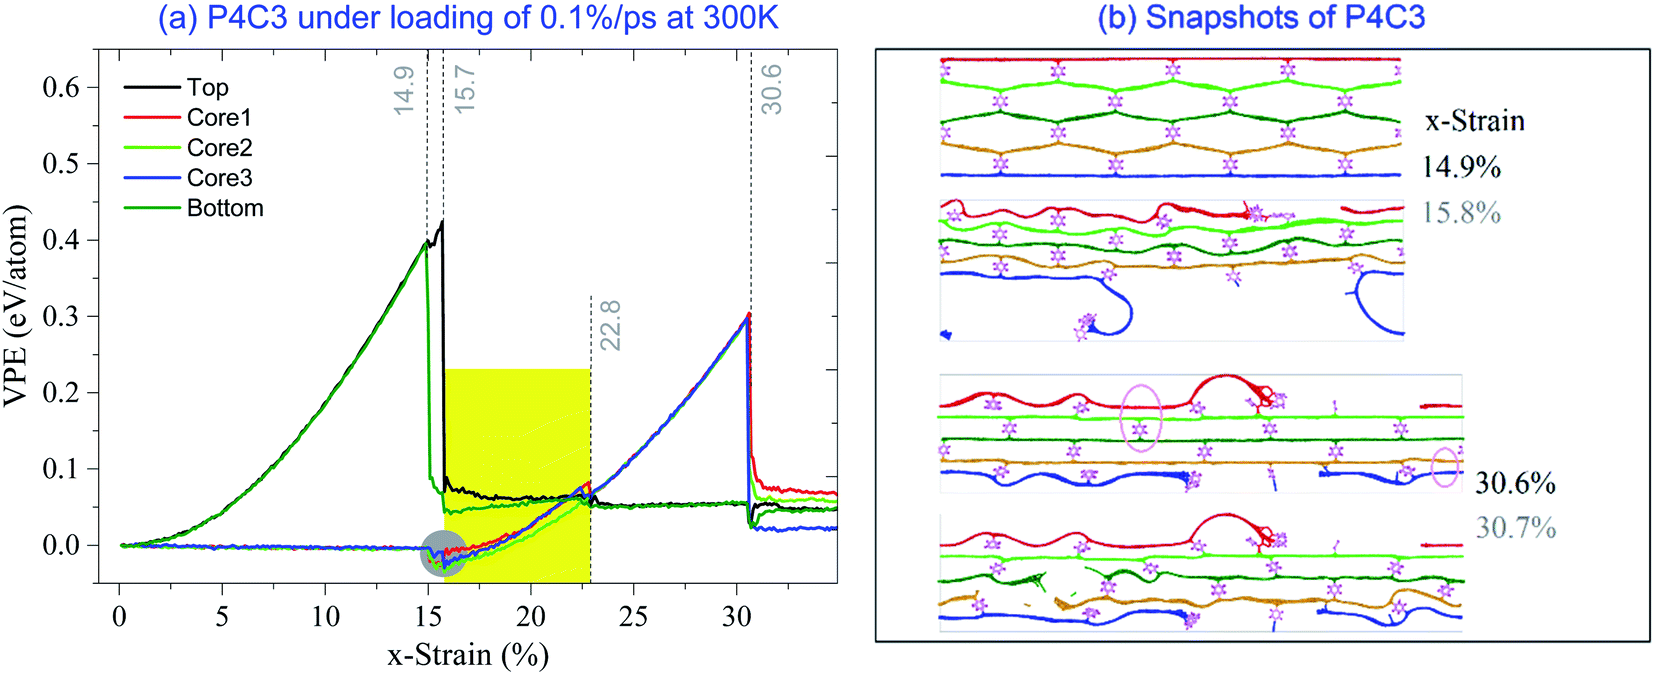 | ||
| Fig. 8 VPE curves of P4C3 under the loading speed of 0.1% per ps at 300 K. (a) VPE, (b) snapshots. | ||
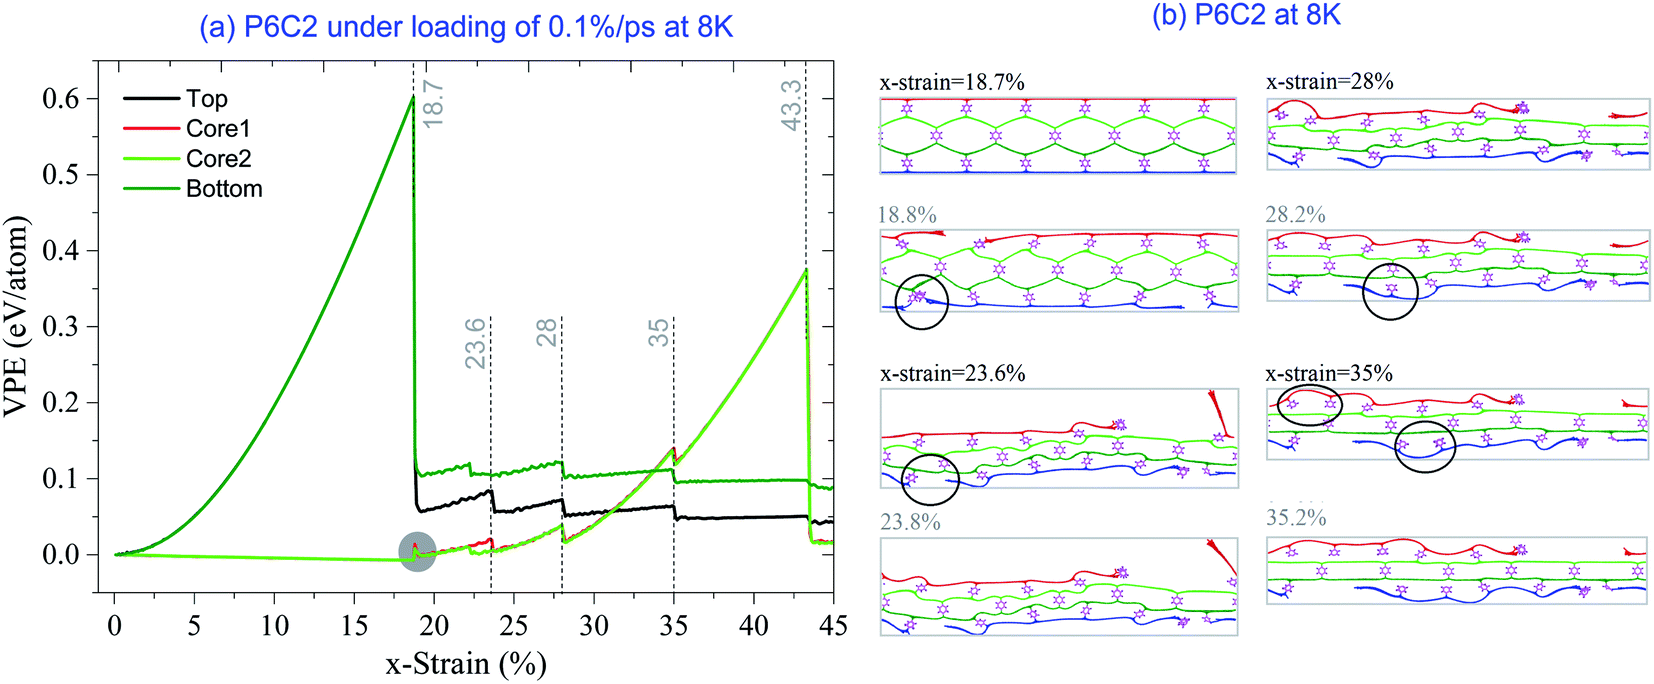 | ||
| Fig. 9 VPE curves of P6C2 under the loading speed of 0.1% per ps at 8 K. (a) VPE, (b) snapshots. | ||
When comparing the two samples with the same Np but different Nc, we find that the difference between critical strains is negligible at the same temperature (Fig. 7 and Table S1 in the ESI†). It further verifies that the number of core layers slightly influences the critical strains.
When observing the sudden change of the configurations in Fig. 8b, it can be found that the sample has no buckling of core layers before the surface layer breaks (comparing snapshots to x-strain = 14.9% and 15.8%). The reason is that the core layers are longer than the surface layers. The core layer is still not bearing the external deformation when the surface layers break entirely. Without heavy elongation, the core layers cannot get closer to each other and have no chance to attach. After the breakage of surface layers, the core layer shrinks quickly in the transverse direction to bear the stretching deformation.
3.3 Analysis of critical strains with respect to the sandwich carbon network and pristine graphene
As aforementioned, the sandwich carbon network under the uniaxial tensile load contains two critical strains, i.e., 1st critical strain and a higher 2nd critical strain. The 2nd critical strain indeed represents the ductility of the carbon network. Herein, the critical strain of the carbon networks (2nd critical strain) and that of the pristine graphene sheet under the same conditions are illustrated in Fig. 10. Since the number of core layers has little effect on the critical strains (Table S1 in the ESI†), the critical strains with certain RLayer plotted here are the averages of the critical strains of carbon networks with two and three core layers.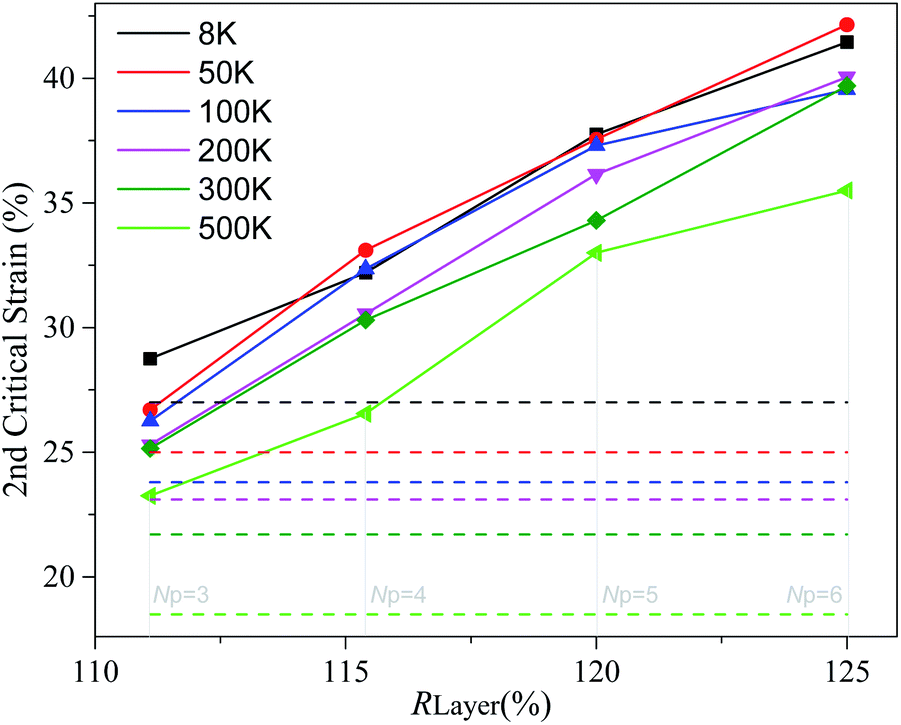 | ||
| Fig. 10 The 2nd critical strains of sandwich carbon networks with different RL layer under the uniaxial tensile load at the strain rate of 0.1% per ps under different temperatures. The critical strains of the carbon network and pristine graphene under the same temperature are given with the same color, while the former is plotted with solid lines with symbols and the latter is drawn with broken lines. | ||
Fig. 10 indicates that the 2nd critical strain is proportional to Np but decreases with an increase in temperature. More importantly, the 2nd critical strains of the sandwich carbon network are greater than those of pristine graphene under the same conditions, particularly with higher Np in the system. For example, when RLayer = 125.0% (Np = 6), the critical strain at room temperature (300 K) can reach 39.7%, which is almost twice as much as that for pristine graphene (21.7%).
Alternatively, compared to that of pristine graphene, the ductility of the sandwich carbon network is highly improved. Since the 2nd critical strain increases linearly with Np, a new carbon network with higher ductility can be designed with specific Np. This will benefit its application in bearing large deformation.
4 Conclusions
Recently, considerable attention has been paid to the formation of new carbon nanomaterials based on low-dimensional materials such as graphene. In this study, to further improve the pristine graphene's ductility, we designed a sandwich carbon network by bonding graphene ribbons with benzene molecules. Using the molecular dynamics simulation approach, we evaluated the strength and ductility of the new carbon network considering the effects of cell geometries, temperature, and loading speed. According to the results, the following conclusions are drawn.First, due to the length difference between the surface and core layers, the carbon network under uniaxial tensile load contains two critical strains. The surface layers break at the 1st critical strain, while the core layers break at the higher 2nd critical strain. The 2nd critical strain represents the ductility of the carbon network.
Second, when the difference between the surface and core layers' lengths is less than 20%, the stress–strain curve of the carbon network has three different moduli. The 1st modulus appears when only the surface layers bear the load. The 2nd modulus is the highest among the three moduli due to the co-working of all the layers. The 3rd modulus reflects the stiffness of the core layers.
Third, the critical strains of the sandwich carbon network decrease with temperature, but slightly depend on either loading speeds or the number of core layers.
Finally, the 2nd critical strain in the new carbon network is higher than that of the pristine graphene and increases with an increase in Np. Alternatively, compared to that of the pristine graphene, the ductility of the new carbon network is improved and tunable.
Compliance with ethical standards
The authors comply with the ethical rules for this journal.Author contributions
Jiao Shi: conceptualization, formal analysis, funding acquisition, investigation, methodology, project administration, supervision, writing-original draft. Jia-Long Zhang: data curation, formal analysis, investigation. Jia-Xing Ji: data curation, formal analysis, investigation. Bo Song: formal analysis, investigation, methodology, writing-original draft, visualization.Conflicts of interest
The authors declare that they have no conflict of interests.Acknowledgements
Financial supports from National Key Research and Development Plan, China (Grant No. 2017YFC0405102) and State Key Laboratory of Structural Analysis for Industrial Equipment, Dalian University of Technology, Dalian 116024, China (Grant No. GZ18111), are acknowledged.References
- M. F. Yu, O. Lourie and M. J. Dyer, et al., Strength and breaking mechanism of multiwalled carbon nanotubes under tensile load, Science, 2000, 287(5453), 637–640 CrossRef CAS.
- C. G. Lee, X. D. Wei and J. W. Kysar, et al., Measurement of the elastic properties and intrinsic strength of monolayer graphene, Science, 2008, 321(5887), 385–388 CrossRef CAS.
- A. A. Balandin, S. Ghosh and W. Z. Bao, et al., Superior thermal conductivity of single-layer graphene, Nano Lett., 2008, 8(3), 902–907 CrossRef CAS.
- K. I. Bolotin, K. J. Sikes and Z. Jiang, et al., Ultrahigh electron mobility in suspended graphene, Solid State Commun., 2008, 146(9–10), 351–355 CrossRef CAS.
- A. A. Balandin, Thermal properties of graphene and nanostructured carbon materials, Nat. Mater., 2011, 10(8), 569–581 CrossRef CAS.
- Z. Qin, G. S. Jung and M. J. Kang, et al., The mechanics and design of a lightweight three-dimensional graphene assembly, Sci. Adv., 2017, 3(1), e1601536 CrossRef.
- Z. Chen, W. Ren and L. Gao, et al., Three-dimensional flexible and conductive interconnected graphene networks grown by chemical vapour deposition, Nat. Mater., 2011, 10(6), 424–428 CrossRef CAS.
- L. Jiang and Z. Fan, Design of advanced porous graphene materials: from graphene nanomesh to 3D architectures, Nanoscale, 2014, 6(4), 1922–1945 RSC.
- K. Cai, J. Luo and Y. R. Ling, et al., Effects of size and surface on the auxetic behaviour of monolayer graphene kirigami, Sci. Rep., 2016, 6, 35157 CrossRef CAS.
- C. Wang, C. Zhang and S. H. Chen, Micro-mechanism and influencing factors of graphene foam elasticity, Carbon, 2019, 148, 267–276 CrossRef CAS.
- C. Wang, C. Zhang and S. H. Chen, The microscopic deformation mechanism of 3D graphene foam materials under uniaxial compression, Carbon, 2016, 109, 666–672 CrossRef CAS.
- Y. Yang, K. Cai and J. Shi, et al., Shrinkage-expansion of a tri-isometric knitting from graphene ribbons at finite temperature, Mater. Des., 2020, 185, 108269 CrossRef CAS.
- Y. Yang, K. Cai and J. Shi, et al., Nanotextures from orthogonal graphene ribbons: thermal stability evaluation, Carbon, 2019, 144, 81–90 CrossRef CAS.
- L. Q. Xu, N. Wei and Y. P. Zheng, et al., Graphene-nanotube 3D networks: intriguing thermal and mechanical properties, J. Mater. Chem., 2012, 22(4), 1435–1444 RSC.
- M. K. Blees, A. W. Barnard and P. A. Rose, et al., Graphene kirigami, Nature, 2015, 524(7564), 204–207 CrossRef CAS.
- J. W. Jiang, J. T. Leng and J. X. Li, et al., Twin graphene: a novel two-dimensional semiconducting carbon allotrope, Carbon, 2017, 118, 370–375 CrossRef CAS.
- Z. T. Bai, L. Zhang and H. Y. Li, et al., Nanopore creation in graphene by ion beam irradiation: geometry, quality, and efficiency, ACS Appl. Mater. Interfaces, 2016, 8(37), 24803–24809 CrossRef CAS.
- S. Sadeghzadeh and L. Liu, Resistance and rupture analysis of single- and few-layer graphene nanosheets impacted by various projectiles, Superlattices Microstruct., 2016, 97, 617–629 CrossRef CAS.
- J. Shi, C. W. Hu and J. H. Shen, et al., Mechanical properties of bonded few-layered graphene via uniaxial test: a molecular dynamics simulation study, Comput. Mater. Sci., 2020, 172, 109295 CrossRef CAS.
- M. X. Chen, A. R. Muniz and D. Maroudas, Formation and mechanical behavior of nanocomposite superstructures from interlayer bonding in twisted bilayer graphene, ACS Appl. Mater. Interfaces, 2018, 10(34), 28898–28908 CrossRef CAS.
- J. Cumings and A. Zettl, Low-friction nanoscale linear bearing realized from multiwall carbon nanotubes, Science, 2000, 289(5479), 602–604 CrossRef CAS.
- R. F. Zhang, Z. Y. Ning and Y. Y. Zhang, et al., Superlubricity in centimetres-long double-walled carbon nanotubes under ambient conditions, Nat. Nanotechnol., 2013, 8(12), 912–916 CrossRef CAS.
- H. Zhao, K. Min and N. R. Aluru, Size and chirality dependent elastic properties of graphene nanoribbons under uniaxial tension, Nano Lett., 2009, 9(8), 3012–3015 CrossRef CAS.
- J. Cao, K. Cai and Q. Wang, et al., Damage behavior of a bonded sandwich beam with corrugated core under 3-point bending, Mater. Des., 2016, 95, 165–172 CrossRef.
- F. J. Plantema, Sandwich construction : the bending and buckling of sandwich beams, plates, and shells, Aircr. Eng. Aerosp. Technol., 1966, 32(8), 186–191 Search PubMed.
- D. Zenkert, An introduction to sandwich structures, Engineering Materials Advisory Services, London, 1995 Search PubMed.
- S. Plimpton, Fast parallel algorithms for short-range molecular dynamic, J. Comput. Phys., 1995, 117, 1–19 CrossRef CAS.
- S. J. Stuart, A. B. Tutein and J. A. Harrison, A reactive potential for hydrocarbons with intermolecular interactions, J. Chem. Phys., 2000, 112(14), 6472–6486 CrossRef CAS.
- K. Cai, J. Z. Yu and J. Wan, et al., Configuration jumps of rotor in a nanomotor from carbon nanostructures, Carbon, 2016, 101, 168–176 CrossRef CAS.
- K. Cai, H. Yin and Q. H. Qin, et al., Self-excited oscillation of rotating double-walled carbon nanotubes, Nano Lett., 2014, 14(5), 2558–2562 CrossRef CAS.
- S. Zhu and T. Li, Hydrogenation-assisted graphene origami and its application in programmable molecular mass uptake, storage, and release, ACS Nano, 2014, 8(3), 2864–2872 CrossRef CAS.
- S. Z. Li, Q. Y. Li and R. W. Carpick, et al., The evolving quality of frictional contact with graphene, Nature, 2016, 539(7630), 541–545 CrossRef CAS.
- D. W. Brenner, O. A. Shenderova and J. A. Harrison, et al., A second-generation reactive empirical bond order (rebo) potential energy expression for hydrocarbons, J. Phys.: Condens. Matter, 2002, 14(4), 783–802 CrossRef CAS.
- J. E. Jones, On the determination of molecular fields. II. From the equation of state of a gas, Proc. R. Soc. London, 1924, 106(738), 463–477 CAS.
- G. Rajasekaran, P. Narayanan and A. Parashar, Effect of point and line defects on mechanical and thermal of graphene: a review, Crit. Rev. Solid State Mater. Sci., 2015, 1–25 Search PubMed.
- Y. Y. Zhang, Q. X. Pei and C. M. Wang, Mechanical properties of graphynes under tension: a molecular dynamics study, Appl. Phys. Lett., 2012, 101(8), 081909 CrossRef.
- Y. Y. Zhang, C. M. Wang and Y. Cheng, et al., Mechanical properties of bilayer graphene sheets coupled by sp3 bonding, Carbon, 2011, 49(13), 4511–4517 CrossRef CAS.
- W. G. Hoover, Canonical dynamics: equilibrium phase-space distributions, Phys. Rev. A: At., Mol., Opt. Phys., 1985, 31(3), 1695–1697 CrossRef.
- S. Nosé, A unified formulation of the constant temperature molecular dynamics methods, J. Chem. Phys., 1984, 81(1), 511–519 CrossRef.
- Q. X. Pei, Y. W. Zhang and V. B. Shenoy, A molecular dynamics study of the mechanical properties of hydrogen functionalized graphene, Carbon, 2010, 48(3), 898–904 CrossRef CAS.
- K. Cai, L. Wang and Y. M. Xie, Buckling behavior of nanotubes from diamondene, Mater. Des., 2018, 149, 34–42 CrossRef CAS.
- K. Cai, D. Y. Gao and Q. H. Qin, Post-buckling solutions of hyper-elastic beam by canonical dual finite element method, Math. Mech. Solid, 2013, 19(6), 659–671 CrossRef.
- K. Cai, J. Wan and L. K. Yang, et al., Buckling behaviour of composites with double walled nanotubes from carbon and phosphorus, Phys. Chem. Chem. Phys., 2017, 19(17), 10922–10930 RSC.
- Y. J. Luo, J. Xing and Y. Z. Niu, et al., Wrinkle-free design of thin membrane structures using stress-based topology optimization, J. Mech. Phys. Solids, 2017, 102, 277–293 CrossRef.
- K. Cai, X. Li, J. Shi and Q.-H. Qin, Nanospring from partly hydrogenated graphene ribbon: A molecular dynamics study, Appl. Surf. Sci., 2020, 148507 CrossRef.
Footnote |
| † Electronic supplementary information (ESI) available: Detailed information of critical strains and stresses for all the models adopted in this study. See DOI: 10.1039/d0ra09094h |
| This journal is © The Royal Society of Chemistry 2021 |