DOI:
10.1039/D0RA09241J
(Paper)
RSC Adv., 2021,
11, 452-461
Efficient activation of persulfate by calcium sulfate whisker supported nanoscale zero-valent iron for methyl orange removal†
Received
30th October 2020
, Accepted 6th December 2020
First published on 23rd December 2020
Abstract
In order to improve the utilization of nanoscale zero-valent iron (nZVI) in activating persulfate (PS), a composite material of nZVI/CSW with nZVI supported on calcium sulfate whiskers (CSWs) was synthesized in this study. The activity of the nZVI/CSW-PS system was evaluated by the removal of methyl orange (MO) in the aqueous phase. With the optimization of response surface methodology (RSM), the degradation efficiency of 20.0 mg L−1 MO could increase to 98.13% in 5 min at the dosage of 1.03 g L−1 nZVI/CSW-2, 3.51 mM PS at a temperature of 40.8 °C. The results of scanning electron microscopy (SEM) and X-ray diffraction (XRD) tests showed that the nZVI particles were well dispersed on the CSW surface in a Fe2+/CSW molar ratio of 0.25![[thin space (1/6-em)]](https://www.rsc.org/images/entities/char_2009.gif) :
:![[thin space (1/6-em)]](https://www.rsc.org/images/entities/char_2009.gif) 1, which is approximate to the theoretical value of 3.698 mg g−1 thin-layer-Fe supported on CSW. Furthermore, the results demonstrated that the thin-layer nZVI particles were the most efficient in activating PS, and nZVI was rapidly dispersed during the dissolution process of CSW, which greatly increased the reaction rate. γ-FeOOH is the main reaction product of nZVI/CSW-2. This study provides a novel advanced oxidation system with nZVI/CSW in wastewater pollution control.
1, which is approximate to the theoretical value of 3.698 mg g−1 thin-layer-Fe supported on CSW. Furthermore, the results demonstrated that the thin-layer nZVI particles were the most efficient in activating PS, and nZVI was rapidly dispersed during the dissolution process of CSW, which greatly increased the reaction rate. γ-FeOOH is the main reaction product of nZVI/CSW-2. This study provides a novel advanced oxidation system with nZVI/CSW in wastewater pollution control.
1. Introduction
Typical AOPs include ozonation,1 Fenton, photooxidation,2 electrochemical oxidation,3–5 non-thermal plasma,6,7 Persulfate (PS) advanced oxidation8 and combinations of these technologies. PS has recently gained considerable attention because of its high efficiency for the mineralization and degradation of refractory organic contaminants in water and soil.8,9 The reactive species, such as sulfate radicals (SO4˙−) and hydroxyl radicals (˙OH), are produced in this system, which has a high standard redox potential (SO4˙−: 2.5–3.1 V, ˙OH: 1.8–2.7 V).10–12
Persulfate (M2S2O8, M = Na, K, NH4) could be activated to produce SO4˙− under the activation of light,13 heat,14 transition metal ions,15,16 microwaves,17 and carbon material.18,19 Fe2+ activation is currently a common activation method, and the main reaction process is shown in eqn (1).20,21 Zero-valent iron can also be used in place of Fe2+.22,23 The surface of Fe0 spontaneously corrodes under aerobic or anaerobic conditions, releasing Fe2+ according to eqn (2) and (3).24 By contrast, Fe0 has numerous advantages over the direct catalytic process of Fe2+. Using Fe0 could reduce the excessive consumption of sulfuric acid root, avoid the introduction of other anions, and facilitate efficient water treatment with the selected organic contaminants as targets.25,26 Moreover, the release of H+ from persulfate decomposition leads to a reduction in pH in the Fe2+/PS system, resulting in secondary pollution in the environment.27,28 However, Fe0 tends to agglomerate due to its high surface energy and intrinsic magnetic interaction, thus restricting the reactivity.28 The rapid surface inactivation and the slow corrosion of Fe0 particles are the restriction factors of PS activation and its wide application in real-world scenarios. Therefore, improving the dissolution rate of Fe0 and enhancing the production of Fe2+ is the key to regulate the degradation performance of the S2O82−/Fe0 oxidation system effectively.
| | |
Fe2+ + 2S2O82− → Fe3+ + 2SO4˙− + 2SO42−,
| (1) |
| | |
2Fe0 + 0.5O2 + H2O → 2Fe2+ + 2OH−,
| (2) |
| | |
Fe0 + 2H2O → Fe2+ + 2OH− + H2.
| (3) |
A variety of materials, including attapulgite,24 organo-montmorillonite,29 biochar,30,31 activated carbon,32 reduced graphene oxide,33 and zeolite,34 have been investigated to support the effective dispersion and efficient utilization of nZVI during environmental remediation in previous research. Previous reports showed that graphene and activated carbon could effectively inhibit the oxidation of Fe0.35 Most of these materials were selected on the basis of their porous structure and large specific surface area. Few studies have considered materials with a small specific surface area, such as calcium sulfate whisker (CSW). CSW, a short-fiber crystal that grows in the form of a single crystal, is characterized by its high mechanical strength, good compatibility, loose structure, low density, and good dispersion in aqueous solutions36–38 in comparison with traditional materials. Research regarding PS activation by CSW-supported nZVI has not been reported.
CSW is used in the present work as a support of nZVI to prepare a novel nanocomposite material for the PS activation applied in methyl orange (MO) degradation, which is an intensely colored compound used in dyeing and printing textile.39 This study has the following objectives: (i) investigate the application parameters of the nZVI/CSW-activated PS system for the degradation of MO, including the molar ratio of Fe2+/CSW, the nZVI/CSW dose, the PS dose, and reaction temperature; (ii) explore the optimum conditions and combined effects of parameters through response surface methodology (RSM); (iii) evaluate the activation process of PS by CSW-supported nZVI.
2. Materials and methods
2.1. Materials
CSW was purchased from Shanghai Fengzhu Trading Co., Ltd (Shanghai, China). Ferrous sulfate heptahydrate (FeSO4·7H2O, >99.0%), sodium persulfate (K2S2O8, > 99.5%), sodium borohydride (NaBH4), MO and anhydrous ethanol (EtOH) were purchased from Sinopharm Chemical Reagent Co., Ltd (Shanghai, China).
2.2. Synthesis of nZVI/CSW
A liquid-phase reduction method was used to synthesize nZVI/CSW, and the main reaction was shown as eqn (4).40 First, 2 g of CSW was dissolved in a 100 mL mixture of ethanol and distilled water with a volume ratio of 3![[thin space (1/6-em)]](https://www.rsc.org/images/entities/char_2009.gif) :
:![[thin space (1/6-em)]](https://www.rsc.org/images/entities/char_2009.gif) 1. Then, the mixture was stirred mechanically at 100 rpm for 30 min after the addition of different amounts of FeSO4·7H2O and allowed to stand for 30 min. Afterward, excess NaBH4 solution (Fe2+/BH4− mol ratio at 1
1. Then, the mixture was stirred mechanically at 100 rpm for 30 min after the addition of different amounts of FeSO4·7H2O and allowed to stand for 30 min. Afterward, excess NaBH4 solution (Fe2+/BH4− mol ratio at 1![[thin space (1/6-em)]](https://www.rsc.org/images/entities/char_2009.gif) :
:![[thin space (1/6-em)]](https://www.rsc.org/images/entities/char_2009.gif) 4) was added into solution, and the reaction was continued for another 30 minutes. Finally, the solution was filtered and quickly rinsed with ethanol and deionized water three times, and then vacuum dried overnight. The experiment was placed under an N2 atmosphere. Different molar ratios of Fe2+/CSW at 0.1
4) was added into solution, and the reaction was continued for another 30 minutes. Finally, the solution was filtered and quickly rinsed with ethanol and deionized water three times, and then vacuum dried overnight. The experiment was placed under an N2 atmosphere. Different molar ratios of Fe2+/CSW at 0.1![[thin space (1/6-em)]](https://www.rsc.org/images/entities/char_2009.gif) :
:![[thin space (1/6-em)]](https://www.rsc.org/images/entities/char_2009.gif) 1, 0.25
1, 0.25![[thin space (1/6-em)]](https://www.rsc.org/images/entities/char_2009.gif) :
:![[thin space (1/6-em)]](https://www.rsc.org/images/entities/char_2009.gif) 1, 0.5
1, 0.5![[thin space (1/6-em)]](https://www.rsc.org/images/entities/char_2009.gif) :
:![[thin space (1/6-em)]](https://www.rsc.org/images/entities/char_2009.gif) 1, 1
1, 1![[thin space (1/6-em)]](https://www.rsc.org/images/entities/char_2009.gif) :
:![[thin space (1/6-em)]](https://www.rsc.org/images/entities/char_2009.gif) 1, and 1.25
1, and 1.25![[thin space (1/6-em)]](https://www.rsc.org/images/entities/char_2009.gif) :
:![[thin space (1/6-em)]](https://www.rsc.org/images/entities/char_2009.gif) 1 were selected in the current work, and the prepared nZVI/CSW composite was marked as nZVI/CSW-1, nZVI/CSW-2, nZVI/CSW-3, nZVI/CSW-4, and nZVI/CSW-5, respectively.
1 were selected in the current work, and the prepared nZVI/CSW composite was marked as nZVI/CSW-1, nZVI/CSW-2, nZVI/CSW-3, nZVI/CSW-4, and nZVI/CSW-5, respectively.| | |
Fe2+ + 2BH4− + 6H2O = Fe + 2B(OH)3 + 7H2.
| (4) |
2.3. Removal of MO
PS and nZVI or synthesized nZVI/CSW were used to degrade MO at 20 ± 1 °C. The desired amount of synthesized composites and 3 mM PS was placed in a 200 mL MO solution (20 mg L−1). The nZVI/CSW dosages affected MO removal. The dosage of nZVI/CSW varied from 0.3 g L−1 to 1.3 g L−1, and PS dosage varied from 0.5 mM to 5 mM to evaluate the dosage effect on the MO removal. At least three parallel sample analyses were conducted to present mean values and standard deviations.
2.4. Experimental design
The combined effects of the three independent variables were evaluated by the Box–Behnken experimental design41 and RSM.42 A total of 17 groups were tested and implemented in this study. The system could be explained by the following quadratic equation:| |
 | (5) |
where Y is the process response, i and j are the index numbers for pattern, m is the number of the patterns, β0 is the free term, βi is the first-order (linear), and x1, x2, …, xk are the coded independent variables.43,44
2.5. Analytical methods
The type 722 spectrophotometer was used to determine discoloration of MO at optical absorption peak of 464 nm. X-ray diffraction (XRD) patterns were recorded on a Philips X'pert multi-purpose diffractometer equipped with a fixed Cu anode. XRD patterns were collected in the 2θ range of 5–80°. Scanning electron microscopy (SEM) was conducted using the Hitachi S-4800 instrument. Energy-dispersive X-ray spectroscopy (EDS) was performed using the OXFORD EDS. Nitrogen adsorption–desorption isotherms were determined by a surface area and porosity analyzer (Micromeritics, ASAP 2020), and the surface area was calculated using Brunauer–Emmett–Teller (BET) test. The element of Fe was determined through ICP-OES measurements (Agilent 720-ES instrument), and the samples were digested in HCL.
3. Results and discussion
3.1. Characterizations of nZVI/CSW
The crystal structure of different samples was characterized by X-ray diffraction, and the results are shown in Fig. 1. The diffraction peaks at 2θ = 14.7° (100), 25.7° (010), 29.7° (200), and 31.9° (102) can be assigned to the crystalline plane of CSW according to PDF# 41-0224. All the samples with different Fe2+/CSW ratios have the same diffraction peak at 44.7° (110) according to PDF# 87-0721 (Fig. 1b). This finding corresponded to the crystalline structures of nZVI, suggesting the successful combination of nZVI with CSW. The peak intensity at 44.7° is largely amplified when the Fe2+/CSW ratio increases from 0.1 to 1.25. By contrast, the peak intensity of CSW at different degrees weakened due to the coverage of the crystalline plane of CSW by excess nZVI.
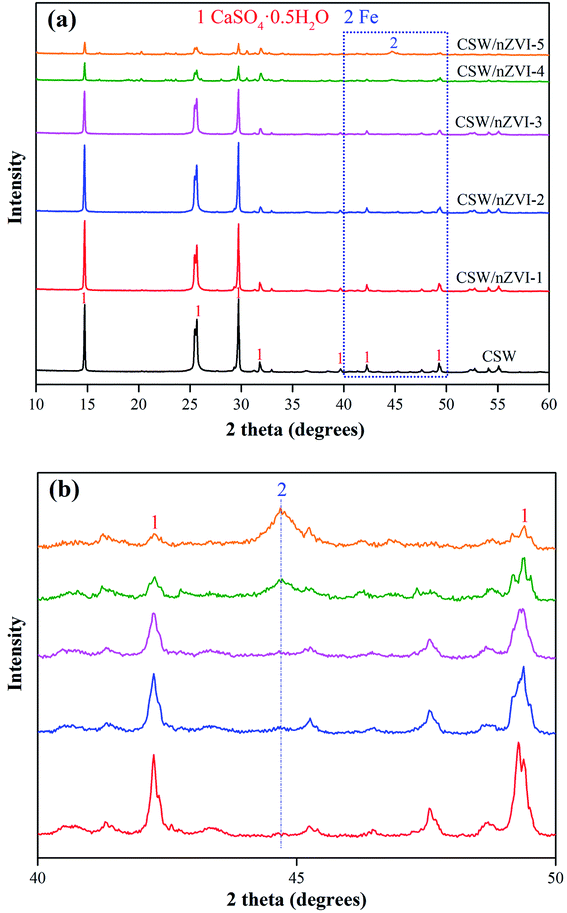 |
| | Fig. 1 (a) XRD patterns of CSW and nZVI/CSW composites and (b) details of nZVI/CSW composites in the 2θ range of 40°∼50°. | |
The morphologies and structures of nZVI/CSW were investigated by SEM (Fig. 2). The morphology of CSW was smooth and needle-like (Fig. S1†). The regular crystal plane structure of nZVI/CSW-2 particles is shown in Fig. 2a, indicating the dispersion of some fine particles along the CSW. However, the morphology of nZVI/CSW-5 is different from that of nZVI/CSW-2 because of the accumulation of nanoparticles on its surface (Fig. 2c). The elemental mapping was used to illustrate elemental distributions of Fe to determine the composition of these nanoparticles (Fig. 2b and d). The Fe element is uniformly dispersed along the CSW in the sample nZVI/CSW-2, and the nanoparticle accumulation on the surface of the sample nZVI/CSW-5 comprises the Fe element.
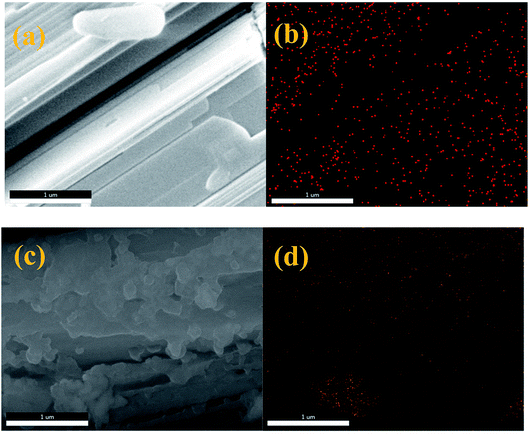 |
| | Fig. 2 SEM images and energy-dispersive X-ray spectroscopy elemental mapping images of Fe element, (a and b) nZVI/CSW-2 and (c and d) nZVI/CSW-5. | |
3.2. Comparisons of MO removal in different systems
nZVI, PS, nZVI-PS, and nZVI/CSW-PS systems were investigated respectively, and results were shown in Fig. 3. The MO removal efficiencies are 10.5% and 23% in the nZVI and the PS systems, respectively, after 30 min reaction. When PS is activated by nZVI, nZVI/CSW-1, nZVI/CSW-2, nZVI/CSW-3, nZVI/CSW-4, and nZVI/CSW-5, the removal efficiency respectively becomes 30.7%, 41.2%, 61.7%, 38.7%, 30.9%, and 31.7% within 30 min. Thus, the activation of the nZVI/CSW-1, nZVI/CSW-2 and nZVI/CSW-3 composite materials to PS were more effective than nZVI alone. The removal efficiency enhanced with the increase in nZVI/CSW mass ratio from 0.1![[thin space (1/6-em)]](https://www.rsc.org/images/entities/char_2009.gif) :
:![[thin space (1/6-em)]](https://www.rsc.org/images/entities/char_2009.gif) 1 to 0.25
1 to 0.25![[thin space (1/6-em)]](https://www.rsc.org/images/entities/char_2009.gif) :
:![[thin space (1/6-em)]](https://www.rsc.org/images/entities/char_2009.gif) 1 in 5 min probably due to the increased dispersity of nZVI particles by CSW; thus, some studies have reached similar conclusions when investigation other materials.24 However, further enhancement in the mass ratio of nZVI/CSW reduces the MO removal efficiency. Such enhancement could be attributed to an excess of nZVI particle accumulation on the surface. The agglomerate particles lower PS activation efficacy24,28,29 and block reactive nZVI sites based on XRD and SEM analyses. According to the above analysis, a mass ratio of 0.25
1 in 5 min probably due to the increased dispersity of nZVI particles by CSW; thus, some studies have reached similar conclusions when investigation other materials.24 However, further enhancement in the mass ratio of nZVI/CSW reduces the MO removal efficiency. Such enhancement could be attributed to an excess of nZVI particle accumulation on the surface. The agglomerate particles lower PS activation efficacy24,28,29 and block reactive nZVI sites based on XRD and SEM analyses. According to the above analysis, a mass ratio of 0.25![[thin space (1/6-em)]](https://www.rsc.org/images/entities/char_2009.gif) :
:![[thin space (1/6-em)]](https://www.rsc.org/images/entities/char_2009.gif) 1 was chosen for MO degradation.
1 was chosen for MO degradation.
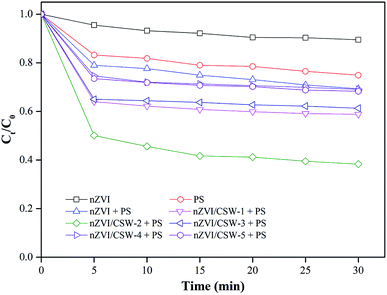 |
| | Fig. 3 Effect of different systems on MO degradation [PS] = 1 mM, [nZVI/CSW-1] = 1.25 g L−1, [nZVI/CSW-2] = 0.5 g L−1, [nZVI/CSW-3] = 0.25 g L−1, [nZVI/CSW-4] = 0.125 g L−1, [nZVI/CSW-5] = 0.1 g L−1, [nZVI] = 0.0625 g L−1, T = 20 ± 1 °C. | |
3.3. Effects of nZVI/CSW dosage, PS concentration, and temperature
By maintaining the PS concentration at 1 mM, the effect of nZVI/CSW-2 dosage (which varied in the range of 0.3–1.3 g L−1) on the removal of MO was investigated. Fig. 4 shows that the degradation of MO is significantly affected by the nZVI/CSW-2 dosage. With the increase in the initial nZVI/CSW-2 dosage, the degradation efficiency of MO is significantly enhanced from 45.1% to 81.3% when the dosage of nZVI/CSW-2 increased from 0.3 g L−1 to 1.1 g L−1 within 30 min. However, further increments in nZVI/CSW-2 dose from 1.1 g L−1 to 1.3 g L−1 minimized MO degradation from 81.3% to 73.1%. SO4˙− generated from the reaction of PS with Fe2+ was released from nZVI/CSW-2. However, the reaction may have been quenched through eqn (6) with the release of additional Fe2+,45 thereby inducing slow degradation.| | |
Fe2+ + SO4˙− → Fe3+ + SO42−.
| (6) |
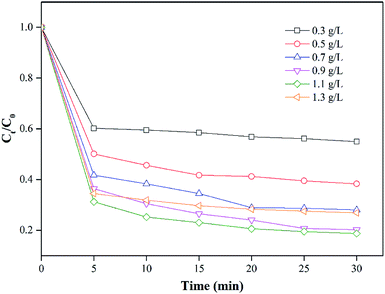 |
| | Fig. 4 Effect of nZVI/CSW-2 addition on MO degradation [MO] = 20 mg L−1, [PS] = 1 mM, [nZVI/CSW-2] = 0.3, 0.5, 0.7, 0.9, 1.1, 1.3 g L−1, T = 20 ± 1 °C. | |
The removal efficiency of MO was investigated when the dosage of nZVI/CSW-2 was fixed at 1.1 g L−1 and PS concentrations varied in the range of 0.5–5 mM. Fig. 5 shows that the degradation rates of MO are 49.2%, 81.3%, 92.8%, 94.2%, and 94.8% within 30 min at 0.5, 1, 2, 3, and 4 mM, respectively. With the increase in the initial PS concentration, the degradation of MO was significantly enhanced due to the production of additional reactive species with the increase in initial PS concentration. With the further increase in PS concentration from 4 mM to 5 mM, the degradation efficiency of MO decreased to 93.9% at 30 min. This decrease could be attributed to the scavenging of radicals induced by the excessive generation of SO4˙−. Increasing PS concentrations beyond a quantitative value would induce slow degradation rates, as indicated in eqn (7) and (8).46,47 Hence, 4 mM was considered to be the optimal PS concentration in the present study.
| | |
SO4˙− + SO4˙− → S2O82−,
| (7) |
| | |
SO4˙− + S2O82− → SO42− + S2O8˙−.
| (8) |
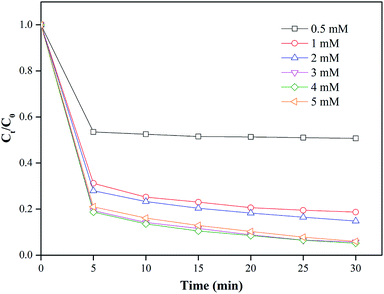 |
| | Fig. 5 Effect of PS addition on MO degradation, conditions: [MO] = 20 mg L−1, [nZVI/CSW-2] = 1.1 g L−1, [PS] = 0.5, 1, 2, 3, 4, 5 mM, T = 20 ± 1 °C. | |
The reaction temperature is crucial in the degradation reaction.48 A series of experiments were conducted with the temperature varying from 10–50 °C, and Fig. 6 showed the results. With the increase in reaction temperature, the degradation efficiency of MO was improved from 60.9% to 97.9% at 5 min. The activation energy of the chemical reaction required for MO degradation decreased at high temperatures. Moreover, high temperatures could promote the corrosion of nZVI from nZVI/CSW, thereby releasing additional Fe2+.49 Over elevated temperatures, MO was nearly completely degraded after 20 min of reaction time at 30 °C, 40 °C, and 50 °C. The applicable temperature of the PS-nZVI/CSW-2 system was ultimately determined as 30–50 °C because high temperatures would increase energy consumption.
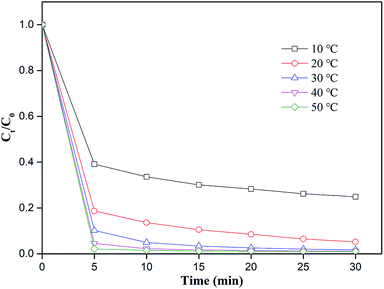 |
| | Fig. 6 Effect of temperature on MO removal efficiency, conditions: [MO] = 20 mg L−1, [PS] = 4 mM, [nZVI/CSW-2] = 1.1 g L−1, T = 10, 20, 30, 40, 50 °C respectively. | |
3.4. RSM analysis
PS dosage, nZVI/CSW, and reaction temperature were the main factors based on the preliminary tests, C5 min/C0 was taken as the response (η), and the experimental range and levels are shown in Table 1.
Table 1 Experimental range and levels of independent variables
| Variable |
Symbols |
Range and levels |
| Coded |
−1 |
0 |
1 |
| nZVI/CSW-2 dosage (g L−1) |
A |
0.5 |
0.9 |
1.3 |
| PS concentration (mM) |
B |
1 |
3 |
5 |
| T (°C) |
C |
10 |
30 |
50 |
Multiple regression analysis was applied on the responses and the design matrix, the following second-order polynomial equation (as presented in eqn (9)) in coded form was established to help find maximum degradation efficiencies and the optimal conditions.
| | |
η = 0.13 − 0.053A − 0.15B − 0.15C − 0.054AB2 − 0.037AC + 3.000E − 003BC + 0.063A2 + 0.12B2 + 0.087C2,
| (9) |
where
η is the predicted
C5 min/
C0;
A,
B and
C are the coded terms for three independent test variables, namely nZVI/CSW-2 dosage, PS dosage, and
T °C, respectively. Table S1
† illustrated the ANOVA of the regression model.
Fig. 7a shows that the predicted and actual experimental values were distributed along the linear function, indicating a significant correlation in these values. Thus, the polynomial model is reliable in describing the composite reaction behavior in the MO degradation.
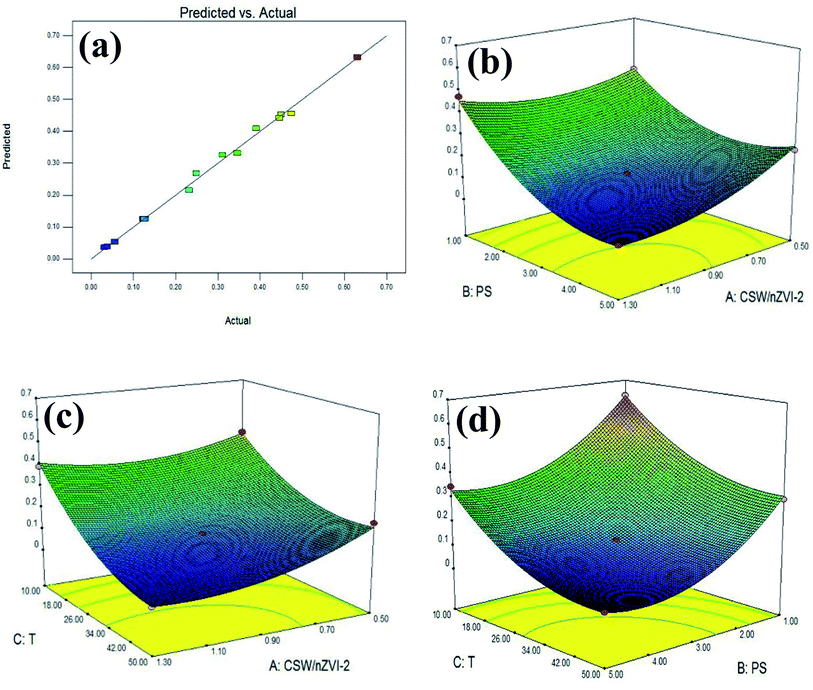 |
| | Fig. 7 Comparison of predicted and actual results (a) and response surface plots: (b) dosage of PS and nZVI/CSW-2; (c) dosage of ZVI/CSW-2 and temperature; (d) dosage of PS and temperature. | |
The 3D response surfaces were analyzed by Design Expert (Fig. 7b–d). Fig. 7b revealsthe interactive influence between PS and nZVI/CSW-2 dosage. At nZVI/CSW-2 dosage of 0.9–1.3 g L−1, a slight increase in PS dosage has a positive effect. The lowest point appears in the middle of the graph, suggesting that η was affected negatively due to low or high levels of variables. Fig. 7c shows that the η was affected by temperature and nZVI/CSW-2 dosage. At a low dosage of PS, η was reduced with the increasing temperature, and the effect was insignificant after 30 °C. At a high dosage of nZVI/CSW-2, a small effect was found with the increase of temperature. Fig. 7d depicts that an increase in PS dosage has a positive effect on MO degradation. At PS dosages of 3–5 mM, a slight increase in temperature has a positive effect, but a continuous increase has a slight effect. Moreover, high temperatures demonstrated a negative impact. Based on the optimization algorithm, the optimal values of the test variables were as follows: nZVI/CSW-2 dosage = 1.03 g L−1, PS concentration = 3.51 mM, T = 40.8 °C, with η = 0.0187.
3.5. Possible mechanism for nZVI/CSW-2 activated PS system
According to the crystal cell parameters of Fe and specific surface area of CSW, the maximum permitted value of thin-layer Fe on specific CSW surface could be estimated. The calculation results were shown in Table 2. The theoretical value of thin-layer Fe supported on CSW was 3.698 mg g−1.
Table 2 Theoretical calculation process of thin-layer Fe supported on CSW surface
| Parameters |
Value |
| Crystal cell size of Fe (nm) |
0.2866 |
| Area occupied for single crystal cell (nm2) |
0.08215 |
| Area required for thin-layer Fe (m2 g−1) |
885.9 |
| Specific surface area of CSW (m2 g−1) |
3.276 |
| Theoretical value of thin-layer Fe supported on CSW (mg g−1) |
3.698 |
To further understand the role of Fe in nZVI/CSW-2 activated PS reactions, theoretical and actual value of Fe with different samples were studied, shown in Fig. 8. The actual value of Fe was much less than theoretical value in all samples, showed that the MO could be effective degraded at lower nZVI dosage. With the Fe2+/CSW ratio increased from 0.1 to 1.25, the actual value of Fe increased from 0.257 mg g−1 to 11.67 mg g−1. In nZVI/CSW-2, the actual value of Fe was 3.88 mg g−1, which was in close proximity to the theoretical value of thin-layer Fe supported on CSW surface, indicated that the nZVI particles in nZVI/CSW-2 composite material almost as thin-layer Fe. The high Fe2+/CSW mol ratio means that nZVI particles clustered on CSW surface, plays a negative role in activating PS. This observation was consistent with the results of mapping and XRD. These results may account for the superior activation of PS by nZVI/CSW-2 compared to other samples, the thin-layer Fe supported on CSW surface could be called ‘Effective nZVI’.
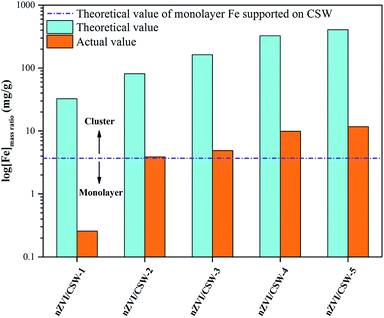 |
| | Fig. 8 Theoretical and actual value of Fe with different samples. | |
Furthermore, the correlations between peak intensity of CSW and actual value of Fe were analyzed, which could be explained by the following equation as eqn (10):
| |
 | (10) |
where
Ii is peak intensity of CSW in different composites,
I0 is peak intensity of raw CSW,
Qi is actual value of Fe in different composites,
QT is theoretical value of thin-layer Fe supported on CSW, i is nZVI/CSW-2, nZVI/CSW-3, nZVI/CSW-4, nZVI/CSW-5 respectively.
According to the intensity data and actual value of Fe, the fitting results are shown in the Fig. 9. The correlations between Ii/I0 and Qi/QT could be well fitted by eqn (10) when 2θ = 14.7°, 25.7°, 29.7° respectively. The results suggest that nZVI particles begin to cluster on CSW surface when Fe2+/CSW mol ratio exceed 0.25![[thin space (1/6-em)]](https://www.rsc.org/images/entities/char_2009.gif) :
:![[thin space (1/6-em)]](https://www.rsc.org/images/entities/char_2009.gif) 1, which affect the peak intensity of CSW observably. This is in accordance with the above analysis.
1, which affect the peak intensity of CSW observably. This is in accordance with the above analysis.
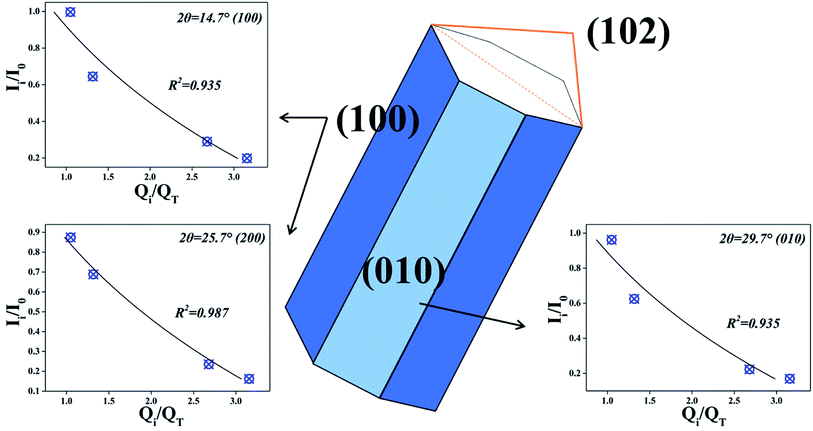 |
| | Fig. 9 The fitting results at different crystal plane. | |
In order to directly demonstrate the high efficiency of thin-layer Fe supported on CSW surface, the relationship between degradation efficiency and the amount of nZVI supported to CSW was shown in Fig. 10. The significant linear relationship could be found when Fe2+/CSW mol ratio less than 0.25, indicating a complete reaction of thin-layer nZVI. When nZVI particles began to cluster on CSW surface, the correlations could be well fitted by eqn (11), which was similar to eqn (10). This phenomenon might be due to the excess nZVI particles that blocks the ‘Effective nZVI’ and thus the inside surfaces became invalid for the activation.
| |
 | (11) |
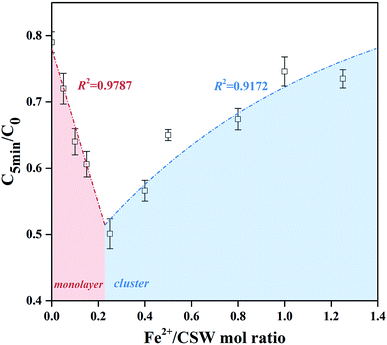 |
| | Fig. 10 The degradation efficiency as a function of Fe2+/CSW mol ratio at 5 min. | |
The crystal structure of nZVI/CSW-2 and nZVI/CSW-5 after reaction were shown in Fig. 10. Compared with nZVI/CSW-2, the diffraction peak of nZVI located at 44.7° could be found in nZVI/CSW-5, means that nZVI was not completely dissolved during the activated process. The peaks of magnetite (Fe3O4), maghemite (γ-Fe2O3) and lepidocrocite (γ-FeOOH) start to emerge in nZVI/CSW-5. Fe3O4/γ-Fe2O3 may be produced from the oxidation of nZVI,50,51 while, γ-FeOOH is main crystal in nZVI/CSW-2, which is the eventual product in oxic water.52 These results suggested that nZVI particles has completely reacted in nZVI/CSW-2/PS system (Fig. 11).
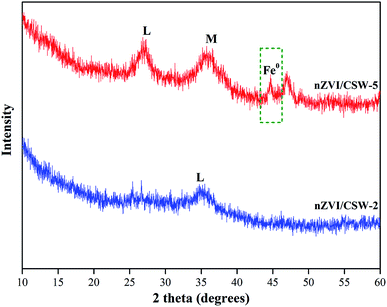 |
| | Fig. 11 XRD patterns of nZVI/CSW-2 and nZVI/CSW-5 after degradation. (M) magnetite/maghemite (Fe3O4/γ-Fe2O3), (L) lepidocrocite (γ-FeOOH). | |
From the results of XRD, it can be found that the diffraction peak of CSW disappears after degradation, indicating the dissolution of CSW. Moreover, the saturation index (SI) of CSW can be calculated by eqn (12).
| |
 | (12) |
Which IAP is the ion activity product,
Ksp is the solubility product constant, 2.290.
53
The value of SI, −0.567 indicates that the solution is not saturated and the CSW tends to dissolve, which also confirms the XRD results. The dissolution of CSW during the reaction greatly promotes the dispersion of nZVI, which greatly accelerates the activation reaction. Meanwhile, the dissolution of CSW during sample preparation was investigated. The CSW dissolution rate of 11.856% suggests still a large number of CSW powders available for supporting nZVI. Hence, the system can ensure both the successful preparation of composite material and the characteristics of dissolution–dispersion.
4. Conclusions
In this work, the nZVI/CSW composites were synthesized by liquid-phase reduction method. The results of MO degradation demonstrated that nZVI/CSW-2, with a Fe2+/CSW mol ratio of 0.25![[thin space (1/6-em)]](https://www.rsc.org/images/entities/char_2009.gif) :
:![[thin space (1/6-em)]](https://www.rsc.org/images/entities/char_2009.gif) 1, have an excellent efficiency for PS activation. The degradation efficiency of 20 mg L−1 MO by nZVI/CSW-2 could increase to 98.13% at 5 min after RSM optimization. The amount of Fe in nZVI/CSW-2 is 3.88 mg g−1, which was in close proximity to the theoretical value 3.698 mg g−1 of thin-layer Fe on CSW. The materials characterization and theoretical calculate results revealed that the enhanced activation mechanism could mainly be attributed to that thin-layer nZVI particles supported on CSW are more efficient in activating PS. Besides, the dissolution of CSW facilitates the rapid dispersion of nZVI into the solution.
1, have an excellent efficiency for PS activation. The degradation efficiency of 20 mg L−1 MO by nZVI/CSW-2 could increase to 98.13% at 5 min after RSM optimization. The amount of Fe in nZVI/CSW-2 is 3.88 mg g−1, which was in close proximity to the theoretical value 3.698 mg g−1 of thin-layer Fe on CSW. The materials characterization and theoretical calculate results revealed that the enhanced activation mechanism could mainly be attributed to that thin-layer nZVI particles supported on CSW are more efficient in activating PS. Besides, the dissolution of CSW facilitates the rapid dispersion of nZVI into the solution.
Conflicts of interest
There are no conflicts to declare.
Acknowledgements
This study was supported by the Natural Science Research Project of Anhui Education Department (KJ2019A0582 & KJ2019A0552), the Special Fund of Chinese Central Government for Basic Scientific Research Operations in Commonweal Research Institutes (No. CKSF2019168/YT, CKSF2019195/CL, CKSF2019527/YT & CKSF2019407/CL), Project of Natural Science Foundation of Anhui Province (2008085QE243), and the National Key Research and Development Project (2019YFC0408501).
References
- B. Bober, K. Pudas, Z. Lechowski and J. Bialczyk, J. Environ. Sci. Health, Part A: Toxic/Hazard. Subst. Environ. Eng., 2008, 43, 186–190 CrossRef CAS.
- W. Song, A. A. De La Cruz, K. Rein and K. E. O'Shea, Environ. Sci. Technol., 2006, 40, 3941–3946 CrossRef CAS.
- Y. Long, H. Li, X. Xing and J. Ni, Chem. Eng. J., 2017, 325, 360–368 CrossRef CAS.
- A. Baddouh, E. Amaterz, B. E. Ibrahimi, M. M. Rguitti and L. Bazzi, Desalin. Water Treat., 2019, 139, 352–369 CrossRef CAS.
- A. Baddouh, B. El Ibrahimi, M. M. Rguitti, E. Mohamed, S. Hussain and L. Bazzi, Sep. Sci. Technol., 2019, 1–10 Search PubMed.
- K. H. H. Aziz, H. Miessner, A. Mahyar, S. Mueller, D. Kalass, D. Moeller and K. M. Omer, Sep. Purif. Technol., 2019, 216, 51–57 CrossRef.
- A. Mahyar, H. Miessner, S. Mueller, K. H. H. Aziz, D. Kalass, D. Moeller, K. Kretschmer, S. R. Manuel and J. Noack, Plasma Chem. Plasma Process., 2019, 39, 531–544 CrossRef CAS.
- H. Zhang, X. Liu, J. Ma, C. Lin, C. Qi, X. Li, Z. Zhou and G. Fan, J. Hazard. Mater., 2018, 344, 1220–1228 CrossRef CAS.
- Y. Xu, J. Ai and H. Zhang, J. Hazard. Mater., 2016, 309, 87–96 CrossRef CAS.
- L. S. Lian, B. Yao, S. D. Hou, J. Y. Fang, S. W. Yan and W. H. Song, Environ. Sci. Technol., 2017, 51, 2954–2962 CrossRef CAS.
- H. R. Dong, Q. He, G. M. Zeng, L. Tang, L. H. Zhang, Y. K. Xie, Y. L. Zeng and F. Zhao, Chem. Eng. J., 2017, 316, 410–418 CrossRef CAS.
- J. L. Wang and S. Z. Wang, Chem. Eng. J., 2018, 334, 1502–1517 CrossRef CAS.
- Y. J. Shih, Y. C. Li and Y. H. Huang, J. Taiwan Inst. Chem. Eng., 2013, 44, 287–290 CrossRef CAS.
- S. A. Kordkandi and M. Forouzesh, J. Taiwan Inst. Chem. Eng., 2014, 45, 2597–2604 CrossRef CAS.
- Y. B. Ding, L. H. Zhu, N. Wang and H. Q. Tang, Appl. Catal. B Environ., 2013, 129, 153–162 CrossRef CAS.
- S. Rodriguez, L. Vasquez, D. Costa, A. Romero and A. Santos, Chemosphere, 2014, 101, 86–92 CrossRef CAS.
- C. D. Qi, X. T. Liu, C. Y. Lin, X. H. Zhang, J. Ma, H. B. Tan and W. Ye, Chem. Eng. J., 2014, 249, 6–14 CrossRef CAS.
- H. Lee, H. J. Lee, J. Jeong, J. Lee, N. B. Park and C. Lee, Chem. Eng. J., 2015, 266, 28–33 CrossRef CAS.
- X. Cheng, H. G. Guo, Y. L. Zhang, X. Wu and Y. Liu, Water Res., 2017, 113, 80–88 CrossRef CAS.
- J. B. Liu, Y. S. Wei, K. Li, J. Tong, Y. W. Wang and R. L. Jia, Water Res., 2016, 90, 225–234 CrossRef CAS.
- G. Y. Zhen, X. Q. Lu, H. Kato, Y. C. Zhao and Y. Y. Li, Renewable Sustainable Energy Rev., 2017, 69, 559–577 CrossRef CAS.
- Y. F. Li, X. Z. Yuan, Z. B. Wu, H. Wang, Z. H. Xiao, Y. Wu, X. H. Chen and G. M. Zeng, Chem. Eng. J., 2016, 303, 636–645 CrossRef CAS.
- Z. Zhou, J. Ma, X. T. Liu, C. Y. Lin, K. Sun, H. J. Zhang, X. W. Li and G. X. Fan, Chemosphere, 2019, 223, 196–203 CrossRef CAS.
- C. X. Ding, S. J. Xiao, Y. J. Lin, P. Yu, M. E. Zhong, L. H. Yang, H. Wang, L. Su, C. J. Liao, Y. Y. Zhou, Y. C. Deng and D. X. Gong, Chem. Eng. J., 2019, 360, 104–114 CrossRef CAS.
- A. Kambhu, M. Gren, W. Tang, S. Comfort and C. E. Harris, Chemosphere, 2017, 175, 170–177 CrossRef CAS.
- X. M. Xiong, B. Sun, J. Zhang, N. Y. Gao, J. M. Shen, J. L. Li and X. H. Guan, Water Res., 2014, 62, 53–62 CrossRef CAS.
- J. Li, Q. Liu, Q. Q. Ji and B. Lai, Appl. Catal. B Environ., 2017, 200, 633–646 CrossRef CAS.
- G. Y. Zhen, X. Q. Lu, L. H. Su, T. Kobayashi, G. Kumar, T. Zhou, K. Q. Xu, Y. Y. Li, X. F. Zhu and Y. C. Zhao, Water Res., 2018, 134, 101–114 CrossRef CAS.
- J. X. Wu, B. Wang, L. Blaney, G. L. Peng, P. Chen, Y. Z. Cui, S. B. Deng, Y. J. Wang, J. Huang and G. Yu, Chem. Eng. J., 2019, 361, 99–108 CrossRef CAS.
- H. R. Dong, J. M. Deng, Y. K. Xie, C. Zhang, Z. Jiang, Y. J. Cheng, K. J. Hou and G. M. Zeng, J. Hazard. Mater., 2017, 332, 79–86 CrossRef CAS.
- J. C. Yan, L. Han, W. G. Gao, S. Xue and M. F. Chen, Bioresour. Technol., 2015, 175, 269–274 CrossRef CAS.
- G. Z. Qu, L. Q. Kou, T. C. Wang, D. L. Liang and S. B. Hu, J. Environ. Manage., 2017, 201, 378–387 CrossRef CAS.
- M. B. Gu, U. Farooq, S. G. Lu, X. Zhang, Z. F. Qiu and Q. Sui, J. Hazard. Mater., 2018, 349, 35–44 CrossRef CAS.
- Z. T. Li, L. Wang, J. Meng, X. M. Liu, J. M. Xu, F. Wang and P. Brookes, J. Hazard. Mater., 2018, 344, 1–11 CrossRef CAS.
- J. Busch, T. Meissner, A. Potthoff and S. E. Oswald, J. Contam. Hydrol., 2014, 164, 25–34 CrossRef CAS.
- S. C. Hou and L. Xiang, J. Nanomater., 2013, 2013, 237828–237828 Search PubMed.
- W. J. Yuan, J. Y. Cui, Y. B. Cai and S. A. Xu, J. Polym. Res., 2015, 22(9), 173 CrossRef.
- T. T. Fan, X. S. Wang, Y. Gao and X. Y. Zhang, Constr. Build. Mater., 2019, 224, 515–533 CrossRef CAS.
- S. Yang, P. Wang, X. Yang, L. Shan, W. Zhang, X. Shao and R. Niu, J. Hazard. Mater., 2010, 179, 552–558 CrossRef CAS.
- B. Bethi, S. H. Sonawane, B. A. Bhanvase and S. P. Gumfekar, Chem. Eng. Process., 2016, 109, 178–189 CrossRef CAS.
- G. E. P. Box and D. W. Behnken, Ann. Math. Stat., 1960, 31, 838–864 CrossRef.
- M. A. Bezerra, R. E. Santelli, E. P. Oliveira, L. S. Villar and L. A. Escaleira, Talanta, 2008, 76, 965–977 CrossRef CAS.
- K. Adinarayana and P. Ellaiah, J. Pharm. Pharm. Sci., 2002, 5, 281–287 Search PubMed.
- K. Yetilmezsoy, S. Demirel and R. J. Vanderbei, J. Hazard. Mater., 2009, 171, 551–562 CrossRef CAS.
- L. Zhao, Y. F. Ji, D. Y. Kong, J. H. Lu, Q. S. Zhou and X. M. Yin, Chem. Eng. J., 2016, 303, 458–466 CrossRef CAS.
- T. Tisler, A. Jemec, B. Mozetic and P. Trebse, Chemosphere, 2009, 76, 907–914 CrossRef CAS.
- M. Bourgin, F. Violleau, L. Debrauwer and J. Albet, J. Hazard. Mater., 2011, 190, 60–68 CrossRef CAS.
- C. D. Qi, X. T. Liu, W. Zhao, C. Y. Lin, J. Ma, W. X. Shi, Q. Sun and H. Xiao, Environ. Sci. Pollut. Res., 2015, 22, 4670–4679 CrossRef CAS.
- G. Barzegar, S. Jorfi, V. Zarezade, M. Khatebasreh, F. Mehdipour and F. Ghanbari, Chemosphere, 2018, 201, 370–379 CrossRef CAS.
- A. Liu, J. Liu, J. Han and W. X. Zhang, J. Hazard. Mater., 2017, 322, 129–135 CrossRef CAS.
- X. Zhang, S. Lin, Z. L. Chen, M. Megharaj and R. Naidu, Water Res., 2011, 45, 3481–3488 CrossRef CAS.
- A. R. Liu, J. Liu, B. C. Pan and W. X. Zhang, RSC Adv., 2014, 4, 57377–57382 RSC.
- G. Tomi, L. Andrej and P. Ciril, J. Chem. Technol. Biotechnol., 2005, 80(8), 939–947 CrossRef.
Footnote |
| † Electronic supplementary information (ESI) available. See DOI: 10.1039/d0ra09241j |
|
| This journal is © The Royal Society of Chemistry 2021 |
Click here to see how this site uses Cookies. View our privacy policy here.  Open Access Article
 ab,
Xian Zhou*c,
Li Leia,
Huiqun Suna,
Zhiyuan Niua,
Ziwei Zhoua,
Zhibing Xua and
Haobo Houd
![[thin space (1/6-em)]](https://www.rsc.org/images/entities/char_2009.gif) :
:![[thin space (1/6-em)]](https://www.rsc.org/images/entities/char_2009.gif) 1, which is approximate to the theoretical value of 3.698 mg g−1 thin-layer-Fe supported on CSW. Furthermore, the results demonstrated that the thin-layer nZVI particles were the most efficient in activating PS, and nZVI was rapidly dispersed during the dissolution process of CSW, which greatly increased the reaction rate. γ-FeOOH is the main reaction product of nZVI/CSW-2. This study provides a novel advanced oxidation system with nZVI/CSW in wastewater pollution control.
1, which is approximate to the theoretical value of 3.698 mg g−1 thin-layer-Fe supported on CSW. Furthermore, the results demonstrated that the thin-layer nZVI particles were the most efficient in activating PS, and nZVI was rapidly dispersed during the dissolution process of CSW, which greatly increased the reaction rate. γ-FeOOH is the main reaction product of nZVI/CSW-2. This study provides a novel advanced oxidation system with nZVI/CSW in wastewater pollution control.![[thin space (1/6-em)]](https://www.rsc.org/images/entities/char_2009.gif) :
:![[thin space (1/6-em)]](https://www.rsc.org/images/entities/char_2009.gif) 1. Then, the mixture was stirred mechanically at 100 rpm for 30 min after the addition of different amounts of FeSO4·7H2O and allowed to stand for 30 min. Afterward, excess NaBH4 solution (Fe2+/BH4− mol ratio at 1
1. Then, the mixture was stirred mechanically at 100 rpm for 30 min after the addition of different amounts of FeSO4·7H2O and allowed to stand for 30 min. Afterward, excess NaBH4 solution (Fe2+/BH4− mol ratio at 1![[thin space (1/6-em)]](https://www.rsc.org/images/entities/char_2009.gif) :
:![[thin space (1/6-em)]](https://www.rsc.org/images/entities/char_2009.gif) 4) was added into solution, and the reaction was continued for another 30 minutes. Finally, the solution was filtered and quickly rinsed with ethanol and deionized water three times, and then vacuum dried overnight. The experiment was placed under an N2 atmosphere. Different molar ratios of Fe2+/CSW at 0.1
4) was added into solution, and the reaction was continued for another 30 minutes. Finally, the solution was filtered and quickly rinsed with ethanol and deionized water three times, and then vacuum dried overnight. The experiment was placed under an N2 atmosphere. Different molar ratios of Fe2+/CSW at 0.1![[thin space (1/6-em)]](https://www.rsc.org/images/entities/char_2009.gif) :
:![[thin space (1/6-em)]](https://www.rsc.org/images/entities/char_2009.gif) 1, 0.25
1, 0.25![[thin space (1/6-em)]](https://www.rsc.org/images/entities/char_2009.gif) :
:![[thin space (1/6-em)]](https://www.rsc.org/images/entities/char_2009.gif) 1, 0.5
1, 0.5![[thin space (1/6-em)]](https://www.rsc.org/images/entities/char_2009.gif) :
:![[thin space (1/6-em)]](https://www.rsc.org/images/entities/char_2009.gif) 1, 1
1, 1![[thin space (1/6-em)]](https://www.rsc.org/images/entities/char_2009.gif) :
:![[thin space (1/6-em)]](https://www.rsc.org/images/entities/char_2009.gif) 1, and 1.25
1, and 1.25![[thin space (1/6-em)]](https://www.rsc.org/images/entities/char_2009.gif) :
:![[thin space (1/6-em)]](https://www.rsc.org/images/entities/char_2009.gif) 1 were selected in the current work, and the prepared nZVI/CSW composite was marked as nZVI/CSW-1, nZVI/CSW-2, nZVI/CSW-3, nZVI/CSW-4, and nZVI/CSW-5, respectively.
1 were selected in the current work, and the prepared nZVI/CSW composite was marked as nZVI/CSW-1, nZVI/CSW-2, nZVI/CSW-3, nZVI/CSW-4, and nZVI/CSW-5, respectively.


![[thin space (1/6-em)]](https://www.rsc.org/images/entities/char_2009.gif) :
:![[thin space (1/6-em)]](https://www.rsc.org/images/entities/char_2009.gif) 1 to 0.25
1 to 0.25![[thin space (1/6-em)]](https://www.rsc.org/images/entities/char_2009.gif) :
:![[thin space (1/6-em)]](https://www.rsc.org/images/entities/char_2009.gif) 1 in 5 min probably due to the increased dispersity of nZVI particles by CSW; thus, some studies have reached similar conclusions when investigation other materials.24 However, further enhancement in the mass ratio of nZVI/CSW reduces the MO removal efficiency. Such enhancement could be attributed to an excess of nZVI particle accumulation on the surface. The agglomerate particles lower PS activation efficacy24,28,29 and block reactive nZVI sites based on XRD and SEM analyses. According to the above analysis, a mass ratio of 0.25
1 in 5 min probably due to the increased dispersity of nZVI particles by CSW; thus, some studies have reached similar conclusions when investigation other materials.24 However, further enhancement in the mass ratio of nZVI/CSW reduces the MO removal efficiency. Such enhancement could be attributed to an excess of nZVI particle accumulation on the surface. The agglomerate particles lower PS activation efficacy24,28,29 and block reactive nZVI sites based on XRD and SEM analyses. According to the above analysis, a mass ratio of 0.25![[thin space (1/6-em)]](https://www.rsc.org/images/entities/char_2009.gif) :
:![[thin space (1/6-em)]](https://www.rsc.org/images/entities/char_2009.gif) 1 was chosen for MO degradation.
1 was chosen for MO degradation.


![[thin space (1/6-em)]](https://www.rsc.org/images/entities/char_2009.gif) :
:![[thin space (1/6-em)]](https://www.rsc.org/images/entities/char_2009.gif) 1, which affect the peak intensity of CSW observably. This is in accordance with the above analysis.
1, which affect the peak intensity of CSW observably. This is in accordance with the above analysis.


![[thin space (1/6-em)]](https://www.rsc.org/images/entities/char_2009.gif) :
:![[thin space (1/6-em)]](https://www.rsc.org/images/entities/char_2009.gif) 1, have an excellent efficiency for PS activation. The degradation efficiency of 20 mg L−1 MO by nZVI/CSW-2 could increase to 98.13% at 5 min after RSM optimization. The amount of Fe in nZVI/CSW-2 is 3.88 mg g−1, which was in close proximity to the theoretical value 3.698 mg g−1 of thin-layer Fe on CSW. The materials characterization and theoretical calculate results revealed that the enhanced activation mechanism could mainly be attributed to that thin-layer nZVI particles supported on CSW are more efficient in activating PS. Besides, the dissolution of CSW facilitates the rapid dispersion of nZVI into the solution.
1, have an excellent efficiency for PS activation. The degradation efficiency of 20 mg L−1 MO by nZVI/CSW-2 could increase to 98.13% at 5 min after RSM optimization. The amount of Fe in nZVI/CSW-2 is 3.88 mg g−1, which was in close proximity to the theoretical value 3.698 mg g−1 of thin-layer Fe on CSW. The materials characterization and theoretical calculate results revealed that the enhanced activation mechanism could mainly be attributed to that thin-layer nZVI particles supported on CSW are more efficient in activating PS. Besides, the dissolution of CSW facilitates the rapid dispersion of nZVI into the solution.


