 Open Access Article
Hybrid material by anchoring a ruthenium(II) imine complex to SiO2: preparation, characterization and DFT studies†‡
G. Eliad Benitez-Medina§
 *a,
Raúl Flores§
 b,
Luis Vargasa,
Fernando Cuenúc,
Pankaj Sharma
 d,
Miguel Castro
 *b and
Alfonso Ramírez
 *a
*a
aGrupo de Investigación Catálisis, Universidad del Cauca, Calle 5 No. 4-70, Popayán, Colombia. E-mail: gerelid@hotmail.com; aramirez@unicauca.edu.co
bDepartamento de Física y Química Teórica, DEPg, Facultad de Química, Universidad Nacional Autónoma de México, C.P. 04510, Ciudad de México, México. E-mail: miguel.castro.m@gmail.com
cGrupo Química de Compuestos Organometálicos y Catálisis, Universidad del Quindío, Armenia, Colombia
dInstituto de Química, Universidad Nacional Autónoma de México, Ciudad Universitaria, Circuito Exterior, Coyoacán 04510, Ciudad de México, México
First published on 3rd February 2021
Abstract
Ruthenium–silica hybrid material (RuCl2(PR3)2-2-PyCH-AMPTSi/SiO2) was prepared and characterized by various spectroscopic techniques. A deconvolution procedure was applied to the spectroscopic data to deconstruct the overlapped bands. A density functional theoretical approach was applied to get insights into the electronic structure of the ruthenium coordination site and the functional RI-PBE-D3/Def2TZVP basis set was used for the optimization. Relativistic effects were considered using the zero-order regular approximation (ZORA). The anchoring process, evinced for each step of the synthesis of the hybrid material, was tracked by FT-IR analyses. The transitions observed in the FT-IR spectra were verified by DFT analyses, which agree with the experimental data. In the DRS-UV-Vis spectra, three main bands were detected by the deconvolution procedure that correspond to the charge transfer transitions, with the main contributions from ruthenium-chlorine and imine–pyridine fragments. TD-DFT results reveal that ruthenium-chlorine antibonding orbitals act as main charge donors, while pyridine–imine is the main charge acceptor.
Introduction
Hybrid materials, formed from heterogeneous solids mixed with homogeneous fractions, are generating considerable interest in the pharmacology and catalysis fields. The main advantage of hybrid materials is that they can combine the properties of a solid and a homogeneous fraction in a novel material. Furthermore, new properties may be generated; for instance, the interaction of two components affects the electronic properties of the hybrid material if electron transfer is enabled by the interaction.1Synthesis of these hybrid materials can be achieved via covalent or non-covalent immobilization of either organic or inorganic compounds on the solid support by encapsulation techniques, absorption, and covalent anchoring.2–5 In particular, in the covalent immobilization of a coordination/organometallic complex, the reactivity of the material may be influenced by the functional groups that anchor the compound to the solid as reported by Silva et al.5. Moreover, the anchored compound provides solubility to the hybrid material, suspending the solid in the solvent, whereas, the solid support contributes to the heterogeneous properties.
Technological uses of hybrid materials are broad. For instance, materials synthesized by non-covalent anchoring of hydrophobic molecules contained in hydrophilic cages are applied in catalysis, drug delivery as reported by Gibb–Bohne et al.3. Likewise, covalent anchoring is applied to synthetase catalytic materials. Later, Freire–Pires group4 reported a modified Jacobson type catalytic material, with application in alkene asymmetric epoxidation. The modified catalyst was anchored on hexagonal meso-porous amine functionalized solid.
Hybrid materials syntheses by covalent anchoring are reported by two methodologies.2–5 The first one involves the anchoring of previously synthesized metal complex containing ligands with functional groups that react with the functionalized support active sites. The second methodology consists of constructing in situ the metallic complex, by functionalizing the solid support by a ligand, followed by the formation of the metallic complex.
A key aspect in hybrid materials is the difficulty in the correct determination of appropriate anchoring of the guest with the solid support through a covalent bond by spectroscopic techniques guest–solid signal overlap. An issue with those experimental techniques is the guest-solid signal overlap. To overcome this limitation, deconvolutions6 are applied to the FT-IR and UV-Vis spectrums.
To get an insight into the nature and properties of the new hybrid material, knowledge of electronic and structural properties of the guest complexes is also desirable. Density Functional Theory (DFT), including exchange and correlation energies, is a suitable approach to study the electronic structure of medium size systems.7–12 The dispersion interactions become crucial in molecules with stacking and CH⋯π interactions, which in general were not accounted by DFT. A widely used approach to alleviate this DFT flaw was proposed by Grimme (DFT-D),9 which consists of adding a dispersion term to the KS-DFT total energy. DFT-D approach has an advantage because the computation time to calculate the dispersion correction term is negligible and thus geometry converges smoothly. The DFT-D can be applied for the structural optimization and to calculate the theoretical IR-spectra. Likewise, including dispersion corrections, UV-Vis will be computed using TD-DFT approach. Non-negligible ruthenium relativistic effects were considered by calculations with the ZORA Hamiltonian. The resolution of identity (RI) approximation was used in all the calculations.
In the present work, we are presenting the preparation and characterization of covalently anchored ruthenium complexes with triphenylphosphine to silica (SiO2) solid surface (RuCl2(PR3)2-(L)/SiO2). The anchoring process was tracked by applying deconvolutions to the FT-IR and UV-Vis spectra. DFT calculation was applied to compute the structures of ruthenium complexes, IR and UV-Vis spectra allowed to gain insight into the experimental observations. With this, we focussed on the purpose of showing experimental and computational techniques for the identification of characteristic bands in a Ruthenium complex, which is covalently anchored in situ on the surface that generates overlaps between its signals and those of the compound to be characterized.
Experimental
Solvents and reagents
(3-Aminopropyl)triethoxysilane, 2-pyridinecarboxaldehyde, triphenylphosphine, triphenylphosphite, ruthenium(III) chloride trihydrate, and the solvents used in the modification of silicas (Degussa and MCM-41), and the anchoring of the ruthenium complex were obtained from Sigma-Aldrich.Functionalization of SiO2 with 3-aminopropyltriethoxysilane (AMPTSi)
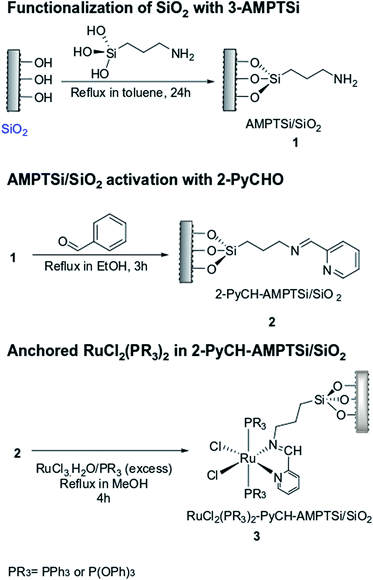
Initially, the Degussa and MCM-41 silicas were functionalized with 3-aminopropyltriethoxysilane (AMPTSi) (separately); 3 g of silica were suspended in toluene (50 mL) and AMPTSi (8.83 mmol, 2.10 mL) was added, and the mixture was heated to refluxed for 24 hours. The final material (AMPTSi/SiO2) was filtered under vacuum and washed with toluene (3 × 3 mL). Finally, the solid was dried at 85 °C overnight and the solids AMPTSi/Degussa 1a (4.85 g) and AMPTSi/MCM-41 1b (4.92 g) were obtained.Activation of AMPTSi/SiO2 with 2-pyridinecarboxaldehyde (2-PyCHO)
AMPTSi/SiO2 (1.0 g) was mixed with 2-PyCHO (0.3 mL, 3.12 mmol) in ethanol (10.0 mL), the mixture was refluxed with vigorous agitation for 3 h. The active solid was filtered under vacuum and washed with ethanol/diethyl ether (1![[thin space (1/6-em)]](https://www.rsc.org/images/entities/char_2009.gif) :
:![[thin space (1/6-em)]](https://www.rsc.org/images/entities/char_2009.gif) 1) (3 × 5 mL). The solid 2-PyCH–AMPTSi/SiO2 was dried at 50 °C for 1 h. Through this methodology the solids (2-PyCH)AMPTSi/Degussa 2a (1.17 g) and (2-PyCH)-AMPTSi/MCM-41 2b (1.18 g) were obtained.
1) (3 × 5 mL). The solid 2-PyCH–AMPTSi/SiO2 was dried at 50 °C for 1 h. Through this methodology the solids (2-PyCH)AMPTSi/Degussa 2a (1.17 g) and (2-PyCH)-AMPTSi/MCM-41 2b (1.18 g) were obtained.
Anchorage of RuCl2(PR3)2 to 2-PyCH-AMPTSi/SiO2 solid
The complex [RuCl2(PR3)3] can be obtained in situ by the addition of RuCl3·3H2O and ligand PR3 (PR3 = triphenylphosphine or triphenylphosphite) in the reaction mixture. To solution of ligand PR3 (triphenylphosphine 1.5 g, 5.7 mmol, or triphenylphosphite 1.8 g, 5.7 mmol) in methanol (15.0 mL) in a Schlenk flask under nitrogen atmosphere, the activated solid (300 mg, 2a or 2b) and RuCl3·3H2O (80.0 mg, 0.3 mmol) were added, and the mixture was refluxed for 4 h. A dark red-wine solid was obtained (Scheme 1), which was filtered under vacuum, even when the solvent was hot, subsequently, the solid was washed with hot methanol (3 × 5 mL) and diethyl ether (3 × 5 mL). Finally, the solid RuCl2(PR3)2(2-PyCH)-AMPTSi/SiO2 was dried at 40 °C for 30 minutes. A red solid of the type RuCl2(PR3)2(2-PyCH)/SiO2 red was obtained.13–17 The solids RuCl2(PPh3)2(2-PyCH)/Degussa 3a (302.7 mg), RuCl2{P(OPh)3}2(2-PyCH)/Degussa 3b (305.5 mg), RuCl2{P(OPh)3}2(2-PyCH)/MCM-41 3c (302.4 mg), and of RuCl2(PPh3)2(2-PyCH)/MCM-41 3d (301.4 mg) were obtained respectively. In polar solvents, the solids present a uniform dispersion, contrary to apolar solvents such as heptane and toluene generate viscous agglomerates.Preparation of the RuCl2(PPh3)2 (2-PyCH)-AMPTSi 3e
In a three-necked round-bottom flask 2-PyCHO (151.22 mg, 1.4 mmol) and 3-AMPTSi (346 μL, 1.45 mmol) in ethanol (10.0 mL) were added, the product (2-PyCH)-AMPTSi was concentrated and washed with dry toluene. The product was dried and characterized by FT-IR.Subsequently, in a Schlenk flask under nitrogen atmosphere was added RuCl3·3H2O (12.0 mg, 0.04 mmol) in dry methanol (15 mL). The mixture was heated to reflux for 10 min. Then, it added PPh3 (51.0 mg, 0.19 mmol) and heated to reflux for 2 h. After, on the hot mixture was added (2-PyCH)-AMPTSi (15.0 mg, 0.04 mmol) and left in reflux for another 3 h. Finally, the product was concentrated under vacuum, was washed with diethyl ether (3 × 5 mL), toluene (2 × 3 mL) and ethanol/diethyl ether (3 × 3 mL) and was dried under a nitrogen gas flux. The compound 3e (28.7 mg obtained) was characterized for FT-IR.
Instrumentation
A FT-IR Nicolet IR-200 spectrophotometer was used to record the spectra with 32 scans and a resolution of 16 cm−1 s−1. The RAMAN spectra were obtained using a Raman Perkin Elmer NIR FT-Raman SpectRUm GX spectrophotometer, a small amount of sample (a few milligrams) was deposited on a glass slide. The analyses were carried out according to the determined operating conditions. XPS analyses were performed using VG S-Probe XPS monochromatic spectrometer, with a monochromatic aluminum AlKα (1486.6 eV) anode X-ray source, using 45° take off angle (q = 45°) and the source voltage of 10 kV with 200 W power. DRS-UV-Vis spectra were recorded on a UV-Vis-NIR spectrophotometer (Varian-Cary 500). Thermogravimetric analyses (TGA) were performed using the SDT Q600 instrument. Brunauer–Emmett–Teller (BET) and Barrett–Joyner–Halenda (BJH) analyses were obtained on the TRISTAR 3000 instrument. The atomic absorption analysis was performed using an Atomic Absorption Spectrophotometer Solaar Brand 5. The deconvolution process was recorded using Fityk 0.9.8. Software (A curve fitting and data analysis program).Theoretical methods
Ruthenium complexes were studied through all-electron DFT calculations within the generalized gradient approximation (GGA) of Perdew, Burke and Ernzerhof (PBE).7 As the studied compounds are large, the resolution of identity (RI) approximation was used in all the calculations.8 Non-negligible ruthenium relativistic effects were treated efficiently with the ZORA Hamiltonian along with the ZORA-Def2-TZVP basis set and SARC/J auxiliary basis set for the RI approach.8,12The structural and electronic relaxation procedures were performed without imposing symmetry constraints. The located optimized states were confirmed to be true local minima on the Potential Energy Surface (PES) by estimating the normal vibrations within the harmonic approximation with following the computational protocol. Tight convergence was required for the total energy minimization to 10−9 a.u.; while the geometries were optimized with 10−7 a.u. and 3 × 10⁻⁴ a.u. the thresholds for the root-mean square error of forces and distances, respectively. The structures reported in this work are true minima on the PES, because of the positive frequencies.
Dispersion interactions were included in the calculations for the phenyl group's contribution. A widely used approach to include dispersion on DFT was proposed by Grimme(DFT-D),9 it consists of adding a dispersion term to the KS-DFT energy. DFT-D has the advantage that the computation time to calculate the dispersion correction term is negligible and geometry converges smoothly. DFT dispersion correction was applied to optimize the structures and calculate the theoretical IR and UV-Vis spectra.
The ORCA 4.0.1.2 version electronic structure package were used for the geometry optimization,7 IR spectra and TD-DFT calculations.
Results and discussion
Amine functionalization of the Degussa and MCM-41 silica
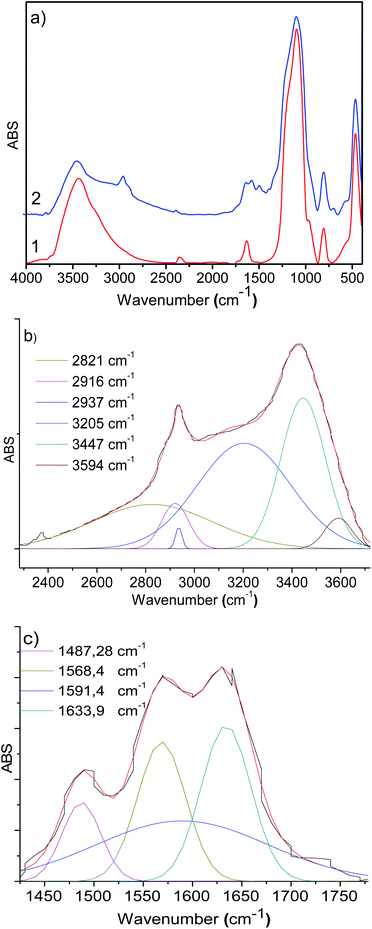
In the IR spectra of 3-aminopropyl triethoxysilane functionalized silica (Degussa and MCM-41), OH- and Si–O vibrations are observed in 3500–3200 cm−1 and 1200–1000 cm−1 regions, respectively (Fig. 1a and b). In the functionalized silica, AMPTSi/Degussa (1a), new vibrations appeared between 3000–2800 cm−1 and 1750–1300 cm−1 regions (Fig. 1a, spectrum 2) can be attributed to N–H and C–H stretching vibrations, which are verified through a deconvolution process with a symmetrical Gaussian shape centered on the respective FT-IR bands (Fig. 1b), as reported earlier in the literature.20–28 Fig. 1c displays H–N–H and H–C–H bending vibrations, visualized as vibrational components in the deconvolution plot at 1568.4 cm−1 and 1487.3 cm−1, respectively confirming the activation of Degussa silica. Similar results are reported for the functionalized and activated MCM-41 silica 1b material (see ESI‡).The computed vibrational signal of propylamine is in very good agreement with the experimental one, well reproducing both the peak frequency position and the bandwidth. The IR spectrum of propylamine was computed to model the observed bands of the FT-IR data.
Covalent attachment of 2-pyridine carboxaldehyde (2-PyCHO) onto the functionalized silica AMPTSi/SiO2
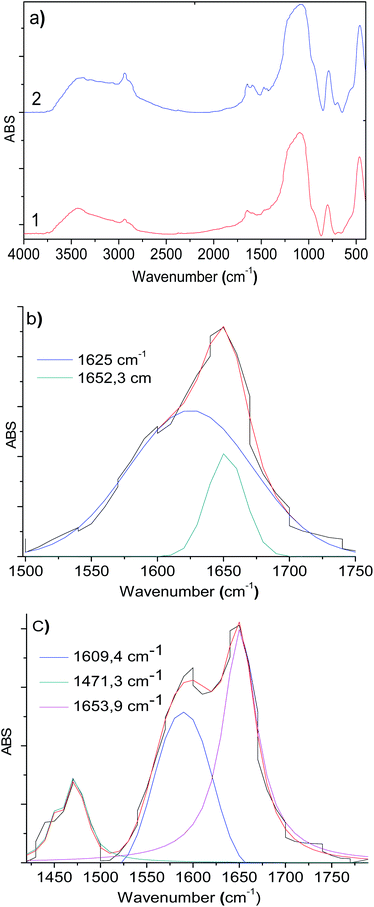
Functionalized silicas 1a and 1b were activated via covalent attachment with 2-pyridine carboxaldehyde. The infrared spectra of the 2-PyCH-AMPTSi/Degussa (2a) and 2-PyCH-AMPTSi/MCM-41 (2b) materials show changes 3300–2700 cm−1 (Fig. 2a), which correspond to the 2-PyCH- motif. An expected imine –C![[double bond, length as m-dash]](https://www.rsc.org/images/entities/char_e001.gif) N– signal (1a and 1b) in the FT-IR region (1390 and 1650 cm−1) is not visible because of the overlapping of the signals of the complex matrix formed by the silica. Nevertheless, vibrational bands at 1652.3 and 1653.9 cm−1 are present for 2a and 2b, respectively; this was possible by the deconvolution process of the specific band (Fig. 2b and c). These results verify the covalent attachment of the Schiff base ligand to the functionalized silica. Vibrational components, below 1650 cm−1, corresponding to the –NH2 group may be assigned to the non-reacting 2-PyCHO fraction.
N– signal (1a and 1b) in the FT-IR region (1390 and 1650 cm−1) is not visible because of the overlapping of the signals of the complex matrix formed by the silica. Nevertheless, vibrational bands at 1652.3 and 1653.9 cm−1 are present for 2a and 2b, respectively; this was possible by the deconvolution process of the specific band (Fig. 2b and c). These results verify the covalent attachment of the Schiff base ligand to the functionalized silica. Vibrational components, below 1650 cm−1, corresponding to the –NH2 group may be assigned to the non-reacting 2-PyCHO fraction.
The computed vibrational signal of the pyridyl imine ligand is in very good agreement with the experimental one, well reproducing both the peak frequency position and the bandwidth. The theoretical frequency obtained for the imine bond vibration agrees with the experimental result (1664.1 cm−1). Four C–H stretching vibrations were found for the pyridine group at 3064.6 cm−1, 3095.3 cm−1, 3110.0 cm−1, and 3124.0 cm−1. The lowest energy C–H stretching vibrations were asymmetric, while the last one is symmetric C–H stretching.
In situ coordinate covalent anchoring of Ru complex (RuCl2(PR3)2-2-PyCH-AMPTSi/SiO2) onto functionalized silica
The complex [RuCl2(PR3)2(2-PyCH-AMPTSi)] was formed in situ on activated silica 2-PyCH-AMPTSi/SiO2 (2). Table 1 shows the percentage of ruthenium anchored to the solids, which is low in concentration, and this correlates to the low increase in weight within the covalent anchoring process seen in the experimental section (302.7 mg of 3a, 305.5 mg 3b, 302.4 mg of 3c, and 301.4 mg of 3d from 300 mg of the respective solid precursors 2a or 2b derivated from mesoporous solids), however, these solid products were evaluated to verify if the physical properties were modified when they were transformed into a hybrid solid.| Material | AA Ru% P/P | BETc (cm3 g−1) | BJHc (cm3 g−1) | BJHc (Å) | TGAc (°C) | ||||||||||||||||||||||||||||||||||||||||||||||||||||||||||||||||||||||||||||||||||||||||||||||
|---|---|---|---|---|---|---|---|---|---|---|---|---|---|---|---|---|---|---|---|---|---|---|---|---|---|---|---|---|---|---|---|---|---|---|---|---|---|---|---|---|---|---|---|---|---|---|---|---|---|---|---|---|---|---|---|---|---|---|---|---|---|---|---|---|---|---|---|---|---|---|---|---|---|---|---|---|---|---|---|---|---|---|---|---|---|---|---|---|---|---|---|---|---|---|---|---|---|---|---|
| a The BET and BJH analysis are presented in the ESI (see ESI).b The TGA plots are shown in the ESI (see ESI).c The BET (cm3 g−1), BJH (cm3 g−1), BJH (Å), and TGA (°C) corresponds to the surface area, pore-volume, pore size, and the initial decomposition temperature respectively. | |||||||||||||||||||||||||||||||||||||||||||||||||||||||||||||||||||||||||||||||||||||||||||||||||||
| 3a | 0.35 | 63 | 0.225 | 240 | 223 | ||||||||||||||||||||||||||||||||||||||||||||||||||||||||||||||||||||||||||||||||||||||||||||||
| 3b | 0.18 | 45 | 0.155 | 288 | 177 | ||||||||||||||||||||||||||||||||||||||||||||||||||||||||||||||||||||||||||||||||||||||||||||||
| 3c | 0.16 | 34 | 0.078 | 233 | 155 | ||||||||||||||||||||||||||||||||||||||||||||||||||||||||||||||||||||||||||||||||||||||||||||||
| 3d | 0.18 | 47 | 0.139 | 140 | 198 | ||||||||||||||||||||||||||||||||||||||||||||||||||||||||||||||||||||||||||||||||||||||||||||||
Then, synthesized materials (3a–3d) are of type IV with H1 hysteresis, the surface area, pore volume, pore size, and isotherm (see ESI‡) are typical of mesoporous materials with cylindrical geometry opened at the ends of cylinders17–19 (Table 1). Furthermore, these materials show initial decomposition between 155.6–223.4 °C temperature range, and the TGA analysis show weight losses corresponding to Cl2, HCl, N2 and NO2, which indicates the thermal degradation of the covalently anchored complex and the organic compound 2-PyCH-AMPTSi anchored on the silica. Due to these decomposition temperatures, despite its low content of ruthenium, this solid could be promising for use in different catalytic processes.
On the other hand, spectroscopic studies were carried out to verify and study the complex anchored to silica, and due to the difficulty in scrutinizing various spectroscopic signals of the silica and the ruthenium complex (especially in DRS-UV-Vis and FT-IR), because of their overlapping, UV-Vis and IR spectra were studied by employing DFT calculations.
These spectral studies can define key features of the metal–ligand interactions of these hybrid synthesized materials. Other reported studies have also addressed the study of UV-Vis and IR for similar compounds.14–39
The infrared spectra display slight changes in the 1750–1300 cm−1 region (Fig. 3a) for RuCl2(PPh3)2(2-PyCH-AMPTSi)/Degussa and RuCl2(PPh3)2(2-PyCH-AMPTSi)/MCM-41, 3a and 3d materials that correspond to solids, respectively. These changes are most evident through the deconvolution process (Fig. 3b–c), as mentioned earlier by Georgieva et al.29 a shift in the FT-IR spectra of the coordinate imine. The coordinate imine bond –C![[double bond, length as m-dash]](https://www.rsc.org/images/entities/char_e001.gif) N– vibrations appeared at 1633.5 cm−1 and 1635.5 cm−1 for 3a and 3d materials (Fig. 3b and c), respectively. Whereas, the equivalent deconvolution plot for 2-PyCH-AMPTSi determined an imine vibrational component in 1650.2 cm−1 (see in ESI‡), which makes evident the shift in the FT-IR from 1650 cm−1 to 1635 cm−1, in the free and coordinated ligand. These results are similar for 3b and 3c materials (see ESI‡).
N– vibrations appeared at 1633.5 cm−1 and 1635.5 cm−1 for 3a and 3d materials (Fig. 3b and c), respectively. Whereas, the equivalent deconvolution plot for 2-PyCH-AMPTSi determined an imine vibrational component in 1650.2 cm−1 (see in ESI‡), which makes evident the shift in the FT-IR from 1650 cm−1 to 1635 cm−1, in the free and coordinated ligand. These results are similar for 3b and 3c materials (see ESI‡).
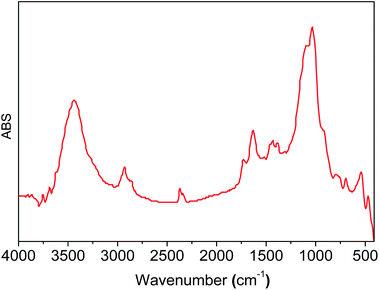
These results are comparable to those for the free compound RuCl2(PPh3)2(2-PyCH-AMPTSi) 3e. Fig. 4 displays the FT-IR spectrum (the deconvolution plot between 1850–1550 cm−1 is presented in the ESI‡), where the vibrational band at 1636.8 cm−1 corresponds to the coordinated imine vibration, as reported by M. Yáñez et al.30
To calculate appropriately the IR shifts originated by imine–ruthenium bond formation, the IR spectra of imine displayed in Fig. 3d was compared to the ruthenium coordination compound (Fig. 3e). Two imine vibrational modes were found in the 1600–1500 cm−1 region (1551.8 cm−1 and 1504.1 cm−1 for PR3 = PPh3, 1577.1 cm−1 and 1530.5 cm−1 for PR3 = P(OPh)3). The vibrations at 1560–1600 cm−1 are due to PPh3, P(OPh)3 or pyridine in-plane ring distortions. The calculated imine vibration frequency in the modeled imine is 1670.1 cm−1 (Fig. 3d). The IR red shifts in vibration frequencies 118.3–166.0 cm−1 and 93–139.6 cm−1 are observed for PPh3 and P(OPh)3 respectively while the left shoulder of 3b and 3c appears because of imine and the highest intensity vibration (≈1635 cm−1) originates from in-plane aromatic ring distortions.
In addition, Raman spectroscopy shows bands at 1520–1540 cm−1 (see ESI‡) and 371.7 cm−1 that correspond to coordinate imine bond and Ru–N vibrations respectively, a similar observation was presented by Chavez-Gil et al.31 In the solids 3a–3d, the Ru–N band overlapped with the other bands of the solid matrix, so the deconvolution process over the broadband was appropriate for this observation (Fig. 5 and Table 2).
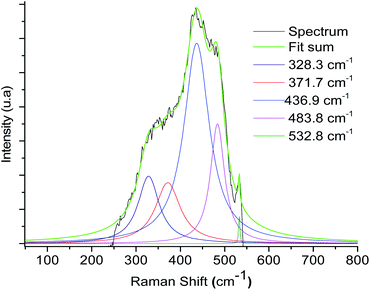 | ||
| Fig. 5 Raman spectrum deconvolution plot of the material 3a of the broadband between the 500–300 cm−1 regions. | ||
| Sample | Component ν Ru–N (cm−1) |
|---|---|
| 3a | 371.7 |
| 3b | 371.9 |
| 3c | 375.4 |
| 3d | 373.1 |
A complementary analysis of surface composition of the solids by the X-ray Photoelectron Spectroscopy (XPS) detected 0.93% of ruthenium on the surface of the solid 3a and around 0.35% for the solids 3b–3d (Table 3). The C/Ru ratio in 3a–3d solids is above 59.6 (Table 4), the excess in the C/Ru ratio agrees with the excess in the N/Ru ratio. Carbon and nitrogen excess represent the non-coordinated anchoring ligand and the inactive AMPTSi/SiO2 (free amine groups on the functionalized silica surface). The Cl/Ru and P/Ru ratios agree with the expected values, except for 3b and 3c solids where P(OPh)3 is used as a ligand. Unlike PPh3 ligand, P(OPh)3 ligand is expected to show higher retention on silica; because of its excess during the preparation of the solids and the oxygen present in its structure.
| Atomic (%) | |||||||||||||||||||||||||||||||||||||||||||||||||||||||||||||||||||||||||||||||||||||||||||||||||||
|---|---|---|---|---|---|---|---|---|---|---|---|---|---|---|---|---|---|---|---|---|---|---|---|---|---|---|---|---|---|---|---|---|---|---|---|---|---|---|---|---|---|---|---|---|---|---|---|---|---|---|---|---|---|---|---|---|---|---|---|---|---|---|---|---|---|---|---|---|---|---|---|---|---|---|---|---|---|---|---|---|---|---|---|---|---|---|---|---|---|---|---|---|---|---|---|---|---|---|---|
| C | Cl | N | O | P | Ru | Si | |||||||||||||||||||||||||||||||||||||||||||||||||||||||||||||||||||||||||||||||||||||||||||||
| a The XPS plots are in the ESI (see ESI). | |||||||||||||||||||||||||||||||||||||||||||||||||||||||||||||||||||||||||||||||||||||||||||||||||||
| 3a | 55.37 | 1.80 | 3.33 | 23.48 | 2.26 | 0.93 | 15.10 | ||||||||||||||||||||||||||||||||||||||||||||||||||||||||||||||||||||||||||||||||||||||||||||
| 3b | 36.84 | 0.72 | 4.22 | 34.98 | 2.87 | 0.31 | 20.05 | ||||||||||||||||||||||||||||||||||||||||||||||||||||||||||||||||||||||||||||||||||||||||||||
| 3c | 46.19 | 0.87 | 4.85 | 27.02 | 1.72 | 0.39 | 18.97 | ||||||||||||||||||||||||||||||||||||||||||||||||||||||||||||||||||||||||||||||||||||||||||||
| 3d | 46.15 | 1.04 | 4.65 | 27.52 | 0.89 | 0.39 | 19.35 | ||||||||||||||||||||||||||||||||||||||||||||||||||||||||||||||||||||||||||||||||||||||||||||
| Exp | Cal | Exp | Cal | Exp | Cal | Exp | Cal | ||||||||||||||||||||||||||||||||||||||||||||||||||||||||||||||||||||||||||||||||||||||||||||
|---|---|---|---|---|---|---|---|---|---|---|---|---|---|---|---|---|---|---|---|---|---|---|---|---|---|---|---|---|---|---|---|---|---|---|---|---|---|---|---|---|---|---|---|---|---|---|---|---|---|---|---|---|---|---|---|---|---|---|---|---|---|---|---|---|---|---|---|---|---|---|---|---|---|---|---|---|---|---|---|---|---|---|---|---|---|---|---|---|---|---|---|---|---|---|---|---|---|---|---|
| a The XPS plots are in the ESI (see ESI). | |||||||||||||||||||||||||||||||||||||||||||||||||||||||||||||||||||||||||||||||||||||||||||||||||||
| 3a | 1.9 | 2 | 3.6 | 2 | 2.4 | 2 | 59.6 | 45 | |||||||||||||||||||||||||||||||||||||||||||||||||||||||||||||||||||||||||||||||||||||||||||
| 3b | 2.3 | 2 | 13.6 | 2 | 9.2 | 2 | 118.2 | 45 | |||||||||||||||||||||||||||||||||||||||||||||||||||||||||||||||||||||||||||||||||||||||||||
| 3c | 2.2 | 2 | 12.6 | 2 | 4.4 | 2 | 120.1 | 45 | |||||||||||||||||||||||||||||||||||||||||||||||||||||||||||||||||||||||||||||||||||||||||||
| 3d | 2.7 | 2 | 12.0 | 2 | 2.3 | 2 | 119.0 | 45 | |||||||||||||||||||||||||||||||||||||||||||||||||||||||||||||||||||||||||||||||||||||||||||
Regarding the Binding Energies (BE) of the metallic ruthenium (Ru0), the states Ru 3d5/2 and Ru 3d3/2 are 280 and 284 eV, respectively.32 For Ru(II) complex with pyridine ligands, the BE (Ru 3d5/2) is between 279.5-282 eV; whereas for the Ru(III) complex, the binding energy is 284 eV.33,34 The BE for the Ru 3d5/2 state, reported in Table 5, is 279 eV; we also observe the state Ru 3d3/2 is between 284.3–284.7 eV (Table 5), characteristic for Ru(II) compounds. Likewise, the states Ru 3p3/2 and Ru 3p1/2 are visualized in Table 5, which are adjusted to ruthenium complex with an oxidation state +2.33
| C 1sa | O 1s | N 1s | Si 2p | P 2p | Cl 2p | Ru 3d5/2a | Ru 3d3/2 | Ru 3p3/2 | Ru 3p1/2 | ||||||||||||||||||||||||||||||||||||||||||||||||||||||||||||||||||||||||||||||||||||||||||
|---|---|---|---|---|---|---|---|---|---|---|---|---|---|---|---|---|---|---|---|---|---|---|---|---|---|---|---|---|---|---|---|---|---|---|---|---|---|---|---|---|---|---|---|---|---|---|---|---|---|---|---|---|---|---|---|---|---|---|---|---|---|---|---|---|---|---|---|---|---|---|---|---|---|---|---|---|---|---|---|---|---|---|---|---|---|---|---|---|---|---|---|---|---|---|---|---|---|---|---|
| a The C 1s and Ru 3d5/2 binding energies were differentiated because the intensity in C1's peaks is greater than for the 3d of the ruthenium because of the low concentration of metal in comparison to the organic material present in the analysis. | |||||||||||||||||||||||||||||||||||||||||||||||||||||||||||||||||||||||||||||||||||||||||||||||||||
| 3a | 280.8 | 528.2 | 424.4 | 99.3 | 127.4 | 194.2 | 279.7 | 284.5 | 458.3 | 480.5 | |||||||||||||||||||||||||||||||||||||||||||||||||||||||||||||||||||||||||||||||||||||||||
| 281.9 | |||||||||||||||||||||||||||||||||||||||||||||||||||||||||||||||||||||||||||||||||||||||||||||||||||
| 3b | 281.9 | 529.9 | 397.3 | 101.1 | 130.5 | 195.3 | 279.41 | 284.3 | 458.8 | 482 | |||||||||||||||||||||||||||||||||||||||||||||||||||||||||||||||||||||||||||||||||||||||||
| 283.1 | |||||||||||||||||||||||||||||||||||||||||||||||||||||||||||||||||||||||||||||||||||||||||||||||||||
| 3c | 282.9 | 532.2 | 399.4 | 103.0 | 130.5 | 197.9 | 279.4 | 284.7 | 461.5 | 483.5 | |||||||||||||||||||||||||||||||||||||||||||||||||||||||||||||||||||||||||||||||||||||||||
| 284.7 | |||||||||||||||||||||||||||||||||||||||||||||||||||||||||||||||||||||||||||||||||||||||||||||||||||
| 3d | 281.8 | 529.4 | 396.4 | 100.2 | 128.2 | 194.8 | 279.6 | 284.6 | 458.8 | 481 | |||||||||||||||||||||||||||||||||||||||||||||||||||||||||||||||||||||||||||||||||||||||||
| 282.1 | |||||||||||||||||||||||||||||||||||||||||||||||||||||||||||||||||||||||||||||||||||||||||||||||||||
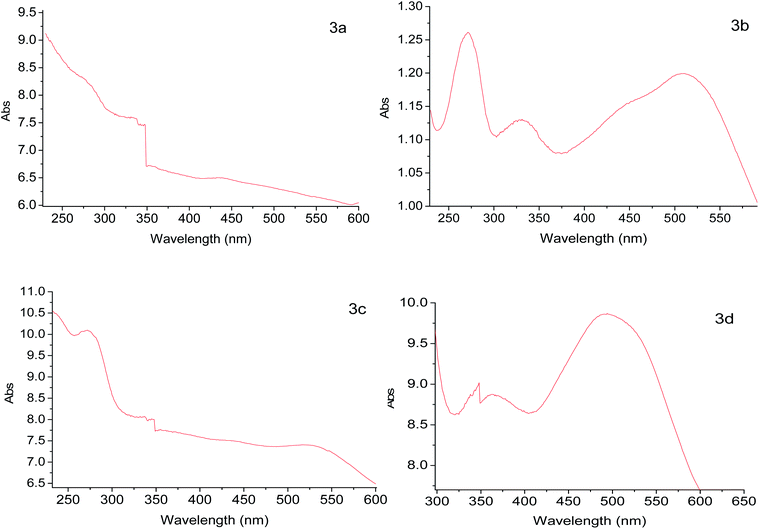
According to XPS analyses, a Ru(II) complex has been anchored, so studying the solids through diffuse reflectance UV-Vis spectroscopy (DRS-UV-Vis), a band related to metal–ligand charge transfer was identified for each solid. Table 6 presents the DRS-UV-Vis data (λnm). The band λ1 may arise from the π → π* transition of PPh3 and P(OPh)3 aromatic rings8,35,36 as reported earlier in the literature for similar complexes e.g. [RuCl2(PPh3)3] [(NH3)4Ru(Py)2]2+ and [RuCl2(PPh3)2(2,6-dmpz)2].8,37–39 The band λ2 could be assigned to the transition π → π* of the pyridine ring (2-PyCH-AMPTSi) ligand; these bands are allowed by Laporte and spin, elucidating their high intensities. The moderate intensity UV band λ3 is attributed to an inter ligand transition n → π of the non-activated AMPTSi/SiO2 excess with 2-PyCHO.
| Electronic spectra data | |||||||||||||||||||||||||||||||||||||||||||||||||||||||||||||||||||||||||||||||||||||||||||||||||||
|---|---|---|---|---|---|---|---|---|---|---|---|---|---|---|---|---|---|---|---|---|---|---|---|---|---|---|---|---|---|---|---|---|---|---|---|---|---|---|---|---|---|---|---|---|---|---|---|---|---|---|---|---|---|---|---|---|---|---|---|---|---|---|---|---|---|---|---|---|---|---|---|---|---|---|---|---|---|---|---|---|---|---|---|---|---|---|---|---|---|---|---|---|---|---|---|---|---|---|---|
| λ1 | λ2 | λ3 | λ4 | ||||||||||||||||||||||||||||||||||||||||||||||||||||||||||||||||||||||||||||||||||||||||||||||||
| a Values in parenthesis are the shoulders in the given band. | |||||||||||||||||||||||||||||||||||||||||||||||||||||||||||||||||||||||||||||||||||||||||||||||||||
| 3a | <236 | 275 | 339 | 438 (480) | |||||||||||||||||||||||||||||||||||||||||||||||||||||||||||||||||||||||||||||||||||||||||||||||
| 3b | <236 | 275 | 330 | 511 (453) | |||||||||||||||||||||||||||||||||||||||||||||||||||||||||||||||||||||||||||||||||||||||||||||||
| 3c | <250 | 275 | 333 | 525 (439) | |||||||||||||||||||||||||||||||||||||||||||||||||||||||||||||||||||||||||||||||||||||||||||||||
| 3d | 236 | 278 | 361 | 494 | |||||||||||||||||||||||||||||||||||||||||||||||||||||||||||||||||||||||||||||||||||||||||||||||
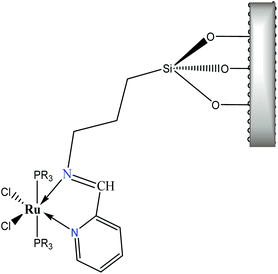
Regarding the visible region, the band λ4 with shoulder or partially overlapped was detected (Fig. 6 and Table 6). These band intensities are higher than the λ1 and λ2 bands. Thus, we assumed visible region bands, allowed by Laporte, correspond to metal–ligand charge transfer (MLCT). Bolaños et. al. reported the transitions B1(dxz) → B1(pπ*) and A2(dxy) → A2(pπ*),14,35–39 for a similar [RuCl2(PPh3)2(2,6-dmpz)2] coordination compound,8,35 which contains two 2,6-dimethyl pyrazine ligands in a cis position arranged in octahedral coordination. Indeed, the solids 3a–3d are coordinated, in a similar fashion, by a Schiff base derived from pyridine carboxaldehyde (Fig. 7).
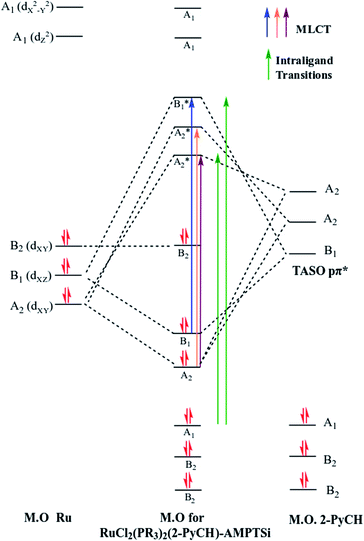
Group theory analysis allowed us to give an insight into the possible metal–ligand charge transfer of transitions. Ruthenium coordination compound was assigned with C2v symmetry and hence, considering the first neighbor atoms, involving the π symmetry orbitals of 2-PyCH-AMPTSi ligand were transformed into C2v point group. Applying these simplifications, A2 and B1 representations were assigned to the pyridine ring and A1 to the iminic nitrogen, the orbitals dxy(A2) and dxz(B1) may be involved in the transitions, because the Terminal Atom Symmetry Orbital pπ* (TASO pπ*) are with B1(π) and A2(π) symmetries. Probably the orbital dyz is not involved in the metal–ligand transition, because dyz orbital is B2.
The possible transitions for Ru–Npy bond are B1(dxz) → B1(pπ*) and A2(dxy) →A2(pπ*) The former is higher in energy and intensity because TASO B1 is located over the coordinated nitrogen and the pyridine ring carbon atoms. Whereas TASO A2 is near to the pyridine carbons only and is relatively far from the metal center; thus, less overlapping with the metal orbitals. A transition A2(dxy) → A2(pπ*) of Ru–N(Shiff base) bond is also expected. This bond should be weaker and a larger bond length is expected in comparison to the Ru–pyridine bond. Therefore, the following three transitions, B1(dxz) → B1(pπ*) > A2(dxy) → A2(pπ*) > A2(dxy) → A2(pπ*). In descending order of energy, are expected in the electronic spectrum of the studied materials (Fig. 8).
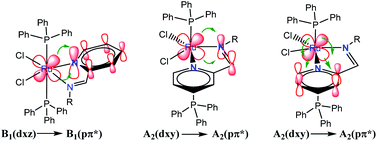 | ||
| Fig. 8 Electronic transitions of metal to ligand charge transfer (MLCT) in RuCl2(PR3)2(2-PyCH)-AMPTSi/SiO2 (Ph and O–Ph ligands were omitted for clarity). | ||
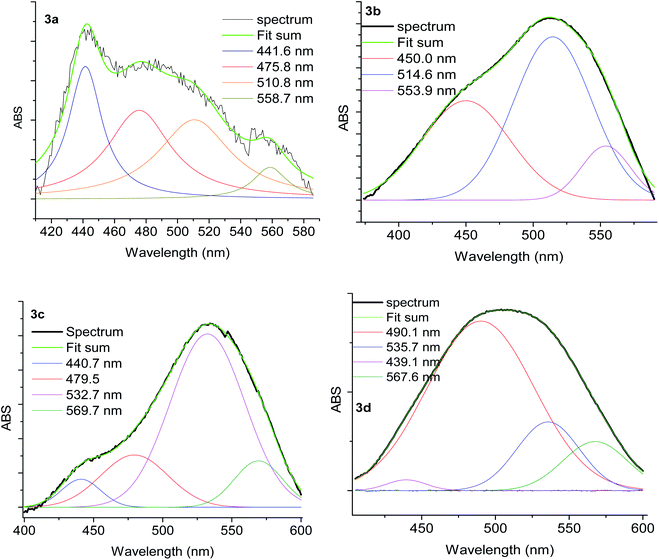
Nevertheless, the observed widespread band in the electronic spectra of 3a–3d materials suggests that these transitions are overlapped. The components related to the expected transitions were found by applying a deconvolution procedure using the symmetric Gaussian function (Fig. 9). Such components are displayed in Table 7 as λa, λb and λc, which correspond to the B1(dxz) → B1(pπ*), A2(dxy) → A2(pπ*) and A2(dxy) → A2(pπ*) metal–ligand transitions respectively. The transition A2(dxy) → A2(pπ*) is less intense, which may be due to the overlapping of metal ion orbitals on XY axis and the ligand orbital A2(pπ*) (Fig. 8)3 as suggested earlier by Day and Sanders.5,35–39 Meanwhile the interaction B1(dxz) → B1(pπ*) is of higher intensity and shorter wavelength because of main back donation, as expected.28 The pattern of the intensities (λa > λb > λd) was observed in materials with PPh3 ligands (3a and 3d), whereas a different pattern in the intensities was detected (λb > λa > λd) in the materials with P(OPh)3 ligands. This behaviour could be attributed to lesser donor ability of the P(OPh)3 ligand in comparison to PPh3 ligand, which affects the back donation B1(dxz) → B1(pπ*). An appropriate orbital combination was allowed to build the qualitative molecular orbital scheme, as illustrated in Fig. 10.35
| λ (nm) | |||
|---|---|---|---|
| λa, B1(dxz) → B1(pπ*) | λb, A2(dxy) → A2(pπ*) | λc, A2(dxy) → A2(pπ*) | |
| 3a | 442 | 476–511 | 558 |
| 3b | 450 | 515 | 554 |
| 3c | 441–479 | 533 | 570 |
| 3d | 490 | 536 | 568 |
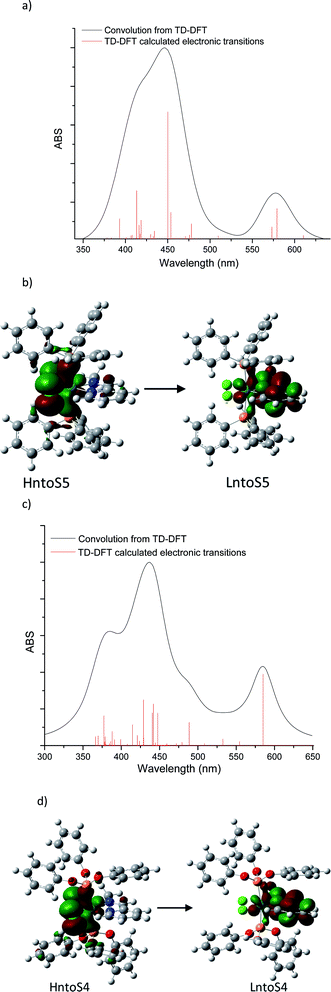
For further insight into the qualitative analysis of the UV-Vis spectra, the visible range theoretical spectra were also computed by evaluating singlet excited states using TD-DFT at the RI-PBE/Def2TZVP ZORA level of theory in the gas phase. Forty excitations in each complex were evaluated to compare the TD-DFT results with the experimental visible spectra and Natural transition orbitals (NTO) were analyzed. The theoretical visible spectra of [Ru(II)Cl2(PR3)2(2-PyCH3)] (PR3 = PPh3 and P(OPh)3) are displayed in Fig. 11. (see ESI‡).
![[double bond, length as m-dash]](https://www.rsc.org/images/entities/b_char_e001.gif) N–CH3. The transition at 579.2 nm corresponds to the deconvoluted experimental peaks at 558.7 nm (3a) and 567.6 nm (3d) (PR3 = PPh3). This excitation may be represented in terms of two NTO transitions: HntoS5 → LntoS5 and HntoS5–LntoS5 → LntoS5+1. The former is a transition from ruthenium–phosphine bonding orbital and chlorine atoms to metal–phosphine and pyridine molecules. The second transition is from metal–chlorine antibonding orbital to phosphine molecules (MLLCT) and thus, this transition can be assigned as an MLMLCT excitation. To a lesser extent, S6 state contributes to the lower energy peak, which is attributed to an MLLCT (ruthenium–chlorine to pyridine). The band located in between the highest and lowest energies bands, at 509.8 nm may be assigned to the experimental peak detected at 476–511 (3a) and 536 (3d). Such transition is an MLMLCT from ruthenium–chlorine antibonding orbital to ruthenium-phosphine antibonding orbital. The main contribution to the higher energy band is from state 15, which is composed mainly of three NTOs; these transitions are MLMLCT, where the strongest contribution is from ruthenium–chlorine antibonding orbital to ruthenium–pyridine antibonding orbital.
N–CH3. The transition at 579.2 nm corresponds to the deconvoluted experimental peaks at 558.7 nm (3a) and 567.6 nm (3d) (PR3 = PPh3). This excitation may be represented in terms of two NTO transitions: HntoS5 → LntoS5 and HntoS5–LntoS5 → LntoS5+1. The former is a transition from ruthenium–phosphine bonding orbital and chlorine atoms to metal–phosphine and pyridine molecules. The second transition is from metal–chlorine antibonding orbital to phosphine molecules (MLLCT) and thus, this transition can be assigned as an MLMLCT excitation. To a lesser extent, S6 state contributes to the lower energy peak, which is attributed to an MLLCT (ruthenium–chlorine to pyridine). The band located in between the highest and lowest energies bands, at 509.8 nm may be assigned to the experimental peak detected at 476–511 (3a) and 536 (3d). Such transition is an MLMLCT from ruthenium–chlorine antibonding orbital to ruthenium-phosphine antibonding orbital. The main contribution to the higher energy band is from state 15, which is composed mainly of three NTOs; these transitions are MLMLCT, where the strongest contribution is from ruthenium–chlorine antibonding orbital to ruthenium–pyridine antibonding orbital.![[double bond, length as m-dash]](https://www.rsc.org/images/entities/b_char_e001.gif) N–CH3. The lowest energy transition of the triphenyl-phosphite coordination compound is MLMLCT between ruthenium-chlorine antibonding orbital and the ruthenium-pyridine orbital. The next two transitions at 554.4 nm and 532.6 nm are from phosphite to ruthenium-pyridine charge transfers (LMLCT). Higher energy bands may be mainly attributed to 488.7 nm which is composed of three NTOs: a metal–chlorine to pyridine (MLLCT), metal–phosphine–chlorine to metal–pyridine (MLMLCT) and metal–chlorine to metal–phosphine (MLMLCT) charge transfers.
N–CH3. The lowest energy transition of the triphenyl-phosphite coordination compound is MLMLCT between ruthenium-chlorine antibonding orbital and the ruthenium-pyridine orbital. The next two transitions at 554.4 nm and 532.6 nm are from phosphite to ruthenium-pyridine charge transfers (LMLCT). Higher energy bands may be mainly attributed to 488.7 nm which is composed of three NTOs: a metal–chlorine to pyridine (MLLCT), metal–phosphine–chlorine to metal–pyridine (MLMLCT) and metal–chlorine to metal–phosphine (MLMLCT) charge transfers.Conclusions
The hybrid material RuCl2(PR3)2-2-PyCH-AMPTSi/SiO2 (PR3 = PPh3 or P(OPh)3) were synthesized in situ and characterized by FT-IR, Raman, XPS, and DRS-UV-Vis spectroscopies. Density functional theory, at the RI-PBE/Def2TZVP ZORA level, was used to model the electronic properties at the ruthenium coordination site.An oxidation state 2+ for the ruthenium was verified by solid characterization. Natural transition orbital analyses provided by TD-DFT calculations suggest that ruthenium 4d orbitals are involved in almost all the transitions. Electrons are mostly transferred to the ruthenium–pyridine–imine from the ruthenium–chlorine antibonding orbitals (MLMLCT). To a lesser extent, P(OPh)3 and PPh3 ligands may also contribute to the electronic transitions in the visible region. Notwithstanding the theoretical deviation from the experimentally UV-Vis spectrum determination, the visible region agrees with the intensities hierarchy observed in the experiment. That is, the intensity of the lowest energy is higher with the P(OPh)3 ligand in comparison to PPh3 ligand; while the intensity of the highest energy band is lower for the PPh3 ligand than for P(OPh)3 ligand.
The changes in the IR spectra observed in the synthesis pathway, allowed to track the anchorage process of the hybrid material. A theoretical approach by DFT confirmed the observed shifts in the FT-IR spectra.
Abbreviations
| FT-IR | Fourier-transform infrared spectroscopy |
| DRS-UV-Vis | UV-Vis diffuse reflectance spectroscopy |
| XPS | X-ray photoelectron spectroscopy |
| ZORA | Zero-order regular approximation |
| AMPTSi | Aminopropyltriethoxysilane |
| Ru–Npy | bond Ru–N pyridinic |
| TASO | Terminal atom symmetry orbital |
Conflicts of interest
There are no conflicts to declare.Acknowledgements
We thank Universidad del Cauca and the financial support to ID 4737 project from Vice-Rector for Research of Universidad del Cauca, and Universidad Nacional Autónoma de México (UNAM) and the financial support to PAPIIT IN114619 project from DGAPA-UNAM. M. C. is thankful to the Dirección General de Cómputo y de Tecnologías de la Información (DGTIC-UNAM) for providing supercomputing resources on the Miztli supercomputer (project LANCAD-UNAM-DGTIC-063). We also thank the entities that participated in the technical monitoring of this work, Catalysis Laboratory in Organic Chemistry ancient LACCO (Université de Poitiers, France), Lumilab laboratory (Universiteit Gent, Belgium), and Chemistry Group of organometallic and Catalysis Group (Universidad del Quíndio, Colombia). Also, we thank Luis M. Vargas P. for his diligent proofreading of this paper.References
- G. Kickelbick, Hybrid Materials: Synthesis, Characterization, and Applications, Wiley-VCH, 2007 Search PubMed
.
- V. Caballero, F. M. Bautista, J. M. Campelo, D. Luna, R. Luque, J. M. Marinas, A. A. Romero, I. Romero, M. Rodríguez, I. Serrano, J. M. Hidalgo and A. Llobet, Efficient Hydrogenation of Alkenes Using a Highly Active and Reusable Immobilised Ru Complex on AlPO4, J. Mol. Catal. A: Chem., 2009, 308, 41 CrossRef CAS
; T. kamegawa, M. Saito, T. Watanabe, K. Uchichara, M. Kondo, M. Matsouka and M. Anpo, Preparation of inorganic–organic hybrid mesoporous material incorporating organoruthenium complexes (-[C6H4RuCp]PF6-) and its application as a heterogeneous catalyst, J. Mater. Chem., 2011, 21, 12228 RSC
; S. Sisodiya, A. Lazar, S. Shylesh, L. Wang, W. R. Thiel and A. P. Singh, Covalently anchored ruthenium–phosphine complex on mesoporous organosilica: catalytic applications in hydrogenation reactions, Catal. Commun., 2012, 25, 22 CrossRef
.
- S. S. Thomas, H. Tang, A. Gaudes, S. B. Baggesen, C. L. D. Gibb, B. C. Gibb and C. Bohne, Tuning the Binding Dynamics of a Guest-Octaacid Capsule through Noncovalent Anchoring, J. Phys. Chem. Lett., 2017, 8, 2573 CrossRef CAS
.
- I. Kuźniarska-Biernacka, A. R. Silva, A. P. Carvalho, J. Pires and C. Freire, Direct Immobilisation versus Covalent Attachment of a Mn(III)Salen Complex onto an Al-Pillared Clay and Influence in the Catalytic Epoxidation of Styrene, J. Mol. Catal. A: Chem., 2007, 278, 82 CrossRef
.
- A. R. Silva, K. Wilson, J. H. Clark and C. Freire, Covalent Attachment of Chiral Manganese(III) Salen Complexes onto Functionalised Hexagonal Mesoporous Silica and Application to the Asymmetric Epoxidation of Alkenes, Microporous Mesoporous Mater., 2006, 91, 128 CrossRef CAS
.
- G. Marbán, T. T. Vu and T. Valdés-Solís, A Simple Visible Spectrum Deconvolution Technique to Prevent the Artefact Induced by the Hypsochromic Shift from Masking the Concentration of Methylene Blue in Photodegradation Experiments, Appl. Catal., A, 2011, 402, 218 CrossRef
.
- J. P. Perdew, K. Burke and M. Ernzerhof, Generalized Gradient Approximation Made Simple, Phys. Rev. Lett., 1996, 77, 3865 CrossRef CAS
; F. Neese, The ORCA program system, WIREs Computational Molecular Science, 2012, 2, 73 CrossRef
; F. Neese, Software update: the ORCA program system, version 4.0, WIREs Computational Molecular Science, 2017, 8, 1327 Search PubMed
.
- F. Weigend and R. Ahlrichs, Balanced Basis Sets of Split Valence, Triple Zeta Valence and Quadruple Zeta Valence Quality for H to Rn: Design and Assessment of Accuracy, Phys. Chem. Chem. Phys., 2005, 7, 3297 RSC
; J. L. Whitten, Coulombic potential energy integrals and approximations, J. Chem. Phys., 1973, 58, 4496 CrossRef CAS
; B. I. Dunlap, J. W. D. Connolly and J. R. Sabin, On some approximations in applications of Xα theory, J. Chem. Phys., 1979, 71, 3396 CrossRef
; O. Vahtras, J. Almlöf and M. W. Feyereisen, Integral approximations for LCAO-SCF calculations, Chem. Phys. Lett., 1993, 213, 514 CrossRef
.
- S. Grimme, J. Antony, S. Ehrlich and H. Krieg, A Consistent and Accurate Ab Initio Parametrization of Density Functional Dispersion Correction (DFT-D) for the 94 Elements H-Pu, J. Chem. Phys., 2010, 132, 154104 CrossRef
.
- M. Filatov, On Representation of the Hamiltonian Matrix Elements in Relativistic Regular Approximation, Chem. Phys. Lett., 2002, 365, 222 CrossRef CAS
.
- C. van Wüllen, Molecular Density Functional Calculations in the Regular Relativistic Approximation: Method, Application to Coinage Metal Diatomics, Hydrides, Fluorides and Chlorides, and Comparison with First-Order Relativistic Calculations, J. Chem. Phys., 1998, 109, 392 CrossRef
.
- D. A. Pantazis, X.-Y. Chen, C. R. Landis and F. Neese, All-Electron Scalar Relativistic Basis Sets for Third-Row Transition Metal Atoms, J. Chem. Theory Comput., 2008, 4, 908 CrossRef CAS
; D. A. Pantazis and F. Neese, All-Electron Scalar Relativistic Basis Sets for the Lanthanides, J. Chem. Theory Comput., 2009, 5, 2229 CrossRef
; D. A. Pantazis and F. Neese, All-electron scalar relativistic basis sets for the 6p elements, Theor. Chem. Acc., 2012, 131, 1292 Search PubMed
; D. A. Pantazis and F. Neese, All-Electron Scalar Relativistic Basis Sets for the Actinides, J. Chem. Theory Comput., 2011, 7, 677 CrossRef
.
- N. G. Tsierkezos and A. I. Philippopoulos, Conductometric and Voltammetric Studies on the Bis(Triphenyl Phosphine) Ruthenium(II) Complex, Cis-[RuCl2(L)(PPh3)2], Where L: 2-(2′-Pyridyl)Quinoxaline, Inorg. Chim. Acta, 2009, 362, 3079 CrossRef CAS
.
- E. Argüello, A. Bolaños, F. Cuenu, M. Navarro, V. Herrera, A. Fuentes and R. A. Sanchez-Delgado, Synthesis, Characterization and Some Catalytic Properties of Ruthenium Complexes Ru(PPh3)2Cl2(L)2 [L = 4-But-Py, 4-Vinyl-Py, 4-CN-Py, 4-Me-Py, 3-Me-Py, L2 = 4,4′-Bipy]. Kinetics of Cyclohexene Hydrogenation Catalysed by Ru(PPh3)2Cl2(4-But-Py)2, Polyhedron, 1996, 15, 909 CrossRef
.
- N. G. Tsierkezos, U. Ritter, A. I. Philippopoulos and D. Schroder, Electrochemical Studies of the Bis(Triphenyl Phosphine) Ruthenium(II) Complex, Cis-[RuCl2(L)(PPh3)2], with L = 2-(2’-Pyridyl)Quinoxaline, J. Coord. Chem., 2010, 63, 3517 CrossRef CAS
.
- R. Gericke and J. Wagler, Ruthenium Complexes of Diphenylphosphino Derivatives of Carboxylic Amides: Synthesis and Characterization of Bidentate P,N- and P,O-Chelate Ligands and Their Reactivity towards [RuCl2(PPh3)3], Polyhedron, 2016, 120, 134 CrossRef CAS
.
- L. H. Cohan, Sorption Hysteresis and the Vapor Pressure of Concave Surfaces, J. Am. Chem. Soc., 1938, 60, 433 CrossRef CAS
.
- S. Brunauer, L. S. Deming, W. E. Deming and E. Teller, On a Theory of the van Der Waals Adsorption of Gases, J. Am. Chem. Soc., 1940, 62, 1723 CrossRef CAS
.
- T. Klimova Berestneva, J. M. Martínez Rosales and J. Ramírez Solís, Efecto del método de remoción del surfactante en la textura de Ti(R)-MCM-41, Rev. Mex. Ing. Quim., 2002, 1, 105 CAS
.
- A. Brangule and K. A. Gross, Importance of FTIR Spectra Deconvolution for the Analysis of Amorphous Calcium Phosphates, IOP Conf. Ser.: Mater. Sci. Eng., 2015, 77, 12027 Search PubMed
.
- K. Araki, N. Yagi, Y. Ikemoto, H. Yagi, C. J. Choong, H. Hayakawa, G. Beck, H. Sumi, H. Fujimura, T. Moriwaki, Y. nagai, Y. Goto and H. Mochizuki, Synchrotron FTIR Micro-Spectroscopy for Structural Analysis of Lewy Bodies in the Brain of Parkinson's Disease Patients, Sci. Rep., 2015, 5, 17625 CrossRef CAS
.
- A. Fidalgo and L. M. Ilharco, The Defect Structure of Sol–gel-Derived Silica/Polytetrahydrofuran Hybrid Films by FTIR, J. Non-Cryst. Solids, 2001, 283, 144 CrossRef CAS
.
- Q. Hu, H. Suzuki, H. Gao, H. Araki, W. Yang and T. Noda, High-Frequency FTIR Absorption of SiO2/Si Nanowires, Chem. Phys. Lett., 2003, 378, 299 CrossRef CAS
.
- A. Ahmed, H. A. Tajmir-Riahi and R. Carpentier, A Quantitative Secondary Structure Analysis of the 33 kDa Extrinsic Polypeptide of Photosystem II by FTIR Spectroscopy, FEBS Lett., 1995, 363, 65 CrossRef CAS
.
- P. Pascuta, G. Borodi and E. Culea, Structural investigation of bismuth borate glass ceramics containing gadolinium ions by X-ray diffraction and FTIR spectroscopy, J. Mater. Sci.: Mater. Electron., 2009, 20, 360 CrossRef CAS
; O. Zhao, Y. Li, R. Liu, A. Chen, G. Zhang, F. Zhang and X. Fan, Enhanced hydrogenation of olefins and ketones with a ruthenium complex covalently anchored on graphene oxide, J. Mater. Chem. A, 2013, 1, 15039 RSC
.
- A. M. B. Silva, C. M. Queiroz, S. Agathopoulos, R. N. Correia, M. H. V. Fernandes and J. M. Oliveira, Structure of SiO2–MgO–Na2O Glasses by FTIR, Raman and 29Si MAS NMR, J. Mol. Struct., 2011, 986, 16 CrossRef CAS
.
- Y. Shigesato, Y. Hayashi, A. Masui and T. Haranou, The Structural Changes of Indium–Tin Oxide and a-WO3 Films by Introducing Water to
the Deposition Processes, Jpn. J. Appl. Phys., 1991, 30, 814 CrossRef CAS
.
- S. Rada, M. Culea and E. Culea, Structure of TeO2⋯B2O3 Glasses Inferred from Infrared Spectroscopy and DFT Calculations, J. Non-Cryst. Solids, 2008, 354, 5491 CrossRef CAS
.
- I. Georgieva, N. Mintcheva, N. Trendafilova and M. Mitewa, IR Study of the N,N′,N′′-Triphenylguanidine and Its Imine Nitrogen Coordinated Pd(II) Complexes, Vib. Spectrosc., 2001, 27, 153 CrossRef CAS
.
- M. Yáñez, J. Guerrero, P. Aguirre, S. A. Moya and G. Cárdenas-Jirón, Experimental and Theoretical Characterization of Ru(II) Complexes with Polypyridine and Phosphine Ligands, J. Organomet. Chem., 2009, 694, 3781 CrossRef
.
- T. E. Chavez-Gil, D. L. . de Faria and H. E. Toma, Resonance Raman Investigation of the Chromophore Centers in an Iron(II)–polyimine Supermolecule Containing Four Ruthenium(II)–bipyridine Groups, Vib. Spectrosc., 1998, 16, 89 CrossRef CAS
.
- J. F. Moulder, W. F. Stickle, P. E. Sobol and K. D. Bomben, Handbook of X-Ray Photoelectron Spectroscopy: A Reference Book of Standard Spectra for Identification and Interpretation of XPS Data, Perkin-Elmer Corporation, 1992 Search PubMed
.
- B. Varughese, S. Chellamma and M. Lieberman, XPS Study of Self-Assembly of Ruthenium Dimers [((Acac)2 Ru)2 Bptz] 0,+ on Hydrophobic and Hydrophilic SAMs, Langmuir, 2002, 18, 7964 CrossRef CAS
.
- O. Mann, W. Freyland, O. Raz and Y. Ein-Eli, Electrochemical Deposition of Ultrathin Ruthenium Films on Au(111) from an Ionic Liquid, Chem. Phys. Lett., 2008, 460, 178 CrossRef CAS
.
- A. Bolaños, F. Cuenú and R. Vargas, Spectroscopic Characterization and Termal Análisis of Triphenilphosphine Rutenium(II) Complexes with 2,6-Dimethylpirazine and Others N-Heterocycle as Ligands, Bol. Soc. Chil. Quim., 2002, 47, 299 Search PubMed
.
- S. Dutta, P. K. Bhattacharya, E. Horn and E. R. T. Tiekink, Synthesis and Substitution Reactions of Dichlorobis-Triphenylphosphine[2-(N-(2-Pyridinium-2-Yl)-Carbamoyl-N-)-Pyridine]Ruthenium(II), Polyhedron, 2001, 20, 1815 CrossRef CAS
.
- T. A. Stephenson and G. Wilkinson, New Complexes of Ruthenium (II) and (III) with Triphenylphosphine, Triphenylarsine, Trichlorostannate, Pyridine and Other Ligands, J. Inorg. Nucl. Chem., 1966, 28(4), 945–956 CrossRef CAS
.
- A. M. Zwickel and C. Creutz, Charge-Transfer Spectra of Ruthenium(II) Complexes, Inorg. Chem., 1971, 10, 2395 CrossRef CAS
.
- P. Day and N. Sanders, The Spectra of Complexes of Conjugated Ligands. Part I. Charge-Transfer in Phenanthroline Complexes: Energy Shifts on Substitution, J. Chem. Soc. A, 1967, 1530 RSC
; P. Day and N. Sanders, The Spectra of Complexes of Conjugated Ligands. Part I. Charge-Transfer in Phenanthroline Complexes: Intensities, J. Chem. Soc. A, 1967, 1536 RSC
.
Footnotes |
| † This paper is dedicated to the memory of Prof. Dr Armando Cabrera (July 1944-August 2014) and Mr Elias Mendoza Maca (May 1937–January 2021). |
| ‡ Electronic supplementary information (ESI) available: General experimental details, FT-IR spectra, Raman spectra, XPS analyses, atomic absorption (AA), DRS-UV-Vis spectra and spectra deconvolution, thermogravimetric analysis (TGA), superficial analysis (BET and BJH) and NTOs contour plots. See DOI: 10.1039/d0ra09282g |
| § G. B. and R. F. contributed equally. |
| This journal is © The Royal Society of Chemistry 2021 |

