 Open Access Article
Propionamide participating in H2SO4-based new particle formation: a theory study†
Xianwei Zhaoa,
Yunfeng Liac,
Chenpeng Zuoa,
Yanhui Sun e,
Fei Xu
 *ad,
Alexey B. Nadykto*b,
Lin Du
 a,
Yisheng Xuc,
Qingzhu Zhang
 a and
Wenxing Wanga
aEnvironment Research Institute, Shandong University, Qingdao 266237, P. R. China. E-mail: xufei@sdu.edu.cn; Fax: +86-532-5863-1986
bDepartment of Applied Mathematics, Moscow State University of Technology “Stankin”, Vadkovsky 1, Moscow 127055, Russia. E-mail: a.nadykto@stankin.ru; Fax: +7-495-9729-521
cChinese Research Institute Environmental Science, State Key Laboratory Environmental Criteria & Risk Assessment, Beijing 100012, P. R. China
dShenzhen Research Institute of Shandong University, Shenzhen 518057, P. R. China
eCollege of Environment and Safety Engineering, Qingdao University of Science & Technology, Qingdao 266042, P. R. China
First published on 23rd December 2020
Abstract
Propionamide (PA), an important pollutant emitted into the atmosphere from a variety of sources, is abundant in many areas worldwide, and could be involved in new particle formation (NPF). In this study, the enhancement of the H2SO4 (SA)-based NPF by PA was evaluated through investigating the formation mechanism of (PA)m(SA)n (m = 0–3 and n = 0–3) clusters using computational chemistry and kinetics modeling. Our study proved that the formation of all the PA-containing clusters is thermodynamically favorable. Furthermore, the ![[double bond, length as m-dash]](https://www.rsc.org/images/entities/char_e001.gif) O group in PA plays an important role in the clusters with more PA than SA, and the basicity of bases exerts a greater influence with an increasing amount of SA. We demonstrate that although the enhancing potential of PA is lower than that of the strongest enhancers of SA-based NPF such as methylamine (MA) and dimethylamine (DMA), PA can enhance the SA-based NPF at the parts per billion (ppb) level, which is typical for concentrations of C3-amides in, for example, urban Shanghai (China). The monomer evaporation is the dominant degradation pathway for the (PA)m(SA)n clusters, which differs from that of the SA–DMA system. The formation rate of PA-containing clusters is comparable to the rate coefficients for PA oxidation by hydroxyl (OH) radicals, indicating that participating in the SA-based NPF is a crucial sink for PA.
O group in PA plays an important role in the clusters with more PA than SA, and the basicity of bases exerts a greater influence with an increasing amount of SA. We demonstrate that although the enhancing potential of PA is lower than that of the strongest enhancers of SA-based NPF such as methylamine (MA) and dimethylamine (DMA), PA can enhance the SA-based NPF at the parts per billion (ppb) level, which is typical for concentrations of C3-amides in, for example, urban Shanghai (China). The monomer evaporation is the dominant degradation pathway for the (PA)m(SA)n clusters, which differs from that of the SA–DMA system. The formation rate of PA-containing clusters is comparable to the rate coefficients for PA oxidation by hydroxyl (OH) radicals, indicating that participating in the SA-based NPF is a crucial sink for PA.
1. Introduction
Atmospheric aerosols constitute the highest uncertainty factors in climate prediction, and adversely affect human health.1 Aerosols can indirectly modify the properties and the formation of clouds,2 as well as affecting climate either by reflecting or absorbing solar radiation.3 New Particle Formation (NPF) is believed to make at least 50% contribution to the total number concentration of atmospheric aerosol particles.4 NPF is a two-step process, including the formation of critical embryos, followed by rapid growth.1,5 Hydrogen bonding interactions and proton transfer are considered to be responsible for the critical nucleus.6 The chemical composition of critical embryos and rates, at which they are formed, strongly impact NPF.Atmospheric gas-phase sulfuric acid (SA) is the primary precursor of the process of atmospheric nucleation.7 However, typical concentration of gaseous SA is 106 to 107 molecules cm−3, could not explain high nucleation rates measured in the boundary layer.8 Consequently, atmospheric ammonia and amines are confirmed to enhance the stabilization of SA clusters via acid–base reactions.9 In addition to ammonia and amines, amides were also recently reported to lead to the formation of secondary organic aerosols.10,11
Amides, the derivatives of ammonia or amines, have attracted much attention because of their widespread occurrence and high concentrations in the atmospheric aerosol particles.12 For example, Yao et al. reported that the atmospheric concentration of amides varies from tens of part per trillion (ppt) to a few part per billion (ppb), with the concentration of most abundant species, C3-amides, being at the level of 8.7 ppb in urban Shanghai, China.13 Amides can be emitted from various natural and anthropogenic sources including agriculture, biomass burning, animal husbandry, cooking, synthetic leather manufacturing, carbon capture, and other industrial processes.12,14,15 In addition, the degradation processes of amines by atmospheric oxidants,16 as well as the atmospheric accretion reactions between organic acids and ammonia or amines17 are important sources. In atmosphere, amides have two important sinks. First of all, amides can react with OH and NO3 radicals, the rate coefficients are 10−11 and 10−14 cm3 s−1, respectively.10 In contrast, reactions of amides with Cl and amides with O3 are not crucial for the degradation of amides. Secondly, Malloy et al. have reported that imines and amides contribute significantly to aerosol formation.18 The amino group of amide can strongly bond with SA that enhances the formation of SA-containing pre-nucleation clusters, and, thus promotes NPF.19,20 Zhao et al. conducted a quantum chemistry study on the molecular interactions between some amides and methanol clusters21 and showed that the formation free energies of the clusters were strongly negative.
Due to an impressive progress in analytical instrumentation over past decade, the detection of various molecular ions,22 and clusters with the mobility-equivalent diameter of 1 nm became possible.23 However, NPF mechanisms and atmospheric species, other than SA, that can contribute to NPF rates remain poorly understood.6 In particular, mechanisms via which amides could enhance SA-based NPF under real atmospheric conditions are yet identified.
In this study, we investigate the role of propionamide (PA), a pollutant common in many areas all over the globe, on the stability and formation rates of SA-containing clusters formed during the initial stage of the NPF. We first illustrate the effects of SA, amines (methylamine (MA), dimethylamine (DMA), and trimethylamine (TMA)), ammonia (N), and water (W) on the (PA)(SA) clusters to determine their growth path. Subsequently, the structures with minimum free energy are obtained for the (PA)m(SA)n (m = 0–3 and n = 0–3) clusters using the artificial bee colony algorithm.24 The thermodynamic data for the clusters were calculated using the Gaussian 09 program25 and the kinetic data of the clusters were obtained using the Atmospheric Cluster Dynamics Code (ACDC).26
2. Computational methods
The Gaussian 09 program25 was employed for the density functional geometry optimization and frequency calculations. In this study, the M06-2X functional with the 6-311++G(3df, 3pd) basis set was employed to obtain the structures and energetics of the clusters. In previous studies,27,28 the M06-2X functional was confirmed to be an excellent approach to describe clusters containing SA. The harmonic frequencies of the stable structures were calculated to ensure that the structures were the local minima.In this study, a software for the global optimization of molecular clusters by the artificial bee colony algorithm named ABCluster24 and a different code developed in Prof. A. B. Nadykto's group were utilized to locate global minima. The details of the conformational sampling are given below. In the case, when ABCluster was used, 1000 automatically generated structures were optimized using the semi-empirical PM6 method.29,30 Then, up to 100 low-energy structures were selected to refine at the B3LYP/6-31g(d,p) level of theory to get 30 lowest energy isomers. At the final stage, these 30 lowest energy isomers were optimized at the M06-2X/6-311++G(3df, 3pd) level of theory. The Gibbs free energies of the cluster formation were computed using the Rigid Rotor Harmonic Oscillator (RRHO) approximation.
The sampling code developed by Prof. Nadykto with co-authors is based on the following rules: a mesh is created around the cluster, and molecule to be placed in the mesh nodes. The blind search algorithm is used to produce the guess geometries. The minimum distance between molecules and cluster are variable, as well as the orientation of molecules and mesh density. Generally, for each cluster of a given chemical composition, thousands of isomers have been sampled. We used a three-step optimization procedure, which includes (i) the initial/guess automatically generated geometries (typically around 200 or more) were optimized using the semi-empirical PM6 method,29,30 (ii) the most stable isomers, which located within 15 kcal mol−1 of the intermediate global minimum and duplicate removal, were selected to optimize using PW91PW91/CBSB7 method and (iii) the final optimization of the most stable at PW91PW91/CBSB7 level isomers within 5 kcal mol−1 of the current global minimum using the M06-2X/6-311++G(3df, 3pd) method.
The Atmospheric Cluster Dynamics Code (ACDC) developed by Hanna Vehkamäki and co-workers was employed to study the kinetic information during the process of cluster formation. McGrath et al.31,32 given a detailed description about the ACDC. Briefly, the program uses an efficient computer script to generate the birth–death equation and the MATLAB ode15s routine to solve the equation. The birth–death equation involves the generation (birth) of clusters through the collision of smaller clusters and evaporation of larger clusters, the destruction (death) of clusters through collisions with other clusters and the fragmentation of clusters into smaller clusters, other generation mechanisms, and other destruction mechanisms. In addition, a boundary condition was used to judge whether a cluster can be excluded from the system. The system was a “3 × 3 box”, where 3 is the maximum number of PA or SA in the clusters. The (PA)3(SA)4 and (PA)4(SA)4 stayed outside the system, while all other clusters that crossed the box boundary are returned to the system by monomer evaporation (details on the boundary condition are shown in the ESI†). The calculations using ACDC program were performed at 298.15 K and 1 atm. The concentration of SA was set to be 105, 106, 107, 108, and 109 cm−3, which correspond to the conditions of atmospheric NPF.33 The atmospheric concentrations of PA were set to be 1, 10, and 100 ppt, which is the range relevant to the concentration of DMA involved in the NPF. It is worth noting that the concentration of SA was considered to be the total concentration of all neutral clusters that consisting of any number of base molecules and one acid, as used in a previous study.34
3. Results and discussion
3.1 Formation of the (PA)(SA)(X) cluster
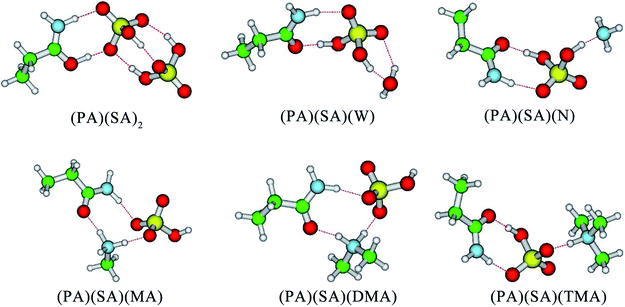
Firstly, SA, MA, DMA, TMA, N, and W were selected to evaluate the effect of each component on the stability of the (PA)(SA) cluster. The formation free energy data for the (PA)(SA)2, (PA)(SA)(W), (PA)(SA)(N), (PA)(SA)(MA), (PA)(SA)(DMA), and (PA)(SA)(TMA) clusters which obtained at both M06-2X/6-311++G(3df, 3pd) level of theory and M06-2X-D3/6-311++G(3df, 3pd) level of theory are presented in Table 1, and the geometries of the most stable isomers of the aforementioned clusters are displayed in Fig. 1. Generally, these structures are mainly stabilized by H-bonds, with two different proton transfer patterns observed in the formation of the (PA)(SA)2, (PA)(SA)(MA), (PA)(SA)(DMA), and (PA)(SA)(TMA) clusters. In the (PA)(SA)2 cluster formation, the oxygen atom of the PA carbonyl group serves as a of proton acceptor. The nitrogen atoms of the amines accept protons in the formation of the (PA)(SA)(MA), (PA)(SA)(DMA), and (PA)(SA)(TMA) clusters. This difference is attributed to the fact that the basicity of PA is much weaker than that of amines.| Complex | ΔG M06-2X | ΔG M06-2X-D3 | Δ(ΔG) M06-2X | Δ(ΔG) M06-2X-D3 |
|---|---|---|---|---|
| (PA)(SA)(W) | −13.36 | −15.65 | 0.0 | 0.0 |
| (PA)(SA)(N) | −16.75 | −19.09 | −3.39 | −3.44 |
| (PA)(SA)(MA) | −18.70 | −21.27 | −5.34 | −5.62 |
| (PA)(SA)(TMA) | −19.16 | −21.80 | −5.80 | −6.15 |
| (PA)(SA)(DMA) | −21.03 | −23.90 | −7.67 | −8.25 |
| (PA)(SA)2 | −23.34 | −27.62 | −9.98 | −11.97 |
In order to study the impact of D3 correction on computed Gibbs free energies, we have carried out a set of computations with M06-2X and M06-2X-D3 methods and 6-311++G(3df, 3pd) basis set and compared the obtained results. The obtained results show that Gibbs free energies produced by M06-2X with and without D3 correction exhibit identical trends and that the difference in the relative free energies of different reactions Δ(ΔG) produced by M06-2X and M06-2X-D3 agrees within less than 1 kcal mol−1 on average. This indicates that M06-2X adequately predicts the formation free energies of clusters being studied and, thus, can be recommended for studying atmospherically-relevant clusters. The formation free energies for all clusters are negative, indicating that the formation of these clusters are thermodynamically favorable. Among the amines- and ammonia-containing clusters, the formation free energy for the (PA)(SA)(DMA) is the lowest, probably due to the stronger basicity of the DMA compared to other amines and ammonia. However, the formation free energy of the (PA)(SA)2 cluster was −23.34 kcal mol−1, which is the lowest one in all cases, indicating that (PA)(SA)2 is the most thermodynamically favorable cluster. Thus, in subsequent sections, the SA–PA system is further examined in detail.
3.2 SA–PA system
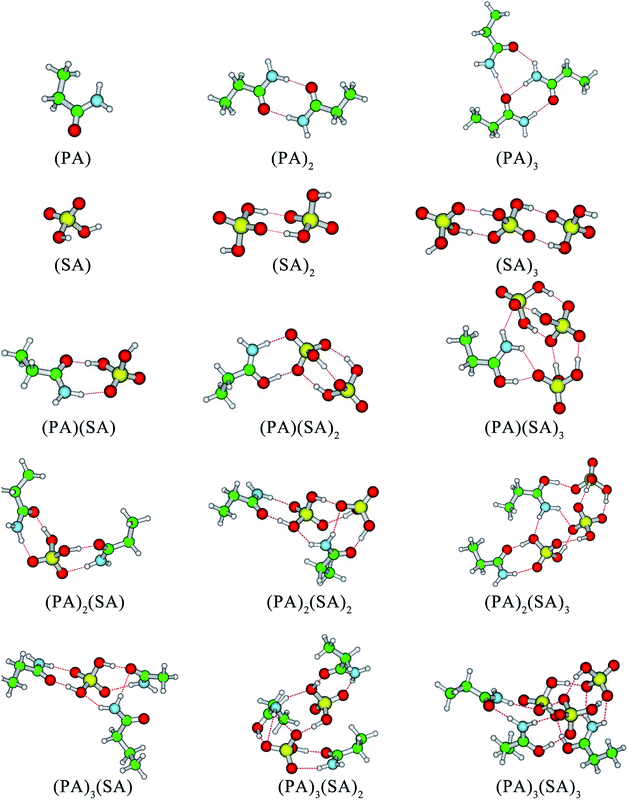
In addition to the (SA)2 and (SA)3 clusters, another structural feature of the clusters is that the –NH2 groups of the PA molecules serve as H-bond acceptors and form at least one H-bond with SA molecules or other PA molecules. In the cases of (PA)2(SA)2, (PA)2(SA)3, (PA)3(SA), and (PA)3(SA)2 cluster formation, the –NH2 group of a PA molecule can form two H-bonds, whereas that of another PA molecule only forms one H-bond. In contrast, in the formation of the (PA)3(SA)3 cluster, the –NH2 groups of all PA molecules can form two H-bonds. Further, in all the heteromolecular clusters except the (PA)(SA), the hydrogen atoms of all SA molecules can form H-bonds.
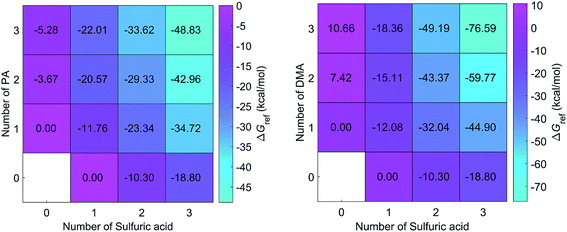
DMA is one of the key substances that promote the formation of new particles.19,36 In this study, the formation free energies of the SA–DMA system is a reference for discussing the formation free energies of the SA–PA system. The structures of SA–DMA system were adopted from a previous study,37 and optimized using the M06-2X functional with the 6-311++G(3df, 3pd) basis set. The formation free energies of the SA–PA/DMA system are presented in Fig. 3. For the pure base clusters, the formation free energies of (PA)2 and (PA)3 are 11.09 and 15.94 kcal mol−1 lower than (DMA)2 and (DMA)3, respectively. This may result from the fact that the N–H⋯O H-bond is stronger than N–H⋯N H-bond. However, the formation free energies of most heteromolecular SA–PA clusters are higher than those of corresponding SA–DMA clusters. For n ≥ 2, the differences between the formation free energy of the SA–PA and SA–DMA clusters exhibit positive correlations with the increasing number of bases. These differences are attributed to the lower basicity of PA than DMA. For the heteromolecular clusters of the SA–DMA system, excluding (DMA)2(SA) and (DMA)3(SA), the DMA molecules are protonated. Conversely, the formation of additional H-bonds involving the ![[double bond, length as m-dash]](https://www.rsc.org/images/entities/char_e001.gif) O group of the PA molecule results in lower formation free energy for the (PA)2(SA), and (PA)3(SA) clusters. In addition, the formation of the SA–PA clusters is thermodynamically favorable, as shown by the negative formation free energies.
O group of the PA molecule results in lower formation free energy for the (PA)2(SA), and (PA)3(SA) clusters. In addition, the formation of the SA–PA clusters is thermodynamically favorable, as shown by the negative formation free energies.
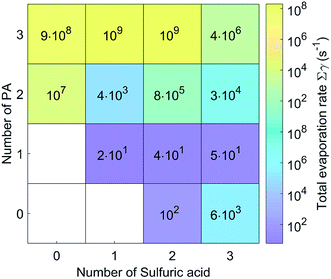
The evaporation rates for the (PA)(SA), (PA)(SA)2 and (PA)(SA)3 clusters are about 101 s−1, which is much lower than those of the other clusters. In fact, the evaporation rates of the pure base clusters are much higher than those of the pure acid clusters, and those of heteromolecular clusters increase significantly with increasing PA molecules. As presented in Table S1,† except for the (PA)2(SA)3, (PA)3(SA)2, and (PA)3(SA)3 clusters, the evaporation of a SA or PA molecule represented the main pathway for the other clusters.
We also compared the cluster evaporation rates for SA–PA system and SA–DMA system under the same simulation condition. In contrast to the other clusters, the pure base PA clusters exhibited lower evaporation rates than the corresponding DMA clusters. In addition, the evaporation rate of the (PA)(SA) was equal to that of the (DMA)(SA), indicating that the stability of the (PA)(SA) cluster is similar to the (DMA)(SA) cluster. Furthermore, the evaporation of small clusters was the main degradation pathway for some of the SA–DMA clusters,38 whereas, the monomer evaporation is dominant for the SA–PA clusters.
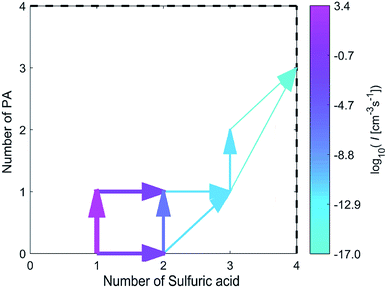
As shown in Fig. 5, the combination of a SA molecule and a PA molecule or the combination of two SA molecules is the first step of cluster growth, and the former more likely to occur. After this step, the growth proceeds mainly by a SA molecule joining in the (PA)(SA) cluster, a PA molecule joining in the (SA)2 cluster or a (PA)(SA) cluster joining in the (SA)2 cluster. Then a SA molecule was added to the (PA)(SA)2 cluster to form the (PA)(SA)3. Finally, a PA molecule was added to the (PA)(SA)3 cluster to form the (PA)2(SA)3 cluster, and the main cluster leaving the system was the (PA)3(SA)4 cluster.
The growth pathways for the SA–PA and SA–DMA system were also compared at the same conditions, with the pathways for the SA–DMA is presented in Fig. S2.† For both systems, the initially formed cluster consists mainly of a SA molecule and a basic molecule, with monomer addition as the main growth pathways.
4. Conclusion
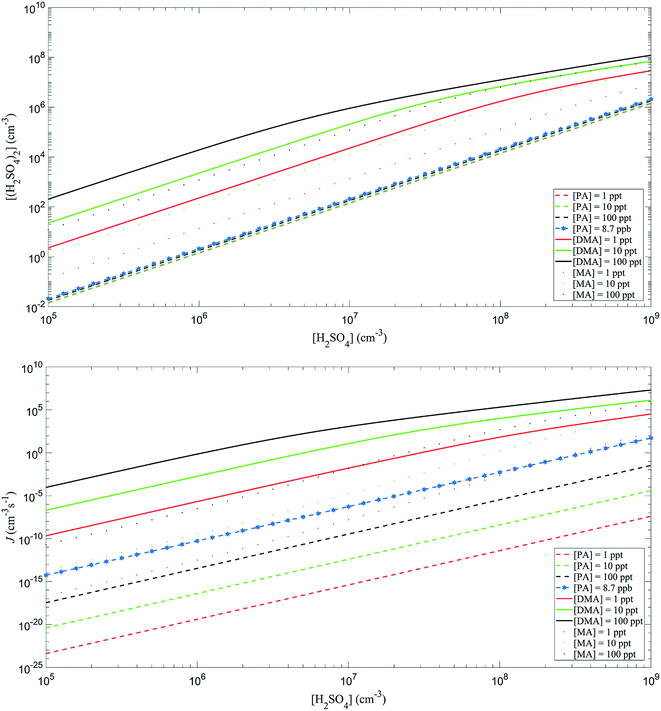
In this study, the density functional theory was implemented to investigate the properties of the (PA)(SA)(X) and (PA)m(SA)n clusters. We found that the![[double bond, length as m-dash]](https://www.rsc.org/images/entities/char_e001.gif) O group of PA played an important role in the clusters with more PA than SA, and the influence of the basicity of the bases enhanced as the SA molecules increased. The monomer evaporation was the dominant degradation pathway and the monomer collision is primary growth pathway for the (PA)m(SA)n clusters. The NPF boost due to PA at ppb level is similar to that due to DMA and MA at ppt level, and, thus, PA is expected to make an important contribution to NPF under real atmospheric conditions.
O group of PA played an important role in the clusters with more PA than SA, and the influence of the basicity of the bases enhanced as the SA molecules increased. The monomer evaporation was the dominant degradation pathway and the monomer collision is primary growth pathway for the (PA)m(SA)n clusters. The NPF boost due to PA at ppb level is similar to that due to DMA and MA at ppt level, and, thus, PA is expected to make an important contribution to NPF under real atmospheric conditions.
In addition, the participation of PA in the SA-based NPF provides a sink for PA. The formation rate of the SA–PA system was about 10−9 cm−3 s−1 at [PA] = 8.7 ppb and [H2SO4] = 107 cm−3, which surpass the rate coefficients for the amides reacting with OH. These results suggest that participating in the SA-based NPF offers a potentially important sinks for amides, especially for regions of high SA concentration.
Conflicts of interest
There are no conflicts to declare.Acknowledgements
This work was supported by the National Natural Science Foundation of China (No. 91644214, 21876102, 21976107), the Scientific Research by Educational Organizations of the Russian Ministry of Science and Higher Education in 2020–2022 (No. FSFS-2020-0031), the Russian Science Foundation (No. 18-11-00247), the Shenzhen Science and Technology Research and Development Funds (No. JCYJ20160510165106371), the Fundamental Research Funds of Shandong University (No. 2016WLJH51, 2017JC033), the China Postdoctoral Science Foundation funded project (No. 2017M612277, 2017T100493), the open foundation of state key laboratory of environmental criteria and risk assessment, Chinese Research Academy of Environmental Sciences (No. 2016OFP09). Furthermore, we gratefully acknowledge the valuable help of Hanna Vehkamäki (University of Helsinki) and Jonas Elm (Aarhus University) for the ACDC calculations. We declare that we have no known competing financial interests or personal relationships that could have appeared to influence the work reported in this paper.References
- R. Zhang, Science, 2010, 328, 1366–1367 CrossRef CAS.
- R. E. Orville, G. Huffines, J. Nielsen-Gammon, R. Zhang, B. Ely, S. Steiger, S. Phillips, S. Allen and W. Read, Geophys. Res. Lett., 2001, 28, 2597–2600 CrossRef.
- J. Haywood and O. Boucher, Rev. Geophys., 2000, 38, 513–543 CrossRef CAS.
- M. Ehn, J. A. Thornton, E. Kleist, M. Sipilä, H. Junninen, I. Pullinen, M. Springer, F. Rubach, R. Tillmann and B. Lee, Nature, 2014, 506, 476–479 CrossRef CAS.
- L. Wang, A. F. Khalizov, J. Zheng, W. Xu, Y. Ma, V. Lal and R. Zhang, Nat. Geosci., 2010, 3, 238–242 CrossRef CAS.
- M. Kulmala, J. Kontkanen, H. Junninen, K. Lehtipalo, H. E. Manninen, T. Nieminen, T. Petäjä, M. Sipilä, S. Schobesberger and P. Rantala, Science, 2013, 339, 943–946 CrossRef CAS.
- M. Sipilä, T. Berndt, T. Petäjä, D. Brus, J. Vanhanen, F. Stratmann, J. Patokoski, R. L. Mauldin, A. P. Hyvärinen and H. Lihavainen, Science, 2010, 327, 1243–1246 CrossRef.
- B. Wehner, T. Petäjä, M. Boy, C. Engler, W. Birmili, T. Tuch, A. Wiedensohler and M. Kulmala, Geophys. Res. Lett., 2013, 32, 17 Search PubMed.
- J. Almeida, S. Schobesberger, A. Kürten, I. K. Ortega, O. Kupiainenmäättä, A. P. Praplan, A. Adamov, A. Amorim, F. Bianchi and M. Breitenlechner, Nature, 2013, 502, 359 CrossRef CAS.
- I. Barnes, G. Solignac, A. Mellouki and K. H. Becker, Chemphyschem, 2010, 11, 3844–3857 CrossRef CAS.
- D. Y. Lee and S. A. Wexler, Atmos. Environ., 2013, 71, 95–103 CrossRef CAS.
- X. Ge, A. S. Wexler and S. L. Clegg, Atmos. Environ., 2011, 45, 524–546 CrossRef CAS.
- L. Yao, M. Y. Wang, X. K. Wang, Y. J. Liu, H. F. Chen, J. Zheng, W. Nie, A. J. Ding, F. H. Geng and D. F. Wang, Atmos. Chem. Phys., 2016, 16, 1–32 CrossRef.
- H. A. Kim, K. Kim, Y. Heo, S. H. Lee and H. C. Choi, Int. Arch. Occup. Environ. Health, 2004, 77, 108–112 CrossRef CAS.
- L. Zhu, G. W. Schade and C. J. Nielsen, Environ. Sci. Technol., 2013, 47, 14306–14314 CrossRef CAS.
- C. J. Nielsen, H. Herrmann and C. Weller, Chem. Soc. Rev., 2012, 41, 6684–6704 RSC.
- K. C. Barsanti and J. F. Pankow, Atmos. Environ., 2006, 40, 6676–6686 CrossRef CAS.
- Q. G. J. Malloy, L. Qi, B. Warren, D. R. C. Iii, M. E. Erupe and P. J. Silva, Atmos. Chem. Phys. Discuss., 2008, 8, 2051–2060 CrossRef.
- T. Kurtén, V. Loukonen, H. Vehkamäki and M. Kulmala, Atmos. Chem. Phys., 2008, 8, 7455–7476 CrossRef.
- A. B. Nadykto, J. Herb, F. Yu and Y. Xu, Chem. Phys. Lett., 2015, 624, 111–118 CrossRef CAS.
- H. Zhao, S. Tang, X. Xu and L. Du, Int. J. Mol. Sci., 2017, 18, 4 CrossRef.
- H. Junninen, Atmos. Meas. Tech. Discuss., 2010, 3, 1039–1053 CrossRef CAS.
- J. Jiang, M. Chen, C. Kuang, M. Attoui and P. H. McMurry, Aerosol Sci. Technol., 2011, 45, 510–521 CrossRef CAS.
- J. Zhang and M. Dolg, Phys. Chem. Chem. Phys., 2015, 17, 24173–24181 RSC.
- M. J. Frisch, G. W. Trucks, H. B. Schlegel, G. E. Scuseria, M. A. Robb, J. R. Cheeseman, G. Scalmani, V. Barone, B. Mennucci and G. A. Petersson, 2009.
- G. Rubasinghege and V. H. Grassian, J. Phys. Chem. A, 2012, 116, 5180–5192 CrossRef CAS.
- Y. Zhao and D. G. Truhlar, Theor. Chem. Acc., 2008, 120, 215–241 Search PubMed.
- H. Li, J. Zhong, H. Vehkamaki, T. Kurten, W. Wang, M. Ge, S. Zhang, Z. Li, X. Zhang, J. S. Francisco and X. C. Zeng, J. Am. Chem. Soc., 2018, 140, 11020–11028 CrossRef CAS.
- L. Partanen, H. Vehkamäki, K. Hansen, J. Elm, H. Henschel, T. Kurtén, R. Halonen and E. Zapadinsky, J. Phys. Chem. A, 2016, 120, 8613–8624 CrossRef CAS.
- J. J. P. Stewart, J. Mol. Model., 2007, 13, 1173–1213 CrossRef CAS.
- O. Kupiainen-Maatta, T. Olenius, H. Korhonen, J. Malila, M. Dal Maso, K. Lehtinen and H. Vehkamaki, J. Aerosol Sci., 2014, 77, 127–144 CrossRef CAS.
- T. Olenius, I. Riipinen, K. Lehtipalo and H. Vehkamaki, J. Aerosol Sci., 2014, 78, 55–70 CrossRef CAS.
- V. M. Kerminen, T. Petaja, H. E. Manninen, P. Paasonen, T. Nieminen, M. Sipil, H. Junninen, M. Ehn, S. Gagné and L. Laakso, Atmos. Chem. Phys., 2010, 10, 10829–10848 CrossRef CAS.
- T. Olenius, O. Kupiainenmäättä, I. K. Ortega, T. Kurtén and H. Vehkamäki, J. Chem. Phys., 2013, 139, 8601 CrossRef.
- H. B. Xie, J. Elm, R. Halonen, N. Myllys, T. Kurtén, M. Kulmala and H. Vehkamaki, Environ. Sci. Technol., 2017, 51, 8422 CrossRef CAS.
- C. N. Jen, P. H. Mcmurry and D. R. Hanson, J. Geophys. Res. Atmos., 2014, 119, 7502–7514 CAS.
- I. K. Ortega, O. Kupiainen, T. Kurtén, T. Olenius, O. Wilkman, M. J. Mcgrath, V. Loukonen and H. V. Ki, Atmos. Chem. Phys., 2012, 12, 27327–27357 Search PubMed.
- M. J. Mcgrath, T. Olenius, I. K. Ortega, V. Loukonen, P. Paasonen, T. Kurtén, M. Kulmala and H. V. Ki, Atmos. Chem. Phys. Discuss., 2012, 11, 2345–2355 CrossRef.
- T. Olenius, R. Halonen, T. Kurtén, H. Henschel, O. Kupiainen-Määttä, I. K. Ortega, C. N. Jen, H. Vehkamäki and I. Riipinen, J. Geophys. Res. Atmos., 2017, 122, 7103–7118 CAS.
Footnote |
| † Electronic supplementary information (ESI) available: The first part introduces the boundary conditions in ACDC. Fig. S1 shows the ratio between the monomer collision rate and the cluster total evaporation rate for (PA)m(SA)n (m = 0–3 and n = 0–3). Fig. S2 shows the main clustering pathways and actual Gibbs free energy surface for the formation of (DMA)m(SA)n clusters. Fig. S3 shows the evaporation rates for (DMA)m(SA)n clusters. Table S1 shows evaporation coefficients for all evaporation pathways of the (PA)m(SA)n clusters. Table S2 shows coordinates of all optimized clusters. See DOI: 10.1039/d0ra09323h |
| This journal is © The Royal Society of Chemistry 2021 |

