 Open Access Article
Metal-free high-adsorption-capacity adsorbent derived from spent coffee grounds for methylene blue†
Bayaraa Sukhbaatar a,
Bongyoung Yoo*a and
Jae-Hong Lim
 *b
*b
aDepartment of Materials Science and Chemical Engineering, Hanyang University, Ansan 15588, Korea. E-mail: byyoo@hanyang.ac.kr
bDepartment of Materials Science and Engineering, Gachon University, Seongnam-si 13120, Korea. E-mail: limjh@gachon.ac.kr
First published on 27th January 2021
Abstract
Heavy-metal-free carbon materials were prepared from spent coffee grounds (SCG) using the coupled KOH–urea and NaOH–urea as activating agents, and these were compared with SCG activation by the alkali salts alone. SCG was impregnated with the activating agents before being pyrolyzed at 800 °C under a N2 atmosphere. Characterization of the as-pyrolyzed carbon materials was performed by field-emission scanning electron microscopy (FE-SEM), transmission electron microscopy (TEM), X-ray diffraction (XRD), Raman spectroscopy, X-ray photoelectron spectroscopy (XPS), and measurement of N2 adsorption–desorption isotherms. The carbon materials were utilized for the adsorption of methylene blue (MB) in aqueous solutions. Combining KOH and urea as activating agents resulted in the generation of pertinent SCG-derived carbon material properties, including a large surface area (1665.45 m2 g−1) and excellent MB adsorption capacity. Adsorption efficiencies were studied using adsorption kinetics (pseudo-first-order and pseudo-second-order) and adsorption isotherm (Langmuir, Freundlich, and Temkin) models. The influences of pH and temperature were investigated. The results of this work raise new possibilities for synthesizing carbon materials with high MB adsorption capacities from biowastes, via less-toxic, energy-saving conventional pyrolysis methods for water-treatment applications.
Introduction
Worldwide coffee consumption has steadily increased over the past decades, reaching an annual consumption level of almost 10 million metric tons1 and leading to enormous amounts of organic waste. Because over 50% of a coffee bean is thrown away after the brewing process, more than five million metric tons of spent coffee grounds (SCG) are produced, and this figure is rising year-on-year. In South Korea, 82![[thin space (1/6-em)]](https://www.rsc.org/images/entities/char_2009.gif) 446 tons of coffee were imported in 2012, with this number increasing to 115
446 tons of coffee were imported in 2012, with this number increasing to 115![[thin space (1/6-em)]](https://www.rsc.org/images/entities/char_2009.gif) 837 tons in 2016.2
837 tons in 2016.2
Since SCG contain a large number of organic compounds, such as fatty acids, cellulose, hemicellulose, and other carbohydrates, it can be utilized in biomass-to-energy conversion technologies to generate value-added products.3 Thus, many researchers have focused on the valorisation of SCG for such applications, which generates precursors for carbon materials,4–6 biodiesel production,7–9 adsorbents,10–13 and fillers for composite materials.14,15
Carbon materials derived from biowaste are used as adsorbents for water treatment because they possess the advantages of being low cost, abundant, and eco-friendly. In particular, among methods for organic dye removal from wastewater, such as filtration, ion-exchange, oxidation, electrocoagulation, etc., the adsorption method is the most economical and effective technique.13 The contamination of water with cationic dyes, such as methylene blue (MB), is a hot topic because these chemicals are widely used in the dye industry and challenging to remove, toxic to health, and cause environmental damage.
Thus, coffee waste has been widely used as a precursor in carbon material preparation for water treatment. Oliveira et al. reported that metallic-chloride-activated carbon obtained from coffee husks showed maximum capacities of 263 and 167 mg g−1 for MB and phenol adsorption, respectively.16 Similarly, Wen et al. prepared magnetic carbon materials from SCG using FeCl3 as an activator. These were shown to have adsorption capacities from aqueous solution of 653.6 mg g−1 for MB and 465.8 mg g−1 for methyl orange.
Despite the fact that there have been a number of attempts to gain high-adsorption-capacity, highly efficient carbon materials from biowastes, there remain some problems to be solved for this approach. For example, the prepared carbon contains heavy metals in some cases. Heavy metals are toxic to human health, metallic elements in water being non-biodegradable. Thus, metallic ions, such as iron, zinc, etc., can move up the biological chain, eventually reaching human beings where their consumption may result in genetic disease or have mutagenic or carcinogenic effects.17
In addition, to prepare carbon materials from biowastes, chemical activation is widely utilized – chemicals such as KOH, NaOH, KCO3, H3PO4, and urea are often used as activating agents.18,19 NaOH-modified SCG has been prepared for nitrobenzene adsorption, and a removal efficiency of 98.2% was demonstrated.20 Yun et al., reported the preparation of a porous carbon supercapacitor material from coffee waste with KOH,21 and Ilnicka et al., prepared nitrogen-doped carbon via a urea treatment for electrochemical applications.22 Likewise, many other carbon materials have been prepared by alternative chemical activation. In this work, high-surface-area carbon materials were prepared from SCG using combinations of urea and alkali salts (KOH or NaOH) as activating agents, and these were compared with materials prepared by activation of SCG with KOH or NaOH alone. To the best of our knowledge, a study of the MB adsorption performance or one on that compares alkali metal with alkali metal and urea-coupled activation techniques for carbon material preparation from SCG have not been reported previously.
The prepared carbon materials were employed as adsorbents of MB under various conditions, including wide ranges of temperature and pH. The combination of urea and an alkali salt as an activation agent was shown to produce synergistic effects on the properties of the carbon materials, which were demonstrated to have higher capacities for MB adsorption from an aqueous solution than the materials activated using alkali salts alone. In particular, the carbon materials did not contain heavy metals, which means a significant potential pollution problem in water treatment is avoided. These SCG-derived carbon materials could lead to developments in conventional energy-saving pyrolysis techniques and adsorbents with low-toxicity and high adsorption capacities for water treatment applications.
Experimental
Materials and chemicals
Waste from the extraction of coffee from medium-roast coffee beans with hot water (SCG) was collected from commercial sources in Korea (Starbucks). The extracted SCG powder was dried in the oven at 105 °C for 12 h. All the chemicals used in this work, including KOH, NaOH, urea, HCl, ethanol, and MB, were analytical grade (Daejung Chemical and Metals Co. Ltd., Korea).Sample preparation
Dried SCG powder was ground in a blender, and a mesh size of 40 (using a mesh strainer) was used to isolate samples for the subsequent experiments. To carry out pyrolysis with chemical activation, 10.0 g of SCG powder was mixed with an equal mass of NaOH, 50 mL of water was added, and then the mixture was agitated for 12 h on a magnetic stirrer plate at 200 rpm and dried at 105 °C for not less than 12 h. Next, the sample was placed at the centre of a tube electric furnace. All the air inside the furnace was evacuated and replaced with nitrogen. Pyrolysis was performed under a nitrogen flow of 500 mL min−1. The furnace temperature was ramped at a rate of 10 °C min−1 until the set carbonization temperature of 800 °C was reached, and then this temperature was maintained for 2 h. After cooling in a nitrogen flow, the sample was neutralized with 1 M hydrochloric acid and washed thoroughly with distilled water. After drying at 105 °C for not less than 12 h, the obtained NaOH-activated carbon derived from SCG (SCG-Na) was stored in a vacuum desiccator.The same principal procedures were employed to prepare the other samples. The different activating agents—the combinations of NaOH with urea and KOH with urea, as well as KOH alone (mass ratios 1![[thin space (1/6-em)]](https://www.rsc.org/images/entities/char_2009.gif) :
:![[thin space (1/6-em)]](https://www.rsc.org/images/entities/char_2009.gif) 1 w/w for the single-chemical activation and 1
1 w/w for the single-chemical activation and 1![[thin space (1/6-em)]](https://www.rsc.org/images/entities/char_2009.gif) :
:![[thin space (1/6-em)]](https://www.rsc.org/images/entities/char_2009.gif) 1
1![[thin space (1/6-em)]](https://www.rsc.org/images/entities/char_2009.gif) :
:![[thin space (1/6-em)]](https://www.rsc.org/images/entities/char_2009.gif) 1 w/w/w for the combined agent activation)—resulted in samples that herein we denote SCG-NaU, SCG-KU, and SCG-K, respectively.
1 w/w/w for the combined agent activation)—resulted in samples that herein we denote SCG-NaU, SCG-KU, and SCG-K, respectively.
Characterization of carbon materials
The surface pore structures of the carbon materials were investigated by N2 adsorption at 77 K (TrisStar II 3020). Specific surface areas were calculated from the N2 adsorption isotherm using the Brunauer–Emmett–Teller (BET) equation.23 The pore-size distribution was calculated using the Barrett–Joyner–Halenda (BJH) model.24 The carbon materials were analysed morphologically via field-emission scanning electron microscopy (FE-SEM) (TESCAN MIRA3).24 X-ray diffraction (XRD) measurements were recorded on a Bruker D8 Advance diffractometer using Cu Kα radiation. Data were collected with an angular resolution of 0.02° at a rate of 8° min−1, over the 2θ range of 15° to 80°. X-ray photoelectron spectroscopy (XPS) was performed by using a VG Scienta R3000 electron spectrometer. Raman spectroscopic analysis was performed by using a UniRam system (Uninanotech Co., Ltd, Korea).Adsorption experiments for aqueous MB solution
In this experiment, a calibration curve was obtained to determine the dependence of the absorbance on MB concentration, to calculate the adsorption efficiency for the adsorbate based on the Beer–Lambert law. Various initial MB solution concentrations (120, 140, 160, 180, and 200 mg L−1) were used. Activated carbon (15 mg) was dispersed in 50 mL of the MB solution. Aliquots of the solutions were extracted periodically and centrifuged at 15![[thin space (1/6-em)]](https://www.rsc.org/images/entities/char_2009.gif) 000 rpm for 5 min before spectroscopic measurements were acquired. The centrifugation was carried out to prevent adsorption of the dye by the filters in the spectrometer. After centrifugation, the supernatants were analysed by UV-visible spectroscopy, using the absorbance at 664 nm for quantification. Experimental MB solutions were diluted to concentrations that could be fit using the Beer–Lambert law expression before the spectrophotometric measurements were acquired. All of the adsorption tests were made by carrying out three repetitions in parallel. This resulted in relative standard deviations (RSD%) of less than 5%, and the means were recorded as the experimental results. Measurements of a blank sample (an MB solution without any carbon material added) were acquired to control for concentration reduction due to unknown factors.
000 rpm for 5 min before spectroscopic measurements were acquired. The centrifugation was carried out to prevent adsorption of the dye by the filters in the spectrometer. After centrifugation, the supernatants were analysed by UV-visible spectroscopy, using the absorbance at 664 nm for quantification. Experimental MB solutions were diluted to concentrations that could be fit using the Beer–Lambert law expression before the spectrophotometric measurements were acquired. All of the adsorption tests were made by carrying out three repetitions in parallel. This resulted in relative standard deviations (RSD%) of less than 5%, and the means were recorded as the experimental results. Measurements of a blank sample (an MB solution without any carbon material added) were acquired to control for concentration reduction due to unknown factors.
In order to establish the adsorption rate and understand the MB adsorption dynamics of the samples, pseudo-first-order and pseudo-second-order kinetic models were investigated. Langmuir, Freundlich, and Temkin isotherm models were employed to evaluate various aspects of the adsorption behaviour, including the type of adsorption and the adsorption capacity of the samples. The influences of solution pH and temperature on MB adsorption were studied in the range of 2–10 and 20–50 °C, respectively, using an MB concentration of 200 mg L−1; the solution pH was adjusted with 0.1 M HCl and 0.1 M KOH.
The quantity of adsorbed MB on an adsorbent sample (qt, mg g−1) was calculated for each sample from eqn (1):
 | (1) |
Recovery test
In the recovery test, 30 mg of adsorbent was added to 50 mL of an MB solution with an initial concentration 120 mg L−1. Then, the analysis procedure was performed in the same was as that mentioned above. After the adsorption test, the sample was separated by centrifugation, washed with water, and dried at 105 °C for 6 h. Next, the sample was recovered using 70% ethanol with magnetic stirring for 2 h, then centrifuged, dried, and annealed as previously described for the sample preparation. A further five cycles of adsorbent recovery and testing was performed.Results and discussion
Characterization of activated carbon
In this work, several types of SCG-derived carbon materials were prepared and investigated with the aim of obtaining a more convenient and less energy-consuming method for synthesizing heavy-metal-free carbon materials. Morphological analysis, porous structure observation, and chemical and crystal structure analyses were employed to determine the influence of urea on methylene blue adsorption and compare the KOH/urea and NaOH/urea activation agents with the known chemical activating agents KOH and NaOH.Porous structure analysis
N2 adsorption and desorption isotherms for the carbon material samples were acquired at 77 K. The isotherms, and the pore size distribution plots for SCG-Na, SCG-NaU, SCG-K, and SCG-KU are displayed in Fig. 1. The isotherms for SCG-K and SCG-KU resemble Type I isotherms, as defined by the International Union of Pure and Applied Chemistry (IUPAC) classification.24,25 No hysteresis loop and pore sizes of less than 20 Å were obtained, indicating micropore-dominated carbon for these samples. In contrast, Type IV isotherms were obtained for SCG-Na and SCG-NaU, with hysteresis loops at approximately 0.4–0.8 P/P0 (Fig. 1(a)), which indicates the existence of a mesoporous structure. The pore-size distributions of those carbon materials were found to be in the range of 15–40 Å, validating the mesoporosity of the structures.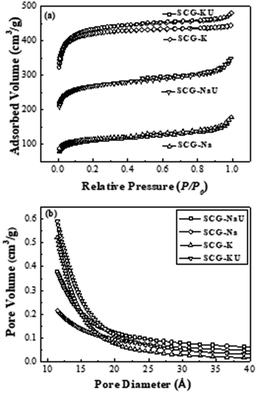 | ||
| Fig. 1 (a) N2 adsorption–desorption isotherms at 77 K and (b) pore volume distributions for carbon materials. | ||
Differences between the pore structures of the activated carbons are shown in Fig. 1(b) and Table 1. Activation with KOH alone or in combination with urea resulted in carbon materials with a much higher BET surface area (SBET) of >1600 m2 g−1. It is apparent that in the case of NaOH, there is a remarkable difference between the SBET values for SCG-Na and SCG-NaU (with and without urea). Furthermore, the presence of urea during the activation step resulted in a total pore volume of 0.38 mL g−1 (SCG-NaU), a marked increase with respect to 0.21 mL g−1 for the activation without urea (SCG-Na). Although it is not a well-known interaction mechanism, the SCG fibres are known to be enhanced by the infiltration of alkali activating agents such as KOH and NaOH.26 Since KOH is more reactive than NaOH, it can penetrate fibres and react more rapidly with oil molecules than NaOH. This might be one reason why KOH produces a more significant increase in carbon porosity than NaOH.
| Samples | SBET (m2 g−1) | Average pore size (Å) | Total pore volume (mL g−1) |
|---|---|---|---|
| SCG-Na | 410.55 | 1719.54 | 0.21 |
| SCG-NaU | 1032.28 | 17.62 | 0.38 |
| SCG-K | 1630.89 | 14.90 | 0.52 |
| SCG-KU | 1665.45 | 15.51 | 0.59 |
Furthermore, urea is shown to be capable of adequately expanding the surface area and porosity of these carbon materials. Lee et al. derived nitrogen-doped carbon from chitosan with urea and KOH, and the total pore size and mesopore volumes of this material were found to be increased because of the influence of urea.19 In addition, Wakeland et al. used urea to prepare graphene from graphite oxide. In this work, it was demonstrated that urea acted as an expansion–reduction agent, which means that the decomposition of urea generates a gas that prevents the reduction of carbon materials during a high-temperature annealing process.27
Surface morphology analysis
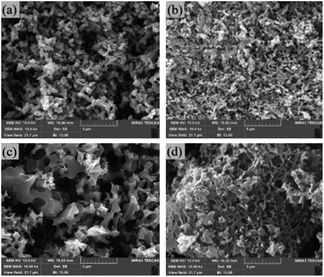
FE-SEM images of the samples are shown in Fig. 2. The morphology of SCG-Na is much less porous than that of SCG-NaU, with a collapsed structure apparent in Fig. 2(a). As shown in Fig. 2(b), combined NaOH and urea activation results in a structure for SCG-NaU that is more porous, disordered, and interconnected. Further, an interconnected carbon structure can be seen, which indicates that urea played a significant role in altering the morphology of those carbon materials.22Similarly, in the case of activation KOH alone, the resultant structure was disordered, whereas, with the participation of urea in the activation process, the resulting material displayed more interconnected surface structures.
Furthermore, TEM images of SCG-K and SCG-KU are provided in Fig. S1† and these provide a clearer understanding of the morphology of these samples. Both SCG-KU and SCG-K exhibit rough surfaces, which indicates porous and amorphous structures. In addition, it is possible that Fig. S1(b)† displays a few graphitic layers (the wave-like structures in the image) that exist because of the urea effect.19,28 Fig S1(d),† however, does not include any wave-like shapes, which indicates a more amorphous structure.
In addition, urea affects structure-directing agents for carbon materials during high-temperature pyrolysis. Both KOH and NaOH act synergistically with urea, as indicated by the generation of porous and interconnected morphologies for carbon materials.26 Substances such as biuret, cyanic acid, ammeline, ammelide, ammonia, and a diverse range of polymers are formed by the decomposition of urea, depending on the reaction temperature.29 These types of gaseous derivatives can act as reducing agents, preventing the oxidation of the carbon surface by other substances during pyrolysis.
Crystal structure
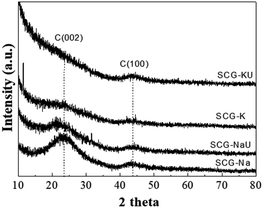
Fig. 3 displays wide-angle XRD patterns of SCG-Na, SCG-NaU, SCG-K, and SCG-KU. Two distinct diffraction peaks are observed in both the SCG-Na and SCG-NaU patterns, at approximately 23° and 44°. These peaks can be respectively assigned to planar graphite (002), indicating some carbon-layer stacking and amorphous structure, and carbon (100), indicating the ordered hexagonal carbon structure.21 The presence of both of these peaks suggested the formation of disordered carbon materials. The SCG-K and SCG-KU patterns both include a broad peak for graphite (002) as a result of the depletion of the carbon layer during pyrolysis with KOH. It is confirmed that the pore surface area was increased by KOH activation to a greater extent than by NaOH activation, and the KOH activation mainly generates micropores within the carbon structure.30 It was also previously reported that KOH is a better porosity-developing agent than NaOH during pyrolysis.31,32 KOH is principally used in applications such as the production of soap and electrolytes for batteries and fuel cells and as a catalyst for biodiesel manufacturing since its reactivity is higher than that of sodium hydroxide.33Generally, alkaline substances such as KOH and NaOH can react with carbon during pyrolysis via the following reaction mechanism:
| 6MeOH + C ↔ 2Me + 3H2 + 2Me2CO3 | (2) |
Raymundo-Piñero et al. reported the KOH and NaOH reactions as proceeding differently, depending on the pyrolysis temperature. This provides a reason for the difference between the effects of these two substances on the development of the carbon structure and porosity.31
In the case of KOH activation, this proceeds at around 800 °C via the reactions shown in eqn (3) and (4):28
| K2CO3 + C ↔ K2O + 2CO | (3) |
| K2CO3 ↔ K2O + CO2 | (4) |
The reaction may occur as follows if the temperature is higher than 800 °C.
| K2O + C ↔ 2K + CO | (5) |
Lillo-Ródenas et al. reported that NaOH activation, as defined in eqn (6), occurs via different reactions that are thermodynamically possible during pyrolysis at around 730 °C.32
| 6NaOH + C ↔ 2Na + 3H2 + 2Na2CO3 | (6) |
Thus, KOH reduction is more favourable than NaOH at the pyrolysis temperature. During pyrolysis, metallic potassium ions may affect the carbon surfaces by undergoing intercalation, generating micropores at high temperatures.32
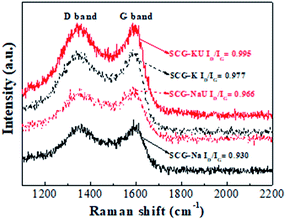
The Raman spectra exhibit two distinct peaks centred at 1368 cm−1 (D band) and 1588 cm−1 (G band) (Fig. 4), indicating disordered carbon and hexagonal carbon structures, respectively.34 The ratios of the D and G band intensities (ID/IG) were found to be approximately 0.930, 0.966, 0.977, and 0.995 for SCG-Na, SCG-NaU, SCG-K, and SCG-KU, respectively. The higher ID/IG values for SCG-K and SCG-KU suggest a higher proportion of defective, porous and amorphous structure. SCG-Na exhibits much lower ID/IG values, indicating significantly reduced amounts of porous and amorphous carbon structure. The presence of urea corresponds to increased ID/IG values, for both NaOH and KOH activation, in agreement with the XRD results. The influence of KOH on micropore formation and disorder is well known, but it has also been reported that urea had a role as a structure-directing agent, as mentioned above.26
Chemical structure
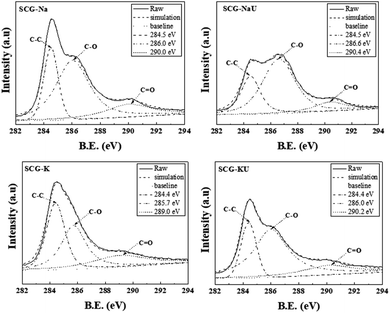
In Fig. 5, via the fitting of the C1 XPS spectra, three significant contributions to this spectral band were demonstrated. The peak assigned to graphitic structure, sp2-hybridized carbon (C![[double bond, length as m-dash]](https://www.rsc.org/images/entities/char_e001.gif) C), or sp3-hybridized carbon (C–C), is centred at around 284.5 eV; the presence of oxygen (C–O–C) is confirmed via the peak centred at ∼286.0 eV, and the peak indicating the presence of O
C), or sp3-hybridized carbon (C–C), is centred at around 284.5 eV; the presence of oxygen (C–O–C) is confirmed via the peak centred at ∼286.0 eV, and the peak indicating the presence of O![[double bond, length as m-dash]](https://www.rsc.org/images/entities/char_e001.gif) C–OH groups appears at ∼289.0 eV.24
C–OH groups appears at ∼289.0 eV.24
By calculating the percentage of functional groups from the integrated area of the corresponding peaks after fitting (Table 2), we found that SCG-Na contained a much higher proportion (49.2%) of graphitic groups (C–C or C![[double bond, length as m-dash]](https://www.rsc.org/images/entities/char_e001.gif) C) and a much lower proportional C–O content (11.7%) than the other samples. However, the C–O content and graphitic structure for SCG-NaU were 61.1% and 26.5%, respectively. SCG-K contained the most even distribution of content among graphitic structure (37.4%), C–O (38.1%), and C
C) and a much lower proportional C–O content (11.7%) than the other samples. However, the C–O content and graphitic structure for SCG-NaU were 61.1% and 26.5%, respectively. SCG-K contained the most even distribution of content among graphitic structure (37.4%), C–O (38.1%), and C![[double bond, length as m-dash]](https://www.rsc.org/images/entities/char_e001.gif) O (24.5%). In the case of SCG-KU, the C–O content was increased to 61.0% by the addition of urea, whereas the graphitic structure and C
O (24.5%). In the case of SCG-KU, the C–O content was increased to 61.0% by the addition of urea, whereas the graphitic structure and C![[double bond, length as m-dash]](https://www.rsc.org/images/entities/char_e001.gif) O contents decreased to 21.1% and 17.9%, respectively.
O contents decreased to 21.1% and 17.9%, respectively.
| Samples | C–C or C![[double bond, length as m-dash]](https://www.rsc.org/images/entities/char_e001.gif) C (%) C (%) |
C–O (%) | O![[double bond, length as m-dash]](https://www.rsc.org/images/entities/char_e001.gif) C–OH (%) C–OH (%) |
|---|---|---|---|
| a Content values calculated from integrated peak areas after fitting. | |||
| SCG-Na | 49.2 | 11.7 | 39.1 |
| SCG-NaU | 26.5 | 61.1 | 12.3 |
| SCG-K | 37.4 | 38.1 | 24.5 |
| SCG-KU | 21.1 | 61.0 | 17.9 |
According to the XRD and Raman spectroscopy results, the SCG-NaU and SCG-KU samples possessed disordered structures. These structures were also confirmed by XPS to have reduced C![[double bond, length as m-dash]](https://www.rsc.org/images/entities/char_e001.gif) O contents and increased C–O contents with respect to the SCG-Na and SCG-K structures, respectively. These results may explain the observed greater porosity and surface area for these samples.10,35
O contents and increased C–O contents with respect to the SCG-Na and SCG-K structures, respectively. These results may explain the observed greater porosity and surface area for these samples.10,35
MB adsorption kinetics
Fig. 6(a) illustrates the kinetics of the adsorption of MB onto the SCG-derived carbon materials. SCG-KU was recorded as having the highest adsorption capacity for MB, as measured over 180 min (475.5 mg g−1), and this was followed by SCG-K (383.05 mg g−1), SCG-Na (144.1 mg g−1), and SCG-NaU (287.5 mg g−1). MB adsorption on the samples was found to be fast during the initial stages of the measurement (∼20 min). It then slowed down and began plateauing between 20 and 180 min, reaching equilibrium after approximately ∼160 min of contact time (Fig. S2†). Thus, in the beginning, adsorption occurs rapidly, thanks to an abundance of initially available adsorption sites, before decreasing with time until an equilibrium is reached. The remaining sites have obstacles to continuous adsorption due to repulsive forces between solute molecules on the solid and the bulk phase.28 The differences among the adsorption rates for the different carbon-material samples at the initial stage and their adsorption capacities are directly related to porosity (Fig. S3†), as verified by the nitrogen adsorption–desorption isotherm measurements for each sample.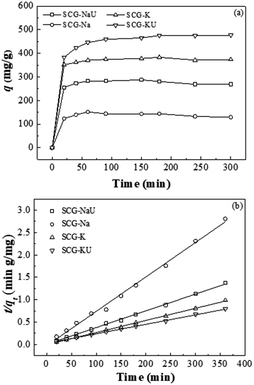 | ||
| Fig. 6 (a) Adsorption capacity curves and (b) pseudo-second-order kinetic model results for SCG-derived carbons (initial MB concentration: 200 mg L−1, adsorbent dosage: 300 mg L−1). | ||
Adsorption is a process of solute mass-transfer to the adsorbent surface. The MB adsorption processes were evaluated using different commonly used kinetic models, including the pseudo-first-order and pseudo-second-order models. In the kinetic study of MB adsorption on the samples, 200 mg L−1 was used for the initial concentration of MB, and the carbon material sample dosage was 300 mg L−1.
The following equations are used in the adsorption kinetics models. For the pseudo-first-order kinetics:
 | (7) |
 | (8) |
The pseudo-second-order model was found in this work to better represent the adsorption mechanism, and hence the results of this model are shown in Fig. 6(b). The adsorption parameters, including R2 and other constants, were calculated for both models and these are listed in Table 3. Using the pseudo-second-order kinetic model, the parameters were better fitted to the data for our samples. For example, the R2 value for the pseudo-second-order model fit for SCG-KU was 0.9992. The amount of MB adsorbed at equilibrium (qe) predicted by the model was 476.19 mg g−1, which is close to the experimental value (476.19 mg g−1). Even though the R2 value of the pseudo-first-order kinetic model fit for SCG-Na was 0.9946, other parameters predicted by this model were not in agreement with the experimental data. As all the sample adsorption mechanisms were found to possess pseudo-second-order kinetics, i.e., the MB molecules were chemisorbed on the adsorbent carbon materials, an adsorption mechanism based on valence bond formation between the adsorbate and adsorbent, via the sharing or exchange of electrons, is the logical conclusion.12 It is verified that, in this study, the carbon materials with larger surface areas contained a higher proportion of C–O and exhibited good adsorption performance (Fig. S4†).
| Pseudo-first order | Pseudo-second order | Expt. qe (mg g−1) | |||||
|---|---|---|---|---|---|---|---|
| K1 (min−1) | qe (mg g−1) | R2 | K1 (min−1) | qe (mg g−1) | R2 | ||
| SCG-Na | 0.0064 | 75.77 | 0.9946 | 0.00205 | 131.57 | 0.9976 | 151.72 |
| SCG-NaU | 0.0228 | 39.71 | 0.5615 | 0.00304 | 270.27 | 0.9955 | 287.87 |
| SCG-K | 0.0092 | 37.48 | 0.4264 | 0.00203 | 370.37 | 0.9991 | 383.05 |
| SCG-KU | 0.0149 | 209.07 | 0.9801 | 0.00016 | 476.19 | 0.9992 | 476.95 |
In addition, in previously published work, pseudo-second-order characteristics have been shown for activated carbon materials because of their microporous and mesoporous structures or thanks to various types of C–O and C![[double bond, length as m-dash]](https://www.rsc.org/images/entities/char_e001.gif) O bonding at their surfaces. As already mentioned, Oliveira et al. and Dia Y. et al. reported activated carbon materials fabricated from coffee waste with similar behaviors.16,20 As the adsorption capacities of carbon materials depend on surface area and porosity, as well as the organic molecule (mainly oxygen complexes at the surface) content, charge and hydrophobicity are expected to be critical. In our experiment, SCG-NaU and SCG-KU were assessed via XPS as having lower oxygen contents (O
O bonding at their surfaces. As already mentioned, Oliveira et al. and Dia Y. et al. reported activated carbon materials fabricated from coffee waste with similar behaviors.16,20 As the adsorption capacities of carbon materials depend on surface area and porosity, as well as the organic molecule (mainly oxygen complexes at the surface) content, charge and hydrophobicity are expected to be critical. In our experiment, SCG-NaU and SCG-KU were assessed via XPS as having lower oxygen contents (O![[double bond, length as m-dash]](https://www.rsc.org/images/entities/char_e001.gif) C–OH), which may correspond to a decrease in the hydrophobicity of these carbon materials. This also leads to H-bonding between water molecules and the surface, reducing the accessibility of the carbon surface for the adsorbate.37
C–OH), which may correspond to a decrease in the hydrophobicity of these carbon materials. This also leads to H-bonding between water molecules and the surface, reducing the accessibility of the carbon surface for the adsorbate.37
MB adsorption isotherms
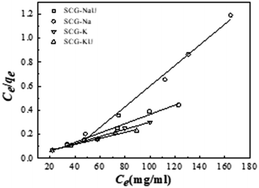
The equilibrium adsorption characteristics were analysed using Langmuir, Freundlich, and Temkin isotherm models and compared with measurements using different initial MB solution concentrations from 120 to 200 mg L−1. The data was recorded at various contact times, including 120 min, 140 min, 160 min, 180 min, and 200 min. Fig. 7 shows the Langmuir isotherm plots for the adsorption of MB onto the activated carbon materials. The isotherm plots also display the experimental data, and the calculation parameters are listed in Table 4.| Isotherm models | Parameters | Adsorbents | |||
|---|---|---|---|---|---|
| SCG-Na | SCG-NaU | SCG-K | SCG-KU | ||
| Langmuir | qm (mg g−1) | 116.28 | 256.41 | 333.33 | 400.00 |
| KL (L mg−1) | 0.033 | 0.183 | 0.833 | 0.172 | |
| RL | 0.130 | 0.026 | 0.006 | 0.028 | |
| R2 | 0.996 | 0.986 | 0.991 | 0.986 | |
| Freundlich | 1/n | 0.462 | 0.079 | 0.033 | 0.091 |
| KF (L mg−1) | 1480.59 | 397.38 | 286.69 | 245.97 | |
| R2 | 0.979 | 0.349 | 0.110 | 0.692 | |
| Temkin | A | 574.94 | 378.91 | 285.03 | 225.24 |
| B | 85.81 | 22.26 | 10.93 | 32.93 | |
| R2 | 0.989 | 0.351 | 0.106 | 0.677 | |
The Langmuir isotherm model can be described via the following equation:
 | (9) |
Observing the obtained coefficients, it is apparent that the Langmuir isotherm model provided a better fit for adsorption data compared to the other two isotherm models. The R2 value for the fit of the SCG-KU data to the Langmuir isotherm model was 0.986, which is higher and significantly closer to 1 than that for the fits to the data of the Freundlich and Temkin isotherm models, indicating excellent linearity. Thus, it can be concluded that the MB adsorbate molecules formed a homogeneous monolayer covering the activated carbon surface.38 Compared with the other materials, SCG-KU displayed excellent results for MB adsorption because of its large specific surface area, large pore volume, and ordered pore distribution. Thus, we can use the Langmuir isotherm model to calculate the possibility of adsorption on the adsorbent at a specific concentration, called a separation factor (RL), which is defined by the following equation:28
 | (10) |
Theoretically, if RL > 1, adsorption is unfavourable, if RL < 1, it is favourable, if RL = 1, it is linear, and if RL = 0, it is irreversible.39
Table 5 compares the MB adsorption capacities of various biowaste-derived adsorbents.10,16,18,39–47 As shown in the table, a higher adsorption capacity was measured for our carbon materials than some carbon materials reported in the literature. Chemical activators such as ZnCl2, KOH, FeCl3, K2CO3, and NaOH are widely used to prepare activated carbon materials from biowastes.39,40 Some researchers have obtained suitable adsorbents for organic dyes from SCG and biowastes. However, metallic activation techniques were used in these cases, and while such adsorbents have many advantages, their use could result in metallic contamination. This potential environmental problem that should be strongly avoided, even while seeking to solve the problem of organic dye pollution. Further, other researchers have derived adsorbents for organic dyes from biowastes using non-metallic chemical activation.18,46 The combining of non-metallic activators and other additional agents have not, however, thus far been employed in the impregnation or activation of carbon materials from coffee waste.
| Adsorbents | Activator | qm (mg g−1) | Ref. |
|---|---|---|---|
| SCG-K | KOH | 389.20 | (This work) |
| SCG-KU | KOH, urea | 499.90 | (This work) |
| Rattan sawdust activated carbon | KOH | 294.14 | 40 |
| H3PO4 activated carbon | H3PO4 | 159.90 | 41 |
| Palm fibre activated carbon | KOH | 277.78 | 42 |
| Pistachio shell | H3PO4 | 129.00 | 43 |
| Coffee-husk-derived activated carbon | FeCl3 | 263.00 | 16 |
| Activated carbon prepared from pea shell | ZnCl2 | 246.91 | 39 |
| Activated carbon prepared from hazelnut shell | ZnCl2 | 8.82 | 44 |
| SCG-derived porous carbon spheres | FeCl3 | 653.60 | 10 |
| Rice husk | — | 40.58 | 45 |
| Cornstalk biochar | KOH | 406.43 | 18 |
| Apricot kernel shell | KOH | 33.67 | 46 |
| Activated carbon from Jatropha seed husk | KOH | 250.00 | 47 |
In our work, new non-heavy-metallic activation techniques involving the combination of alkalis NaOH and KOH with urea were employed to obtain adsorbent carbon from coffee waste, to increase the effectiveness of MB adsorption from aqueous solution. Furthermore, in our approach, no additional contamination problems were observed after using the materials to isolate MB, thanks to the ease of recovery of the activated SCG material.
Effects of temperature and pH
The effect of temperature on the adsorption of MB was observed, as shown in Fig. 8(a); the adsorbed MB quotient was measured, after stirring at 150 rpm for a contact time of 240 min, using 50 mL of a solution containing 0.015 g of MB (dye concentration: 200 g L−1) and the adsorbent, at pH 6.00. In the range of 20 to 50 °C, the dye-adsorption capacity remained approximately constant. However, above 50 °C, the adsorption capacities of SCG-K and SCG-KU tended to increase with temperature (data not shown). The maximum adsorption capacities at 50 °C were determined to be 476.9 and 383.1 for SCG-KU and SCG-K, respectively. It is possible that at higher heating temperatures, e.g. 50 °C, some organic matter began to decompose, which might have been conducive to the formation of new pores.48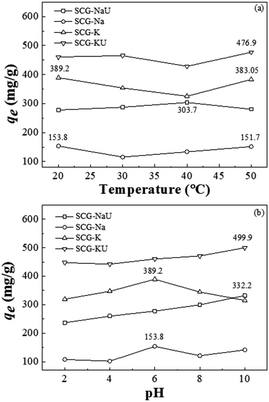 | ||
| Fig. 8 Effect of (a) temperature and (b) pH on MB adsorption capacity (initial MB concentration: 200 mg L−1, activated carbon material sample dosage: 300 mg L−1). | ||
In general, the pH of the solution can have a significant influence on adsorption processes. Such effects can occur via alterations of the surface charge of the absorbent and/or by the dissociation of functional groups of the adsorbent and/or organic dye molecules.28 Therefore, the effects of the initial pH of the MB solution on the adsorption of the activated carbon materials were investigated. Fig. 8(b) illustrates the effect of initial pH on the MB adsorption capacity of the SCG-derived carbon materials; the initial dye concentration was 200 mg L−1, the adsorbent dose was 300 mg L−1, the temperature was 20 °C, and a contact time of 240 min was used. The results for SCG-Na indicate that the adsorption capacity is less sensitive to variations in the initial pH of the MB solution. The equilibrium adsorbed MB quotient remains almost constant over the pH range of 2–10. KOH and NaOH activation resulted in the introduction of hydrophilic oxygen-containing functional groups—such as hydroxyl, carboxylic, and carbonyl groups—to the outer surfaces and defect sites of the SCG-derived carbon materials. The variation in MB adsorption capacity with pH was also due to the competition between cationic dyes and excess OH−/H+ ions in the solution. With the addition of OH−, more MB+ was adsorbed on the surface of the carbon adsorbent by electrostatic interactions.
Furthermore, other mechanisms, for example, π–π electron-donor–acceptor interactions or pore-filling mechanisms, might prove to be beneficial for adsorption in this case.49 As shown in Fig. 8(b), SCG-KU and SCG-NaU displayed increased adsorption capacity with pH; the maximum adsorbed MB quotients obtained, at pH 10, were 499.9 and 332.2 mg g−1, respectively. Interestingly, the adsorption capacity of SCG-K decreased as the pH increased in the range of 6–10, an effect that may result from the fact that the C–O content was significantly decreased when urea was not used during the activation process (Table 2).
Recovery characteristics of adsorbents
The recovery of SCG-KU and SCG-K was performed using 70% ethanol as eluent and thermal annealing at 800 °C; the maximum number of recovery cycles was five. The experimental results are shown in Fig. S5.† SCG-KU exhibited the maintenance of an adequate adsorption capacity (96.1%) after five recovery cycles; the value for SCG-K was slightly lower (94.2%).Carbon materials have significant advantages, including economic advantages as well as the fact that they are prepared from eco-friendly and reusable raw materials using a low-energy, low-toxicity preparation method; in addition, they are heavy-metal-free and have excellent adsorption capacities and recoverabilities. Thus, the combined use of urea and KOH as activation agents seems to be very important as a useful candidate for carbon material conversion from SCG with significant potential.
Conclusions
This work demonstrated heavy-metal-free carbon materials derived by pyrolysis at 800 °C from SCG via the use of new KOH–urea and NaOH–urea combined activation agents. The capabilities and properties of these new products were compared with those of SCG materials prepared by activation with a single KOH or NaOH activating agent. The combined KOH and urea synergistic activating agents produced various excellent properties for the carbon material, such as a high SBET value, large pore volume, high MB adsorption capacity, and excellent reusability. The MB adsorption process was found to fit a pseudo-second-order model, in which adsorption is dependent on adsorption-site availability. Equilibrium adsorbed MB quotient values were fitted to the Langmuir isotherm model, and hence it was demonstrated that monolayer coverage of activated carbons by MB molecules had occurred. The results of this work confirm our proposed method as an effective method for coffee waste recycling and heavy-metal-free carbon material preparation. Furthermore, the combined KOH and urea activation method has significant potential to obtain a highly effective adsorbent for MB dye in aqueous solutions with wide pH and temperatures ranges.Conflicts of interest
There are no conflicts to declare.Acknowledgements
This research was supported by the Basic Science Research Program (Grant No. 2015R1A5A1037548) of the National Research Foundation of Korea (NRF) and the Global Frontier Program through the Global Frontier Hybrid Interface Materials (GFHIM) project (Grant No. 2013M3A6B1078870), funded by the Ministry of Science, ICT & Future Planning of Korea (MSIP), as well as by the Technology Innovation Program (Grant No. 20013071, “Development of 4N grade palladium materialization technology including recovery, chemical making and plating process for high-end electronic devices from electronic parts scraps”), funded by the Ministry of Trade, Industry & Energy of Korea (MOTIE).References
- Statista, Coffee consumption worldwide from 2012/13 to 2017/18, https://www.statista.com/statistics/292595/global-coffee-consumption/, accessed, Jan. 22, 2020 Search PubMed.
- Yonhab, Korean coffee imports expected to contract this year, http://www.koreaherald.com/view.php?ud=20181209000017, accessed, Dec 9, 2018 Search PubMed.
- R. Campos-Vega, G. Loarca-Pina, H. A. Vergara-Castañeda and B. D. Oomah, Trends Food Sci. Technol., 2015, 45, 24–36 CrossRef CAS
.
- H. Jang, J. D. Ocon, S. Lee, J. K. Lee and J. Lee, J. Power Sources, 2015, 296, 433–439 CrossRef CAS
.
- T. E. Rufford, D. Hulicova-Jurcakova, E. Fiset, Z. Zhu and G. Q. Lu, Electrochem. Commun., 2009, 11, 974–977 CrossRef CAS
.
- C. Huang, T. Sun and D. Hulicova-Jurcakova, ChemSusChem, 2013, 6, 2330–2339 CrossRef CAS
.
- D. R. Vardon, B. R. Moser, W. Zheng, K. Witkin, R. L. Evangelista, T. J. Strathmann, K. Rajagopalan and B. K. Sharma, ACS Sustainable Chem. Eng., 2013, 1, 1286–1294 CrossRef CAS
.
- M. Haile, Biofuel Res. J., 2014, 1, 65–69 CrossRef CAS
.
- M. Sarno and M. Iuliano, Bioresour. Technol., 2018, 266, 431–438 CrossRef CAS
.
- X. Wen, H. Liu, L. Zhang, J. Zhang, C. Fu, X. Shi, X. Chen, E. Mijowska, M. J. Chen and D. Y. Wang, Bioresour. Technol., 2019, 272, 92–98 CrossRef CAS
.
- S.-H. Liu and Y.-Y. Huang, J. Cleaner Prod., 2018, 175, 354–360 CrossRef CAS
.
- T. Niu, J. Zhou, C. Zhang and S. Li, RSC Adv., 2018, 8, 26978–26986 RSC
.
- Y. Tang, Y. Zeng, T. Hu, Q. Zhou and Y. Peng, J. Environ. Chem. Eng., 2016, 4, 2900–2910 CrossRef CAS
.
- D. García-García, A. Carbonell, M. D. Samper, D. García-Sanoguera and R. Balart, Composites, Part B, 2015, 78, 256–265 CrossRef
.
- L. Panzella, P. Cerruti, V. Ambrogi, S. Agustin-Salazar, G. D'Errico, C. Carfagna, L. Goya, S. Ramos, M. A. Martín, A. Napolitano and M. d'Ischia, ACS Sustainable Chem. Eng., 2016, 4, 1169–1179 CrossRef CAS
.
- L. C. Oliveira, E. Pereira, I. R. Guimaraes, A. Vallone, M. Pereira, J. P. Mesquita and K. Sapag, J. Hazard. Mater., 2009, 165, 87–94 CrossRef CAS
.
- J. Ayala and B. Fernandez, Environ. Technol., 2019, 40, 2037–2051 CrossRef CAS
.
- L. Liu, Y. Li and S. Fan, Processes, 2019, 7, 891 CrossRef CAS
.
- D.-W. Lee, M.-H. Jin, D. Oh, S.-W. Lee and J.-S. Park, ACS Sustainable Chem. Eng., 2017, 5, 9935–9944 CrossRef CAS
.
- Y. Dai, D. Zhang and K. Zhang, J. Taiwan Inst. Chem. Eng., 2016, 68, 232–238 CrossRef CAS
.
- Y. S. Yun, M. H. Park, S. J. Hong, M. E. Lee, Y. W. Park and H.-J. Jin, ACS Appl. Mater. Interfaces, 2015, 7, 3684–3690 CrossRef CAS
.
- A. Ilnicka, J. P. Lukaszewicz, K. Shimanoe and M. Yuasa, J. Mater. Res., 2018, 33, 1612–1624 CrossRef CAS
.
- O. V. Kharissova, H. V. R. Dias, B. I. Kharisov, B. O. Pérez and V. M. J. Pérez, Trends Biotechnol., 2013, 31, 240–248 CrossRef CAS
.
- R. C. Bansal and M. Goyal, in Activated Carbon Adsorption, Taylor & Francis, Boca Raton, 2005, ch. 1, pp. 1–58 Search PubMed
.
- H. Marsh and F. Rodríguez-Reinoso, in Activated Carbon, ed. H. Marsh and F. Rodríguez-Reinoso, Elsevier Science Ltd, Oxford, 2006, ch. 4, pp. 143–242, DOI:10.1016/B978-008044463-5/50018-2
.
- K. Zou, Y. Deng, J. Chen, Y. Qian, Y. Yang, Y. Li and G. Chen, J. Power Sources, 2018, 378, 579–588 CrossRef CAS
.
- S. Wakeland, R. Martinez, J. K. Grey and C. C. Luhrs, Carbon, 2010, 48, 3463–3470 CrossRef CAS
.
- J. Ma, F. Yu, L. Zhou, L. Jin, M. Yang, J. Luan, Y. Tang, H. Fan, Z. Yuan and J. Chen, ACS Appl. Mater. Interfaces, 2012, 4, 5749–5760 CrossRef CAS
.
- P. M. Schaber, S. Higgins, D. Thielen, B. Anspach and J. Brauer, Thermochim. Acta, 2004, 424(1–2), 131–142 CrossRef CAS
.
- G. Lin, R. Ma, Y. Zhou, Q. Liu, X. Dong and J. Wang, Electrochim. Acta, 2018, 261, 49–57 CrossRef CAS
.
- E. Raymundo-Piñero, P. Azaïs, T. Cacciaguerra, D. Cazorla-Amorós, A. Linares-Solano and F. Béguin, Carbon, 2005, 43, 786–795 CrossRef
.
- M. A. Lillo-Ródenas, D. Cazorla-Amorós and A. Linares-Solano, Carbon, 2003, 41, 267–275 CrossRef
.
- D. Dadachanji, Uses of Potassium Hydroxide, https://sciencing.com/uses-potassium-hydroxide-5410923.html Search PubMed.
- A. C. Ferrari and J. Robertson, Phys. Rev. B: Condens. Matter Mater. Phys., 2000, 61, 14095–14107 CrossRef CAS
.
- T. Wei, X. Wei, Y. Gao and H. Li, Electrochim. Acta, 2015, 169, 186–194 CrossRef CAS
.
- Y. S. Ho and G. McKay, Chem. Eng. J., 1998, 70, 115–124 CrossRef CAS
.
- H.-P. Boehm, in Adsorption by Carbons, ed. E. J. Bottani and J. M. D. Tascón, Elsevier, Amsterdam, 2008, ch. 13, pp. 301–327, DOI:10.1016/B978-008044464-2.50017-1
.
- I. Langmuir, J. Am. Chem. Soc., 1918, 40, 1361–1403 CrossRef CAS
.
- Ü. Geçgel, G. Özcan and G. Ç. Gürpınar, J. Chem., 2013, 2013, 1–9 CrossRef
.
- B. H. Hameed, A. L. Ahmad and K. N. A. Latiff, Dyes Pigm., 2007, 75, 143–149 CrossRef CAS
.
- M. Danish, T. Ahmad, R. Hashim, N. Said, M. N. Akhtar, J. Mohamad-Saleh and O. Sulaiman, Surf. Interfaces, 2018, 11, 1–13 CrossRef CAS
.
- I. A. W. Tan, B. H. Hameed and A. L. Ahmad, Chem. Eng. J., 2007, 127, 111–119 CrossRef CAS
.
- A. A. Attia, B. S. Girgis and S. A. Khedr, J. Chem. Technol. Biotechnol., 2003, 78, 611–619 CrossRef CAS
.
- A. Aygün, S. Yenisoy-Karakaş and I. Duman, Microporous Mesoporous Mater., 2003, 66, 189–195 CrossRef
.
- V. Vadivelan and K. V. Kumar, J. Colloid Interface Sci., 2005, 286, 90–100 CrossRef CAS
.
- O. O. Namal and E. Kalipci, Int. J. Environ. Anal. Chem., 2019, 1–17, DOI:10.1080/03067319.2019.1656721
.
- F. A. Qaid, A. D. Azzahari, A. H. Yahaya and R. Yahya, Desalin. Water Treat., 2016, 57, 246–253 CAS
.
- X. Jiang, H. Xia, L. Zhang, J. Peng, S. Cheng, J. Shu, C. Li and Q. Zhang, Powder Technol., 2018, 338, 857–868 CrossRef CAS
.
- M. Rafatullah, O. Sulaiman, R. Hashim and A. Ahmad, J. Hazard. Mater., 2010, 177, 70–80 CrossRef CAS
.
Footnote |
| † Electronic supplementary information (ESI) available. See DOI: 10.1039/d0ra09550h |
| This journal is © The Royal Society of Chemistry 2021 |

