 Open Access Article
Optimizing the hydrophobicity of GDL to improve the fuel cell performance
Ke Zhou ab,
Tianya Li
 a,
Yufen Han
 c,
Jihao Wang
 c,
Jia Chen
 c and
Kejian Wang
 *a
*a
aCollege of Mechanical and Electrical Engineering, Beijing University of Chemical Technology, Beijing 100029, China. E-mail: 972128054@qq.com; wangkj@mail.buct.edu.cn
bJining University, Jining, Shandong 273155, China. E-mail: zhouke81@163.com
cCollege of Materials Science and Engineering, Beijing University of Chemical Technology, Beijing 100029, China. E-mail: hyf18995108@163.com; 18810310352@163.com; shanzha0416@163.com
First published on 7th January 2021
Abstract
The gas diffusion layer (GDL) is an important component in the proton exchange membrane fuel cell (PEMFC), and the main function of GDL is to transfer water and gas. This paper explores the effect of the gradient hydrophobicity of GDL on the proton exchange membrane fuel cell (PEMFC). The gradient GDL design uses two microporous layers (MPL). First, polytetrafluoroethylene (PTFE)![[thin space (1/6-em)]](https://www.rsc.org/images/entities/char_2009.gif) :
:![[thin space (1/6-em)]](https://www.rsc.org/images/entities/char_2009.gif) carbon black in MPL near the carbon paper side was fixed at 3
carbon black in MPL near the carbon paper side was fixed at 3![[thin space (1/6-em)]](https://www.rsc.org/images/entities/char_2009.gif) :
:![[thin space (1/6-em)]](https://www.rsc.org/images/entities/char_2009.gif) 7, and then the content of PTFE
7, and then the content of PTFE![[thin space (1/6-em)]](https://www.rsc.org/images/entities/char_2009.gif) :
:![[thin space (1/6-em)]](https://www.rsc.org/images/entities/char_2009.gif) carbon black in MPL near the catalyst layer (CL) was set to 3
carbon black in MPL near the catalyst layer (CL) was set to 3![[thin space (1/6-em)]](https://www.rsc.org/images/entities/char_2009.gif) :
:![[thin space (1/6-em)]](https://www.rsc.org/images/entities/char_2009.gif) 7, 2
7, 2![[thin space (1/6-em)]](https://www.rsc.org/images/entities/char_2009.gif) :
:![[thin space (1/6-em)]](https://www.rsc.org/images/entities/char_2009.gif) 8 and 1
8 and 1![[thin space (1/6-em)]](https://www.rsc.org/images/entities/char_2009.gif) :
:![[thin space (1/6-em)]](https://www.rsc.org/images/entities/char_2009.gif) 9. Second, the fixed PTFE
9. Second, the fixed PTFE![[thin space (1/6-em)]](https://www.rsc.org/images/entities/char_2009.gif) :
:![[thin space (1/6-em)]](https://www.rsc.org/images/entities/char_2009.gif) carbon black in MPL near the carbon paper side was 2
carbon black in MPL near the carbon paper side was 2![[thin space (1/6-em)]](https://www.rsc.org/images/entities/char_2009.gif) :
:![[thin space (1/6-em)]](https://www.rsc.org/images/entities/char_2009.gif) 8, and the PTFE
8, and the PTFE![[thin space (1/6-em)]](https://www.rsc.org/images/entities/char_2009.gif) :
:![[thin space (1/6-em)]](https://www.rsc.org/images/entities/char_2009.gif) carbon black in MPL near CL was 2
carbon black in MPL near CL was 2![[thin space (1/6-em)]](https://www.rsc.org/images/entities/char_2009.gif) :
:![[thin space (1/6-em)]](https://www.rsc.org/images/entities/char_2009.gif) 8 and 1
8 and 1![[thin space (1/6-em)]](https://www.rsc.org/images/entities/char_2009.gif) :
:![[thin space (1/6-em)]](https://www.rsc.org/images/entities/char_2009.gif) 9. We found that, when near the carbon paper side and PTFE
9. We found that, when near the carbon paper side and PTFE![[thin space (1/6-em)]](https://www.rsc.org/images/entities/char_2009.gif) :
:![[thin space (1/6-em)]](https://www.rsc.org/images/entities/char_2009.gif) carbon black = 3
carbon black = 3![[thin space (1/6-em)]](https://www.rsc.org/images/entities/char_2009.gif) :
:![[thin space (1/6-em)]](https://www.rsc.org/images/entities/char_2009.gif) 7, GDL can obtain good cell performance through gradient hydrophobic treatment. Moreover, when near the carbon paper side and PTFE
7, GDL can obtain good cell performance through gradient hydrophobic treatment. Moreover, when near the carbon paper side and PTFE![[thin space (1/6-em)]](https://www.rsc.org/images/entities/char_2009.gif) :
:![[thin space (1/6-em)]](https://www.rsc.org/images/entities/char_2009.gif) carbon black = 2
carbon black = 2![[thin space (1/6-em)]](https://www.rsc.org/images/entities/char_2009.gif) :
:![[thin space (1/6-em)]](https://www.rsc.org/images/entities/char_2009.gif) 8, the cell performance did not change much after GDL gradient hydrophobic treatment. We found that when GDL is subjected to a gradient hydrophobic treatment, the content of PTFE and carbon black must be rationally allocated to obtain good water management capabilities.
8, the cell performance did not change much after GDL gradient hydrophobic treatment. We found that when GDL is subjected to a gradient hydrophobic treatment, the content of PTFE and carbon black must be rationally allocated to obtain good water management capabilities.
1. Introduction
The proton exchange membrane fuel cell (PEMFC) uses hydrogen and air as fuel, which can achieve clean energy and provide greater power density.1,2 PEMFC mainly includes bipolar plates, gas diffusion layers (GDLs), catalyst layers (CLs), and proton exchange membranes (PEMs).3–5 CL provides a place for electrochemical reactions, and PEM can transfer protons generated by the anode CL.6 The above components are very important for PEMFC. The inappropriate design of PEMFC will impact its performance. For example, if PEM is thick, the proton transfer path will be prolonged. If PEM is thin, hydrogen leakage may occur due to a prolonged use; this is reflected in the polarization curve, in which the voltage in the ohmic control region drops faster. Moreover, the inappropriate distribution of Pt/C in CL will not only lead to a decrease in the electrochemically active area, but also accelerates the corrosion of Pt. As reflected in the polarization curve, the voltage in the activation control zone drops faster.GDL is mainly used to transfer gas and water, especially at high current density. The improper design of GDL will affect water transmission. If the water in cathode CL cannot be discharged, the catalytic effect of Pt will be affected and the fuel cannot reach cathode CL to participate in the reaction, which will eventually increase the mass transfer resistance and even cause the fuel cell to stop working.7 By designing GDL with a reasonable structure, the water management capabilities can be enhanced, and the voltage loss can be reduced.8–10
The GDL is a key component of water and gas management in PEMFC, and has been extensively studied and explored.11,12 In the current process of GDL research, the thickness, pore size, porosity, and hydrophobicity of GDL are mainly involved.
GDL will be compressed during the normal operation of the fuel cell. Studies have shown that the compression of GDL can reduce the gas permeability and contact resistance, thereby affecting the material transport ability of PEMFC.13 Given the aforementioned problems, the compression deformation of GDL can be controlled by adjusting the clamping force of the fixture.14 In terms of qualitative analysis of GDL thickness, GDL should have the best thickness range to improve PEMFC's water management capability.15
Changes in the GDL thickness are often accompanied by changes in the pore size, porosity, and other parameters;16,17 hence, the research on the GDL thickness should be considered comprehensively. The research on pore size and porosity is mainly to improve the water management ability by improving the pore size, and then adjust the gas transmission ability. If the pore size in GDL is too large, it will be conducive to the transmission of water. When water is filled in the pores of GDL, the gas transmission efficiency will be reduced, resulting in a decrease in the working efficiency of PEMFC. When the pore size in GDL is relatively small, the transmission pressure of water will increase. As the current density increases, more water will be produced. If the excess water cannot be removed from the PEMFC, it will cause flooding and eventually force the PEMFC to stop working.18–22 The distribution of the GDL pore size has an important practical significance for the transmission of water and gas, and it is also one of the hot spots of the current GDL research. When PEMFC is working, a certain amount of water will be generated at the contact between the cathode CL and GDL. When the current density is small, the water first flows into hydrophilic pores under the action of self-priming. When the current density is high, water is transported through hydrophobic pores under the action of capillary pressure.23–25 The current research on the gradient hydrophobicity of GDL, whether from simulation26 or experimental perspective,27 can conclude that GDL can improve the water management ability of PEMFC after gradient hydrophobic treatment. They only conducted related research and analysis under a certain ratio, and did not conduct a comprehensive analysis and discussion on the gradient hydrophobicity of GDL.28–31
This article tries to prepare GDL with a double microporous layer structure by spraying method to explore the effect of the gradient hydrophobic treatment of GDL on PEMFC performance. We also explored the PEMFC performance of the gradient hydrophobic GDL with different proportions, and in order to make the results more accurate, we performed repeated experiments on GDL to verify the stability of experimental data.
2. Materials and methods
2.1. Materials
Carbon paper (Japan Toray Group, TGP-H-060, Tokyo, Japan), anhydrous ethanol (Beijing Tongguang Fine Chemical Co., Ltd. China. Purity ≥99.7%, Beijing, China), carbon black (Cabot Corporation, Vulcan XC-72, Boston, USA), PTFE (Shanghai Aladdin Biochemical Technology Co., Ltd., 60 wt%, Shanghai, China), hydrochloric acid (Beijing Tongguang Fine Chemical Co., Ltd. Beijing, China), CaCO3 (Beijing Hongxing Chemical Plant, Beijing, China), GDL29BC (Japan Toray Group, Tokyo, Japan). All materials were used without further treatment.2.2. Methods
The external morphology of GDL was characterized by scanning electron microscopy (SEM, Hitachi S-4700, Tokyo, Japan). The tube furnace (TL 1200, Nanjing Boyuntong Instrument Technology Co., Ltd., Nanjing, China) was used to sinter the GDL. The water contact angle meter (TBU 90E, Germany DATA Physics Instrument Company, Filderstadt, Germany) was applied for the measurement of hydrophobic properties of GDL. The conductivity of GDL was tested by a four-probe conductivity tester (RTS-4, Guangzhou Four Probe Technology Co., Ltd. Guangzhou, China). A spray gun (K3, Taizhou Huangyan Ronghao Tools Co., Ltd., Taizhou, China) was used to spray the prepared solution. PEMFC test equipment (USA Scribner Associates, Inc., 850e, North Carolina, USA) were applied for measurement of the electrochemistry properties of GDL.3. GDL testing and preparation
3.1. PEMFC performance test
The electrochemical performance test of PEMFC was conducted under the following conditions: humidity levels of 100% and 60%, fuel cell temperature of 80 °C, oxygen: 0.02 L min−1 cm−2, hydrogen: 0.05 L min−1 cm−2. Pressure: no backpressure. Activation method: activation at 0.4 V for 2 h. The polarization curve test was carried out according to the procedure shown in Table 1.| Current density interval (A cm−2) | Increase or decrease in current density (A cm−2) | Residence time (min) |
|---|---|---|
| 0–0.064 | 0.008 | 1 |
| 0.08–0.4 | 0.080 | 2 |
| 0.5–max | 0.100 | 3 |
| Max–0.5 | 0.100 | 3 |
| 0.4–0.08 | 0.008 | 2 |
| 0.064–0 | 0.008 | 1 |
Subsequently, the hydrogen and oxygen pipelines were respectively connected to the gas channels preset on a graphite plate, and the gas outlet was connected to a safe exhaust port. The current collection circuit and voltage collection circuit were connected to the positive and negative electrodes of the single fuel cell, and the temperature-controlled thermocouple was inserted into the preset temperature measurement pore of the graphite plate. The single fuel cell assembly was then completed. The fuel used in the test was pure hydrogen and pure oxygen (99.995%), and the protective gas was Ar (99.995%) during the test.
After the system was stable, a H2/O2 constant current activation was used for 20 minutes and IV tests were run multiple times to activate the single cell. The single cell activation data is shown in the data “Hydrogen and Oxygen Activation-sc001”, and the H2 and O2 were maintained for 20 s before each cycle. It was scanned for about 30–40 circles. The entire activation process took more than 1.5 hours. After the polarization curve of PEMFC was stable, the activation of the fuel cell was finished. After activation, the IV was tested according to Table 1. The I–V and EIS experiments were tested at 80 °C and 68 °C, and attention was paid for a sufficient time in order for the system to reach a stable state after adjusting the temperature each time.
3.2. Preparation of GDL
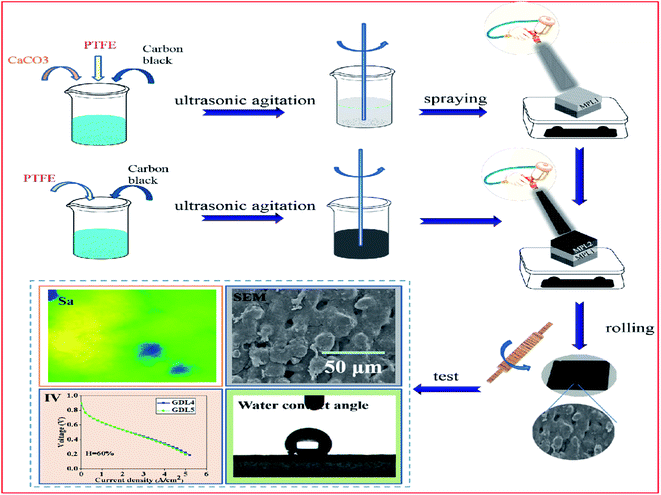
The preparation of GDL mainly includes the following 5 steps, and is shown in Fig. 1.(1) The carbon black is dispersed in an ethanol solution, and then the mixed solution is subjected to ultrasonic and magnetic stirring, respectively. The mixed solution was first magnetically stirred for 30 minutes and then sonicated for 30 minutes, and the above steps were repeated 4 times.
(2) Add an amount of CaCO3 to mixed solution, subject to ultrasonic treatment for 10 minutes, and then add PTFE for magnetic stirring operation.
(3) According to the different ratio of carbon black and PTFE, prepare another set of mixed solutions without CaCO3.
(4) Spray the mixed solution prepared in step 2 on carbon paper with a thickness of 35 μm, and then sequentially spray mixed solution prepared in step 3 with a thickness of 35 μm.
(5) The prepared sample was rolled to 240 μm and then placed in tube furnace for sintering. After sintering, put GDL into hydrochloric acid for 24 hours, rinse with deionized water, and dry it.
4. Results
4.1. Polarization curve test results
In the process of testing the polarization curve of PEMFC, the water generated in the fuel cell will increase as the current density increases. Hence, when the current density is small, the liquid phase pressure in PEMFC will be less than the gas phase pressure due to the relatively small amount of generated water. Although the gas phase pressure inside the fuel cell is basically the same, it can be understood that the capillary pressure is mainly affected by the liquid phase pressure. When the water produced is relatively small, liquid water cannot be transferred under the action of capillary pressure, and it is easier for water to enter the hydrophilic pores. So, the hydrophilic pores become a significant channel for liquid water transmission in the small current. As the current density increases, the content of liquid water produced also increases. At this time, the capillary pressure bears the driving force of water transmission, and the hydrophobic pores become an important transmission channel. If we consider both hydrophilic and hydrophobic pores when designing GDL, the material transfer resistance can be reduced regardless of low or high current density, thereby improving the PEMFC's water management ability.According to this analysis, we first prepared the PTFE![[thin space (1/6-em)]](https://www.rsc.org/images/entities/char_2009.gif) :
:![[thin space (1/6-em)]](https://www.rsc.org/images/entities/char_2009.gif) carbon black = 3
carbon black = 3![[thin space (1/6-em)]](https://www.rsc.org/images/entities/char_2009.gif) :
:![[thin space (1/6-em)]](https://www.rsc.org/images/entities/char_2009.gif) 7 (mass ratio) in MPL near the carbon paper side, and the mass ratio of PTFE
7 (mass ratio) in MPL near the carbon paper side, and the mass ratio of PTFE![[thin space (1/6-em)]](https://www.rsc.org/images/entities/char_2009.gif) :
:![[thin space (1/6-em)]](https://www.rsc.org/images/entities/char_2009.gif) carbon black in MPL near the catalyst layer side was varied at 3
carbon black in MPL near the catalyst layer side was varied at 3![[thin space (1/6-em)]](https://www.rsc.org/images/entities/char_2009.gif) :
:![[thin space (1/6-em)]](https://www.rsc.org/images/entities/char_2009.gif) 7, 2
7, 2![[thin space (1/6-em)]](https://www.rsc.org/images/entities/char_2009.gif) :
:![[thin space (1/6-em)]](https://www.rsc.org/images/entities/char_2009.gif) 8, and 1
8, and 1![[thin space (1/6-em)]](https://www.rsc.org/images/entities/char_2009.gif) :
:![[thin space (1/6-em)]](https://www.rsc.org/images/entities/char_2009.gif) 9. We defined the samples as, GDL1: 3
9. We defined the samples as, GDL1: 3![[thin space (1/6-em)]](https://www.rsc.org/images/entities/char_2009.gif) :
:![[thin space (1/6-em)]](https://www.rsc.org/images/entities/char_2009.gif) 7, 2
7, 2![[thin space (1/6-em)]](https://www.rsc.org/images/entities/char_2009.gif) :
:![[thin space (1/6-em)]](https://www.rsc.org/images/entities/char_2009.gif) 8; GDL2: 3
8; GDL2: 3![[thin space (1/6-em)]](https://www.rsc.org/images/entities/char_2009.gif) :
:![[thin space (1/6-em)]](https://www.rsc.org/images/entities/char_2009.gif) 7, 1
7, 1![[thin space (1/6-em)]](https://www.rsc.org/images/entities/char_2009.gif) :
:![[thin space (1/6-em)]](https://www.rsc.org/images/entities/char_2009.gif) 9; and GDL3: 3
9; and GDL3: 3![[thin space (1/6-em)]](https://www.rsc.org/images/entities/char_2009.gif) :
:![[thin space (1/6-em)]](https://www.rsc.org/images/entities/char_2009.gif) 7, 3
7, 3![[thin space (1/6-em)]](https://www.rsc.org/images/entities/char_2009.gif) :
:![[thin space (1/6-em)]](https://www.rsc.org/images/entities/char_2009.gif) 7.
7.
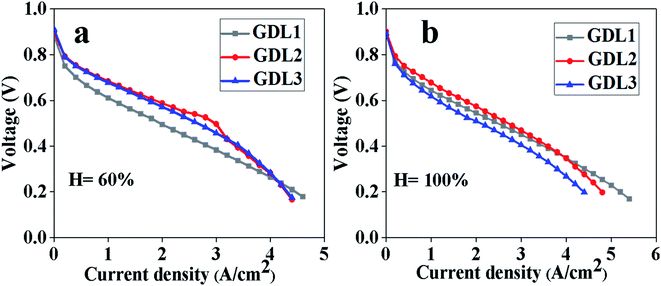
The polarization curve test results of the above three samples are shown in Fig. 2. We can see that when the humidity is 60% and current density is less than 3 A cm−2, GDL2 has a lower voltage loss. The reason for this phenomenon is that when the current density is small, the water content is relatively small, and the water first enters the hydrophilic pores, reducing the probability of Pt being covered by liquid water. Because the MPL with PTFE![[thin space (1/6-em)]](https://www.rsc.org/images/entities/char_2009.gif) :
:![[thin space (1/6-em)]](https://www.rsc.org/images/entities/char_2009.gif) carbon black = 1
carbon black = 1![[thin space (1/6-em)]](https://www.rsc.org/images/entities/char_2009.gif) :
:![[thin space (1/6-em)]](https://www.rsc.org/images/entities/char_2009.gif) 9 near the catalyst layer has relatively better hydrophilicity, there is a lower voltage loss for GDL2 at low current density. As the current density increases, the water generated inside the fuel cell will also increase. When excessive water is generated, water will be transported in both hydrophilic and hydrophobic pores. If there are too many hydrophilic pores in the MPL, it will cause a large number of water blocks in the hydrophilic pores and affect the gas transmission, which ultimately leads to an increase in voltage loss at high current density. Through the test results under a humidity level of 60%, we can see that GDL1 has the largest limiting current density. The reason for this is that compared with GDL2, GDL1 has more hydrophobic pores, which is beneficial to the transmission of water at high current density. By comparing GDL2 and GDL3, we can see that the voltage of GDL2 suddenly drops under high current density. The reason for this phenomenon is that there are relatively many more hydrophilic pores in GDL2, which makes it difficult for water to be discharged when filled into hydrophilic pores, which affects gas transmission.
9 near the catalyst layer has relatively better hydrophilicity, there is a lower voltage loss for GDL2 at low current density. As the current density increases, the water generated inside the fuel cell will also increase. When excessive water is generated, water will be transported in both hydrophilic and hydrophobic pores. If there are too many hydrophilic pores in the MPL, it will cause a large number of water blocks in the hydrophilic pores and affect the gas transmission, which ultimately leads to an increase in voltage loss at high current density. Through the test results under a humidity level of 60%, we can see that GDL1 has the largest limiting current density. The reason for this is that compared with GDL2, GDL1 has more hydrophobic pores, which is beneficial to the transmission of water at high current density. By comparing GDL2 and GDL3, we can see that the voltage of GDL2 suddenly drops under high current density. The reason for this phenomenon is that there are relatively many more hydrophilic pores in GDL2, which makes it difficult for water to be discharged when filled into hydrophilic pores, which affects gas transmission.
At 100% humidity, GDL2 can obtain good performance at low current density, medium current density and high current density, but the limiting current density compared with GDL1 is relatively low. The reason is that, on the one hand, the PTFE![[thin space (1/6-em)]](https://www.rsc.org/images/entities/char_2009.gif) :
:![[thin space (1/6-em)]](https://www.rsc.org/images/entities/char_2009.gif) carbon black = 1
carbon black = 1![[thin space (1/6-em)]](https://www.rsc.org/images/entities/char_2009.gif) :
:![[thin space (1/6-em)]](https://www.rsc.org/images/entities/char_2009.gif) 9 has relatively more hydrophilic pores, which can realize the rapid transmission of water at low current and medium current density without affecting the catalytic effect of Pt. On the other hand, the relative distribution of hydrophilic and hydrophobic pores of GDL2 is reasonable, so it has better performance under high current density. First, when the humidity level is 60% and 100%, the polarization curve was tested. From Fig. 2, we can see that when the humidity is 60%, the voltage of GDL2 at 3 A cm−2 is the largest, and at the same time, it has a larger limit current density. When the humidity is 100%, we can see that the voltage loss of GDL2 within 4 A cm−2 is relatively small, but the limiting current density is slightly smaller than that of GDL1. Second, by comparing the power density, we can see that GDL2 is the largest under the two humidity. Finally, when the humidity is 100%, the voltage loss of GDL2 at low current density is relatively small, which can indicate that the water produced by CL can be transmitted through the hydrophilic pores of GDL first to reduce the possibility of Pt being covered.
9 has relatively more hydrophilic pores, which can realize the rapid transmission of water at low current and medium current density without affecting the catalytic effect of Pt. On the other hand, the relative distribution of hydrophilic and hydrophobic pores of GDL2 is reasonable, so it has better performance under high current density. First, when the humidity level is 60% and 100%, the polarization curve was tested. From Fig. 2, we can see that when the humidity is 60%, the voltage of GDL2 at 3 A cm−2 is the largest, and at the same time, it has a larger limit current density. When the humidity is 100%, we can see that the voltage loss of GDL2 within 4 A cm−2 is relatively small, but the limiting current density is slightly smaller than that of GDL1. Second, by comparing the power density, we can see that GDL2 is the largest under the two humidity. Finally, when the humidity is 100%, the voltage loss of GDL2 at low current density is relatively small, which can indicate that the water produced by CL can be transmitted through the hydrophilic pores of GDL first to reduce the possibility of Pt being covered.
However, whether the humidity is 60% or 100%, GDL1 can obtain the maximum limiting current density. The reason is that more water is generated in the limiting current density area, and the rate of water generation is relatively fast, which will cause GDL2 to fail to discharge the water in time. Finally, the limiting current density of GDL1 is larger.
By comparing the polarization curve test results of GDL2 and GDL3, we can see that when the humidity is 60%, the two polarization curves in the low current density area overlap. When the current density is 2–3 A cm−2, GDL2 shows good cell performance. As the current density increases, GDL2 and GDL3 are basically in a state of coincidence. When the humidity is 100%, by comparing GDL2 and GDL3, we can see that the voltage loss of GDL2 is lower regardless of the low current density or high current density.
4.2. Analysis of power density test results
Fig. 3 shows the power density test results of GDLs at 60% and 100% humidity. From Fig. 3, it can be seen that GDL2 has maximum power density; the maximum power density of humidity 60% and 100% is 1.53 W cm−2 and 1.44 W cm−2, respectively. The GDL2 obtaining maximum power density at 60% humidity mainly depends on two reasons. On the one hand, when the current density is relatively small, the water generated near the catalyst layer can quickly enter the hydrophilic pores, and the liquid water in the hydrophilic pores can produce humidification for the gas, which makes GDL2 under low current density show good performance. On the other hand, when the current density is large, water will be transported in the hydrophilic and hydrophobic pores at the same time. Since the distribution of the hydrophilic and hydrophobic pores in GDL2 is more reasonable, a larger power density can be obtained. When the humidity is 100%, GDL2 can obtain a higher power density because the distribution of the hydrophilic and hydrophobic pores in GDL2 is relatively reasonable, so that water can be easily discharged at medium current density without affecting the catalytic effect of Pt.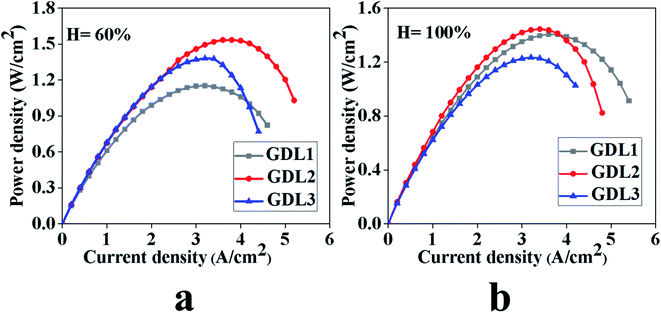 | ||
| Fig. 3 Test results of the power density under different humidity conditions. (a) Humidity 60%, (b) humidity 100%. | ||
When the humidity is 60%, the power peaks of GDL1, GDL2 and GDL3 are 1.15 W cm−2, 1.53 W cm−2, and 1.38 W cm−2, respectively. We can conclude that GDL2 has a larger power peak. When the humidity is 100%, the power peaks of GDL1, GDL2 and GDL3 are 1.40 W cm−2, 1.44 W cm−2, and 1.23 W cm−2, respectively. We can conclude that GDL2 has the largest power peak. We obtained similar experimental results with ref. 32. Therefore, we can conclude that the hydrophobic gradient treatment of GDL can improve the performance of the fuel cell.
4.3. Electrochemical impedance spectroscopy (EIS) test results
Fig. 4 shows the electrochemical impedance spectra (EIS) of the PEMFC when the current density is 2.5 A cm−2 and the humidity is 60% and 100%, respectively. Fig. 4a is the reaction model, Fig. 4b is the equivalent circuit, Fig. 4c is the EIS spectrum, and Fig. 4d is the test result of the samples. Through the equivalent circuit and the EIS spectrum, we can conclude that the impedance appears when the reaction in the high-frequency region is dominated by charge transfer. In the process of testing for EIS, the first intersection with the real axis is in the high-frequency region, so this point is the charge transfer impedance. Comparing the test results of EIS, we can see that the charge transfer resistance of GDL2 is lower than that of the other two samples when the humidity is 60% and 100%, respectively. The reason for this phenomenon is that the content of PTFE in GDL2 is relatively high. The internal resistance of GDL is relatively low, so that the charge transfer resistance of GDL2 is relatively lowest of the three samples. Through the equivalent circuit, we can see that the test results in the low-frequency region mainly reflect the material transmission loss. Through the test results, we can see that regardless of whether the humidity is 60% or 100%, the material transmission impedance from small to large is GDL1, GDL2, GDL3. We can see that the material transport capacity of PEMFC can be improved by performing a hydrophobic gradient treatment on GDL.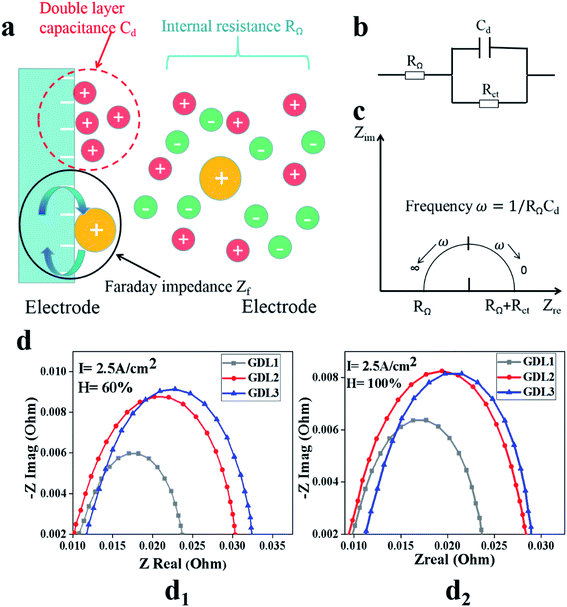 | ||
| Fig. 4 EIS schematic diagram and test results. (a) is the reaction model, (b) is the equivalent circuit, (c) is the EIS spectrum, and (d) is the test result of our samples. | ||
4.4. Water contact angle and roughness test results
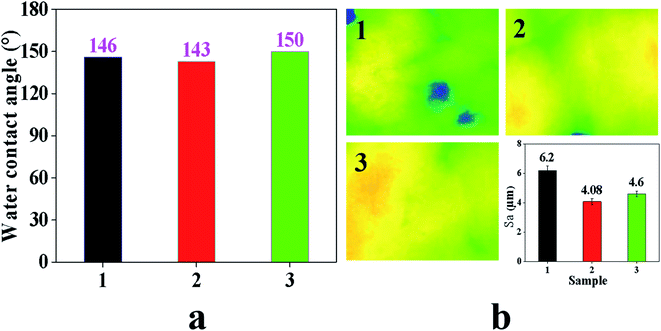
Fig. 5a and b are the test results of the water contact angle and roughness. We can see from Fig. 5a that as the PTFE content increases, the water contact angle shows an upward trend.By comparing the water contact angles of GDL1, GDL2 and GDL3 near the CL side, it can be seen that when the content of PFTE is 1 g, the water contact angle is 143°. When the content of PTFE is 2 g, the water contact angle is 146°. When the content of PTFE is 3 g, the water contact angle is 150°. As the content of PTFE increases, the water contact angle shows an upward trend. However, when the content of PTFE reaches a certain content, the hydrophobicity of GDL will not increase as PTFE increases. Too much PTFE may cause the GDL to block the pores. As a result, the gas transmission efficiency decreases.
From Fig. 5b, we can see that the roughness of the three samples' sizes is 6.2 μm, 4.08 μm and 4.6 μm. Compared with the sample thickness of 240 μm, the roughness is not particularly changed. The purpose of the water contact angle test is to investigate the effect of PTFE and carbon black on the hydrophilicity and hydrophobicity. The in-plane roughness of GDL will affect the contact resistance between GDL and CL. If the in-plane roughness of GDL is relatively large, the contact resistance between GDL and CL will be relatively large, and eventually reduce the open circuit voltage. The influence of the in-plane roughness on the PEMFC performance should be considered when studying the gradient hydrophobicity GDL on the PEMFC water management capabilities. The test results of the GDL in-plane roughness in this paper show that the three samples are consistent. Therefore, when investigating the influence of the GDL gradient hydrophobicity on the PEMFC water management ability, roughness is no longer considered.
4.5. SEM and in-plane resistivity test results
Fig. 6 shows the SEM and in-plane resistivity test results. From Fig. 6a, the homemade GDL is not flat and the surface has some pores, while the surface of GDL29BC is relatively flat. The difference in the surface morphology between the homemade GDL and GDL29BC is that the homemade GDL is prepared by spraying, and GDL29BC is prepared by roller coating. Fig. 6b is the test result of the in-plane resistivity. Fig. 6b shows that the resistivity of the three samples is 41.95 mΩ cm, 41.8 mΩ cm and 42.6 mΩ cm. The resistivity of the three samples is almost the same, so we can ignore the effect of resistivity when analyzing the gradient hydrophobic GDL on the PEMFC performance.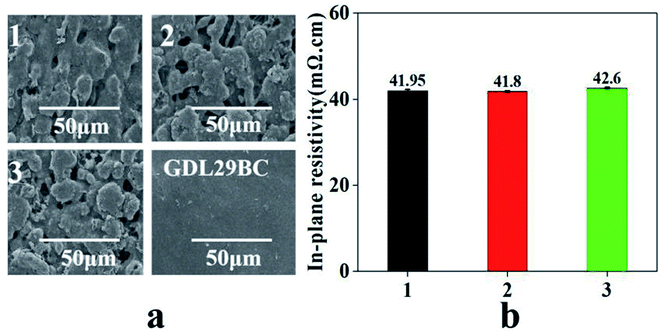 | ||
| Fig. 6 SEM and in-plane resistivity test results of different samples: (a) SEM test results, (b) in-plane resistivity test results. Samples 1, 2, and 3 represent GDL1, GDL2 and GDL3, respectively. | ||
Through studying the gradient hydrophobic GDL on the PEMFC water management ability, we can conclude that when the MPL near the carbon paper side PTFE![[thin space (1/6-em)]](https://www.rsc.org/images/entities/char_2009.gif) :
:![[thin space (1/6-em)]](https://www.rsc.org/images/entities/char_2009.gif) carbon black = 3
carbon black = 3![[thin space (1/6-em)]](https://www.rsc.org/images/entities/char_2009.gif) :
:![[thin space (1/6-em)]](https://www.rsc.org/images/entities/char_2009.gif) 7, the gradient hydrophobicity GDL does not show much of an advantage under 60% humidity when the current density is less than 3 A cm−2. When the current density is greater than 3 A cm−2, the voltage loss of the gradient hydrophobic GDL is relatively small. When the humidity is 100%, the results demonstrate that the gradient hydrophobic GDL can show good performance from low to high current density. The results also show that, after the hydrophobic gradient, the power density increases and the material transmission impedance decreases.
7, the gradient hydrophobicity GDL does not show much of an advantage under 60% humidity when the current density is less than 3 A cm−2. When the current density is greater than 3 A cm−2, the voltage loss of the gradient hydrophobic GDL is relatively small. When the humidity is 100%, the results demonstrate that the gradient hydrophobic GDL can show good performance from low to high current density. The results also show that, after the hydrophobic gradient, the power density increases and the material transmission impedance decreases.
4.6. Verification of the performance of PTFE and carbon black in other ratios
In order to further study the effect of the gradient hydrophobic GDL, we prepared MPL near the carbon paper side PTFE![[thin space (1/6-em)]](https://www.rsc.org/images/entities/char_2009.gif) :
:![[thin space (1/6-em)]](https://www.rsc.org/images/entities/char_2009.gif) carbon black = 2
carbon black = 2![[thin space (1/6-em)]](https://www.rsc.org/images/entities/char_2009.gif) :
:![[thin space (1/6-em)]](https://www.rsc.org/images/entities/char_2009.gif) 8, and the PTFE
8, and the PTFE![[thin space (1/6-em)]](https://www.rsc.org/images/entities/char_2009.gif) :
:![[thin space (1/6-em)]](https://www.rsc.org/images/entities/char_2009.gif) carbon black = 2
carbon black = 2![[thin space (1/6-em)]](https://www.rsc.org/images/entities/char_2009.gif) :
:![[thin space (1/6-em)]](https://www.rsc.org/images/entities/char_2009.gif) 8 and 1
8 and 1![[thin space (1/6-em)]](https://www.rsc.org/images/entities/char_2009.gif) :
:![[thin space (1/6-em)]](https://www.rsc.org/images/entities/char_2009.gif) 9 in MPL close to CL, respectively. We analyzed whether the gradient hydrophobic GDL would achieve the same conclusion as above when the content of PTFE and carbon black changed. We define the sample as GDL4: 2
9 in MPL close to CL, respectively. We analyzed whether the gradient hydrophobic GDL would achieve the same conclusion as above when the content of PTFE and carbon black changed. We define the sample as GDL4: 2![[thin space (1/6-em)]](https://www.rsc.org/images/entities/char_2009.gif) :
:![[thin space (1/6-em)]](https://www.rsc.org/images/entities/char_2009.gif) 8, 2
8, 2![[thin space (1/6-em)]](https://www.rsc.org/images/entities/char_2009.gif) :
:![[thin space (1/6-em)]](https://www.rsc.org/images/entities/char_2009.gif) 8 and GDL5: 2
8 and GDL5: 2![[thin space (1/6-em)]](https://www.rsc.org/images/entities/char_2009.gif) :
:![[thin space (1/6-em)]](https://www.rsc.org/images/entities/char_2009.gif) 8, 1
8, 1![[thin space (1/6-em)]](https://www.rsc.org/images/entities/char_2009.gif) :
:![[thin space (1/6-em)]](https://www.rsc.org/images/entities/char_2009.gif) 9.
9.
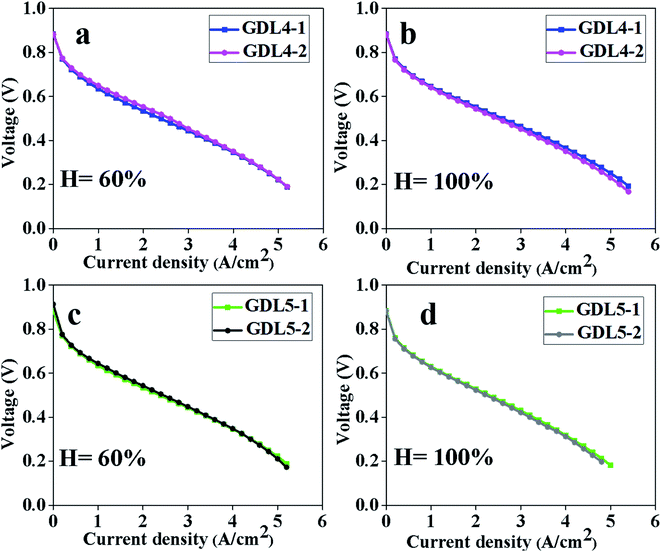
From Fig. 7, we can see that when the humidity is 60%, the polarization curves of the two samples overlap regardless of the low, medium, or high current density. Before and after the gradient hydrophobicity, the limiting current density of the two samples was 5.2 A cm−2 and 5.0 A cm−2, respectively.
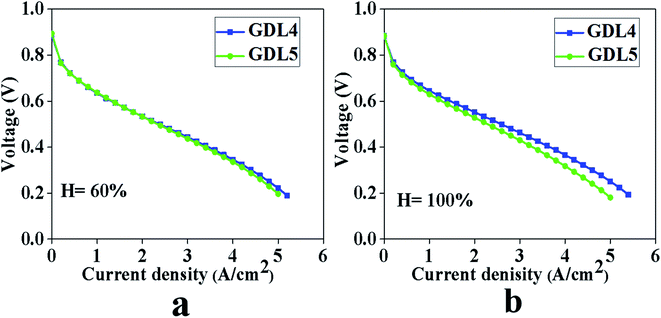 | ||
Fig. 7 Polarization curve test results of two samples, Pt loading of anode is 0.10 mg cm−2, the cathode is 0.10 mg cm−2. GDL4: 2![[thin space (1/6-em)]](https://www.rsc.org/images/entities/char_2009.gif) : :![[thin space (1/6-em)]](https://www.rsc.org/images/entities/char_2009.gif) 8, 2 8, 2![[thin space (1/6-em)]](https://www.rsc.org/images/entities/char_2009.gif) : :![[thin space (1/6-em)]](https://www.rsc.org/images/entities/char_2009.gif) 8; GDL5: 2 8; GDL5: 2![[thin space (1/6-em)]](https://www.rsc.org/images/entities/char_2009.gif) : :![[thin space (1/6-em)]](https://www.rsc.org/images/entities/char_2009.gif) 8, 1 8, 1![[thin space (1/6-em)]](https://www.rsc.org/images/entities/char_2009.gif) : :![[thin space (1/6-em)]](https://www.rsc.org/images/entities/char_2009.gif) 9. (a) Humidity 60%, (b) humidity 100%. 9. (a) Humidity 60%, (b) humidity 100%. | ||
When the humidity is 100%, it can be seen from Fig. 7 that at a low current density, the two GDL have the same impact on PEMFC. As the current density increases, GDL with gradient hydrophobic treatment did not show excellent cell performance. The limiting current densities of the samples before and after gradient hydrophobic treatment are 5.4 A cm−2 and 5.0 A cm−2, respectively. Through the above analysis, we conclude that GDL after hydrophobic gradient treatment does not get the results shown in Fig. 2.
The reason for this phenomenon is that when the humidity is 60% and in a low current density area, less water is generated on the surface of cathode CL, and will easily enter hydrophilic pores in MPL. Although the ratio of PTFE and carbon black in MPL close to CL has changed, GDL4 also have some hydrophilic pores, and these hydrophilic pores in GDL4 can meet the needs of water transmission.
As the current density increases, the water production of the cells will continue to increase. Although the MPL in GDL4 close to CL has relatively more hydrophobic pores when the humidity is 60%, both GDL4 and GDL5 can achieve good water management capabilities. When the humidity is 100%, GDL4 without the gradient hydrophobic treatment shows good water management. Since the sample PTFE![[thin space (1/6-em)]](https://www.rsc.org/images/entities/char_2009.gif) :
:![[thin space (1/6-em)]](https://www.rsc.org/images/entities/char_2009.gif) carbon black = 1
carbon black = 1![[thin space (1/6-em)]](https://www.rsc.org/images/entities/char_2009.gif) :
:![[thin space (1/6-em)]](https://www.rsc.org/images/entities/char_2009.gif) 9 in MPL close to CL has relatively more hydrophilic pores when water is filled in the hydrophilic pores, it will not be easily discharged. As a result, the hydrophobic pores undertake most of the task of water transmission. Water passes through the first MPL to the second MPL, and similarly, water will be transported in the hydrophilic and hydrophobic pores. Since the PTFE
9 in MPL close to CL has relatively more hydrophilic pores when water is filled in the hydrophilic pores, it will not be easily discharged. As a result, the hydrophobic pores undertake most of the task of water transmission. Water passes through the first MPL to the second MPL, and similarly, water will be transported in the hydrophilic and hydrophobic pores. Since the PTFE![[thin space (1/6-em)]](https://www.rsc.org/images/entities/char_2009.gif) :
:![[thin space (1/6-em)]](https://www.rsc.org/images/entities/char_2009.gif) carbon black = 2
carbon black = 2![[thin space (1/6-em)]](https://www.rsc.org/images/entities/char_2009.gif) :
:![[thin space (1/6-em)]](https://www.rsc.org/images/entities/char_2009.gif) 8 in MPL close to the carbon paper side has more hydrophilic pores, a large amount of water cannot be quickly discharged, so the water transmission channel is reduced, and the material transmission loss is eventually increased.
8 in MPL close to the carbon paper side has more hydrophilic pores, a large amount of water cannot be quickly discharged, so the water transmission channel is reduced, and the material transmission loss is eventually increased.
Fig. 8 compares the effects of the two MPLs on the power density when the PEMFC temperature is 80 °C, and the humidity is 60% and 100%. Fig. 8 shows that when the humidity is 60%, the power density of GDL4 without the gradient hydrophobic treatment is 1.40 W cm−2, and GDL5 with the gradient hydrophobic treatment is 1.36 W cm−2. When the humidity is 100%, the power density of GDL4 without the gradient hydrophobic treatment is 1.47 W cm−2, and GDL5 with the gradient hydrophobic treatment is 1.32 W cm−2. The GDL after gradient hydrophobic treatment does not increase significantly at 60% humidity. Furthermore, the GDL without gradient hydrophobic treatment exhibits better performance at 100% humidity. The reason is that more water is generated on the side of the cathode CL under a humidity level of 100%. The mismatch between the hydrophilic and hydrophobic pores of the two MPLs causes water to enter the hydrophilic pores and this cannot be easily removed, which eventually leads to the increase in the material transport resistance. Furthermore, it hinders GDL5 from improving the water management capabilities.
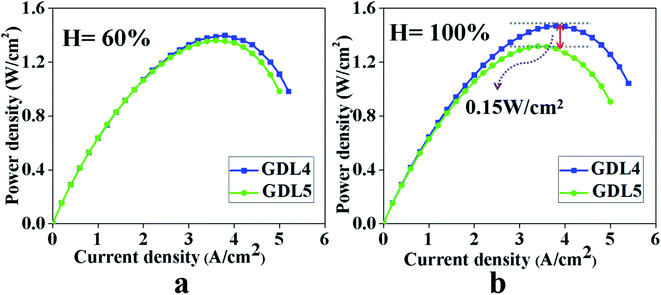 | ||
Fig. 8 Power density test results of two gas diffusion layers. GDL4: 2![[thin space (1/6-em)]](https://www.rsc.org/images/entities/char_2009.gif) : :![[thin space (1/6-em)]](https://www.rsc.org/images/entities/char_2009.gif) 8, 2 8, 2![[thin space (1/6-em)]](https://www.rsc.org/images/entities/char_2009.gif) : :![[thin space (1/6-em)]](https://www.rsc.org/images/entities/char_2009.gif) 8. GDL5: 2 8. GDL5: 2![[thin space (1/6-em)]](https://www.rsc.org/images/entities/char_2009.gif) : :![[thin space (1/6-em)]](https://www.rsc.org/images/entities/char_2009.gif) 8, 1 8, 1![[thin space (1/6-em)]](https://www.rsc.org/images/entities/char_2009.gif) : :![[thin space (1/6-em)]](https://www.rsc.org/images/entities/char_2009.gif) 9. (a) Humidity 60%, (b) humidity 100%. 9. (a) Humidity 60%, (b) humidity 100%. | ||
4.7. Repeat experiment
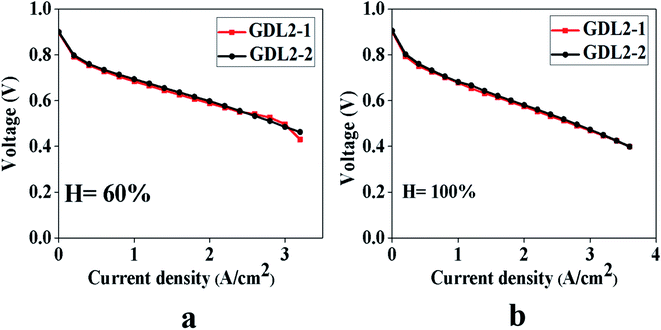
We conducted repeated experiments on GDL2, GDL4, and GDL5. The reason why we tested the polarization curve of GDL2 is that GDL2 can achieve the maximum power density when the humidity is 60% and 100%. Through the repeated experiments on GDL2 at humidity levels of 60% and 100%, we can see that GDL can show good stability (Fig. 9).The test results of GDL4 and GDL5 are shown in Fig. 10. Through test results of the two GDLs, we can see that both GDL4 and GDL5 show good stability. This proves that the commercial membrane electrode and the prepared GDL have good repeatability.
5. Conclusions
In this paper, GDL with double MPL was prepared. First, we explored PTFE![[thin space (1/6-em)]](https://www.rsc.org/images/entities/char_2009.gif) :
:![[thin space (1/6-em)]](https://www.rsc.org/images/entities/char_2009.gif) carbon black = 3
carbon black = 3![[thin space (1/6-em)]](https://www.rsc.org/images/entities/char_2009.gif) :
:![[thin space (1/6-em)]](https://www.rsc.org/images/entities/char_2009.gif) 7 in MPL near the carbon paper side, close to the CL side PTFE
7 in MPL near the carbon paper side, close to the CL side PTFE![[thin space (1/6-em)]](https://www.rsc.org/images/entities/char_2009.gif) :
:![[thin space (1/6-em)]](https://www.rsc.org/images/entities/char_2009.gif) carbon black = 3
carbon black = 3![[thin space (1/6-em)]](https://www.rsc.org/images/entities/char_2009.gif) :
:![[thin space (1/6-em)]](https://www.rsc.org/images/entities/char_2009.gif) 7, 2
7, 2![[thin space (1/6-em)]](https://www.rsc.org/images/entities/char_2009.gif) :
:![[thin space (1/6-em)]](https://www.rsc.org/images/entities/char_2009.gif) 8 and 1
8 and 1![[thin space (1/6-em)]](https://www.rsc.org/images/entities/char_2009.gif) :
:![[thin space (1/6-em)]](https://www.rsc.org/images/entities/char_2009.gif) 9. After the polarization curve, EIS and physical properties test, the results show that at 60% humidity, the sample near the CL side PTFE
9. After the polarization curve, EIS and physical properties test, the results show that at 60% humidity, the sample near the CL side PTFE![[thin space (1/6-em)]](https://www.rsc.org/images/entities/char_2009.gif) :
:![[thin space (1/6-em)]](https://www.rsc.org/images/entities/char_2009.gif) carbon black = 1
carbon black = 1![[thin space (1/6-em)]](https://www.rsc.org/images/entities/char_2009.gif) :
:![[thin space (1/6-em)]](https://www.rsc.org/images/entities/char_2009.gif) 9 has a lower voltage loss and the highest power density when the current density is less than 3 A cm−2. We also studied the effect of MPL near the carbon paper side PTFE
9 has a lower voltage loss and the highest power density when the current density is less than 3 A cm−2. We also studied the effect of MPL near the carbon paper side PTFE![[thin space (1/6-em)]](https://www.rsc.org/images/entities/char_2009.gif) :
:![[thin space (1/6-em)]](https://www.rsc.org/images/entities/char_2009.gif) carbon black = 2
carbon black = 2![[thin space (1/6-em)]](https://www.rsc.org/images/entities/char_2009.gif) :
:![[thin space (1/6-em)]](https://www.rsc.org/images/entities/char_2009.gif) 8 and MPL near the CL side PTFE
8 and MPL near the CL side PTFE![[thin space (1/6-em)]](https://www.rsc.org/images/entities/char_2009.gif) :
:![[thin space (1/6-em)]](https://www.rsc.org/images/entities/char_2009.gif) carbon black = 2
carbon black = 2![[thin space (1/6-em)]](https://www.rsc.org/images/entities/char_2009.gif) :
:![[thin space (1/6-em)]](https://www.rsc.org/images/entities/char_2009.gif) 8 and 1
8 and 1![[thin space (1/6-em)]](https://www.rsc.org/images/entities/char_2009.gif) :
:![[thin space (1/6-em)]](https://www.rsc.org/images/entities/char_2009.gif) 9. The results show that, at 60% humidity, before and after gradient hydrophobicity, the limiting current density of the two samples is 5.2 A cm−2 and 5.0 A cm−2, and the power density is 1.40 W cm−2 and 1.36 W cm−2. When the humidity is 100%, the limiting current density of the two samples is 5.4 A cm−2 and 5.0 A cm−2, and the power density is 1.47 W cm−2 and 1.32 W cm−2. So, we conclude that the gradient hydrophobic GDL did not show good PEMFC performance.
9. The results show that, at 60% humidity, before and after gradient hydrophobicity, the limiting current density of the two samples is 5.2 A cm−2 and 5.0 A cm−2, and the power density is 1.40 W cm−2 and 1.36 W cm−2. When the humidity is 100%, the limiting current density of the two samples is 5.4 A cm−2 and 5.0 A cm−2, and the power density is 1.47 W cm−2 and 1.32 W cm−2. So, we conclude that the gradient hydrophobic GDL did not show good PEMFC performance.
We can conclude that the proper gradient hydrophobic design of GDL can improve the water management ability. When PTFE![[thin space (1/6-em)]](https://www.rsc.org/images/entities/char_2009.gif) :
:![[thin space (1/6-em)]](https://www.rsc.org/images/entities/char_2009.gif) carbon black = 3
carbon black = 3![[thin space (1/6-em)]](https://www.rsc.org/images/entities/char_2009.gif) :
:![[thin space (1/6-em)]](https://www.rsc.org/images/entities/char_2009.gif) 7 in MPL near the carbon paper side, the limiting current density and power density both increase after gradient hydrophobic treatment. When the MPL near carbon paper side PTFE
7 in MPL near the carbon paper side, the limiting current density and power density both increase after gradient hydrophobic treatment. When the MPL near carbon paper side PTFE![[thin space (1/6-em)]](https://www.rsc.org/images/entities/char_2009.gif) :
:![[thin space (1/6-em)]](https://www.rsc.org/images/entities/char_2009.gif) carbon black = 2
carbon black = 2![[thin space (1/6-em)]](https://www.rsc.org/images/entities/char_2009.gif) :
:![[thin space (1/6-em)]](https://www.rsc.org/images/entities/char_2009.gif) 8, the gradient hydrophobic treatment of GDL will not improve the PEMFC performance. This is because too little content of PTFE is not suitable for the gradient hydrophobic treatment. Therefore, the ratio of PTFE and carbon black in the two MPLs should be fully considered when designing GDL.
8, the gradient hydrophobic treatment of GDL will not improve the PEMFC performance. This is because too little content of PTFE is not suitable for the gradient hydrophobic treatment. Therefore, the ratio of PTFE and carbon black in the two MPLs should be fully considered when designing GDL.
Author contributions
Methodology, T. L.; software, Y. H.; validation, K. W.; formal analysis, T. L.; investigation, K. Z.; resources, K. Z.; data curation, J. W.; writing-original draft preparation, T. L.; writing-review and editing, T. L. and K. Z.; visualization, J. C.; supervision, K. W.; project administration, K. Z.; funding acquisition, K. Z. All authors have read and agreed to the published version of the manuscript.Conflicts of interest
There are no conflicts to declare.Notes and references
- V. Hirpara, V. Patel, Y. Z. Zhang and R. Anderson, Int. J. Hydrogen Energy, 2020, 45, 14145–14155 CrossRef CAS
.
- S. Latorrata, M. Sansotera, M. Gola and P. G. Stampino, Fuel Cells, 2020, 20, 166–175 CrossRef CAS
.
- X. Zhou, L. Wu, Z. Niu and Z. Bao, Int. J. Heat Mass Transfer, 2020, 151, 119370 CrossRef CAS
.
- N. Dyantyi, A. Parsons, O. Barron and S. Pasupathi, J. Power Sources, 2020, 451, 227779 CrossRef CAS
.
- X. Zhang, Y. Yang, X. Zhang and H. Liu, J. Power Sources, 2020, 449, 227580 CrossRef CAS
.
- D. Jiao, K. Jiao, Z. Niu, S. Zhong and Q. Du, Int. J. Energy Res., 2020, 44, 4438–4448 CrossRef CAS
.
- X. Yan, C. Lin, Z. Zheng and J. Chen, Appl. Energy, 2020, 258, 114073 CrossRef
.
- S. Hou, Y. Ye, S. Liao and J. Ren, Int. J. Hydrogen Energy, 2020, 45, 937–944 CrossRef CAS
.
- R. Lin, X. Diao, T. Ma and S. Tang, Appl. Energy, 2020, 274, 1–5 CrossRef
.
- D. G. Kang, D. K. Shin, S. Kim and M. S. Kim, Renewable Energy, 2019, 141, 669–677 CrossRef CAS
.
- R. Sandstrom, J. Ekspong and A. Annamalai, RSC Adv., 2020, 8, 41566–41574 RSC
.
- H. F. Lee, J. Y. Chang and Y. W. Chen-Yang, RSC Adv., 2018, 8, 22506–22514 RSC
.
- I. Nitta, T. Hottinen, O. Himanen and M. Mikkola, J. Power Sources, 2007, 171, 26–36 CrossRef CAS
.
- P. Zhou and C. W. Wu, J. Power Sources, 2007, 170, 93–100 CrossRef CAS
.
- C. J. Tseng and S. K. Lo, Energy Convers. Manage., 2010, 51, 677–684 CrossRef CAS
.
- L. Cindrella, A. M. Kannan and J. F. Lin, J. Power Sources, 2009, 194, 146–190 CrossRef CAS
.
- M. Han, J. H. Xu, S. H. Chan and S. P. Jiang, Electrochim. Acta, 2008, 53, 5361–5367 CrossRef CAS
.
- G. Inoue, T. Yoshimoto, Y. Matsukuma and M. Minemoto, J. Power Sources, 2008, 175, 145–158 CrossRef CAS
.
- J. Park, H. Oh, Y. I. Lee and K. Min, Appl. Energy, 2016, 171, 200–212 CrossRef
.
- R. Wu, X. Zhu and Q. A. Liao, Int. J. Hydrogen Energy, 2010, 17, 9134–9143 CrossRef
.
- Y. Ji, G. Luo and C. Y. Wang, J. Electrochem. Soc., 2010, 157, B1753–B1761 CrossRef CAS
.
- V. S. Velan, G. Velayutham, N. Rajalakshmi and K. S. Dhathathreyan, Int. J. Hydrogen Energy, 2014, 39, 1752–1759 CrossRef
.
- T. Chen, S. H. Liu, J. W. Zhang and M. N. Tang, Int. J. Heat Mass Transfer, 2019, 128, 1168–1176 CrossRef CAS
.
- R. Omrani and B. Shabani, Int. J. Hydrogen Energy, 2017, 42, 28515–28536 CrossRef CAS
.
- T. Arlt, M. Klages and M. Messerschmidt, Energy, 2017, 118, 502–511 CrossRef CAS
.
- R. Vijay, S. K. Seshadri and P. Haridoss, Trans. Indian Inst. Met., 2011, 6, 175–179 CrossRef
.
- S. Malhotra and S. Gnash, J. Fluids Eng., 2018, 140, 1–9 CrossRef
.
- D. Ko, S. Doh, H. S. Park and M. H. Kim, Int. J. Hydrogen Energy, 2018, 43, 2369–2380 CrossRef CAS
.
- H. H. Lin, C. H. Cheng, C. Y. Soong and F. Chen, J. Power Sources, 2006, 162, 246–254 CrossRef CAS
.
- T. Fabian, R. O'Hayre, F. B. Prinz and J. G. Santiago, J. Electrochem. Soc., 2007, 154, B910–B918 CrossRef CAS
.
- R. Lin, X. Y. Diao, T. C. Ma and S. H. Tang, Appl. Energy, 2019, 254, 1–9 CrossRef
.
- O. Reza and S. Bahman, Int. J. Hydrogen Energy, 2017, 42, 28515–28536 CrossRef
.
| This journal is © The Royal Society of Chemistry 2021 |

