 Open Access Article
A comparative electrochemical study of non-enzymatic glucose, ascorbic acid, and albumin detection by using a ternary mesoporous metal oxide (ZrO2, SiO2 and In2O3) modified graphene composite based biosensor
Kamrun Nahar Fatemaa and
Won-Chun Oh *ab
*ab
aDepartment of Advanced Materials Science & Engineering, Hanseo University, Seosan-si, Chungnam, Korea 356-706. E-mail: wc_oh@hanseo.ac.kr; Fax: +82-41-688-3352; Tel: +82-41-660-1337
bCollege of Materials Science and Engineering, Anhui University of Science & Technology, Huainan 232001, PR China
First published on 22nd January 2021
Abstract
In this study, we present an electrochemical investigation of a ternary mesoporous metal oxide (ZrO2, SiO2 and In2O3) modified graphene composite for non-enzymatic glucose, ascorbic acid, and albumin detection in urine at physiological pH. Synergetic property of ZrO2–Ag–G–SiO2 and In2O3–G–SiO2 were investigated via cyclic voltammetry (CV) using FTO glass and copper-foil electrodes with no prerequisite of solid antacid expansion. The mesoporous ZrO2–Ag–G–SiO2 and In2O3–G–SiO2 composites were synthesized and characterized using XRD, SEM, TEM, Raman spectroscopy, XPS, DRS, BET, and photocurrent measurements. Upon increasing the glucose concentration from 0 to 3 mM, CV results indicated two anodic peaks at +0.18 V and +0.42 V versus Ag/AgCl, corresponding to Zr3+ and Zr4+, respectively, considering the presence of glucose in urine. Moreover, the effects of high surface area In2O3–G–SiO2 were observed upon the examination of ZrO2–Ag–G–SiO2. In2O3–G–SiO2 demonstrated a decent electrochemical pattern in glucose, ascorbic acid, and albumin sensing. Nevertheless, insignificant synergistic effects were observed in In2O3-G, ZrO2-G, and ZrO2–G–SiO2. In2O3–G–SiO2 performed well under a wide range of electrolytes and urine, and showed no activity toward uric acid, suggesting potential for biodetection in urine.
1. Introduction
Diabetes mellitus has become a universally critical health challenge that has caused other non-transferable sicknesses and complications such as cardiovascular illness, stroke, and chronic kidney failure.1 Non-obtrusive glucose and microalbumin estimation has largely improved the treatment viability and preventive measures. For simple glucose level determination, an assessment of glucose in urine can be a decent marker,2–5 as glucose is released in the body because of kidney failure, endocrine issues, and hyperglycemia. Recent improvements in non-enzymatic glucose detection has overcome the restrictions of traditional chemical-based glucose sensors, influenced by humidity, pH, protein denaturation, poor reproducibility, and significant manufacturing cost.6 According to Pletcher,7 the working of a non-enzymatic glucose sensor involves the chemisorption of hydroxyl ions onto a metal substrate, permitting a bond formation between the d-electrons of the metal and glucose. Accordingly, a difference in the oxidation state of glucose molecules adsorbed onto the metal surface leads to a difference in the metal–glucose complex, lowering the quality of the glucose–metal bond and in turn lowering the desorption rate of glucose molecules.6–8 The impersonating cycle of metals and metal oxides, such as Au, Cu, Pt, Ni etc.,9–18 have been accounted by the direct electrochemical oxidation of glucose and electron move. Among these metals, ZrO2 based substrates have been considered as the best because of their ease of production, high strength, and excellent synergistic properties. ZrO2 is one of the metal oxides with oxidizable and reducible sites. ZrO2 is an n-type semiconductor with a bandgap of 5.12 eV.19 Subsequently, the modification of ZrO2 with other supporting materials, such as graphene oxide and/or another p-type semiconductor, is a promising way to achieve the above-mentioned objectives, particularly enhancing its synergistic properties.Graphene-based metal oxide materials have remarkable applications in various fields. Furthermore, the oxygen-containing-functional groups of graphene oxide act as a stabilizer for the metal-nanoparticles and prevent their aggregation. However, despite the high reaction kinetics and electron transfer, activity in highly alkaline conditions is insignificant for the vast majority of physiological samples. A powerful technique for enhancing the performance of graphene is to improve the electron-donating capacity, charge/discharge capacity, and resistance of graphene.20
Mesoporous silica, made of silica aerogel, has been used as a substrate material, adsorbent, and thermal insulator. In the field of catalysis, it can provide a high density of surface area to be used as an adsorbent.21 The main reason for the progress of graphene-based metal oxide photocatalysts is that carbon material (graphene) can influence the rate at which photogenerated electrons relocate from the metal oxide to graphene and reduce the electron–hole recombination.22 The combination of the stability of ZrO2 and high-surface area of mesoporous SiO2 with graphene can lead to enhanced reaction kinetics.
Ascorbic acid (AA, nutrient C) is an exceptionally huge bioactive compound and a water-soluble nutrient that cannot be synthesized by the human body, and should, therefore, be introduced through daily diet. Ascorbic acid is added to a few drug formulations to boost injury recovery23 and to prevent or cure some diseases, such as scurvy,24 normal cold,25 and hyphema.26 Moreover, AA is the most unstable nutrient in food, especially products of the soil, and its decomposition leads to a decline in the wholesome food quality.27 Accordingly, a detection strategy that allows a fast, simple, and sensitive detection of AA would be significant in various fields, especially in medicine and the food industry.
In this work, we studied mesoporous ZrO2–Ag–G–SiO2 and In2O3–G–SiO2 substrates without precedent for non-commercial urine and PBS. We carried out experiments to determine the direct correlation of the electrocatalytic characteristics of ZrO2–Ag–G–SiO2 and In2O3–G–SiO2. The analyses were performed using FTO glass and copper foil electrodes via cyclic voltammetry (CV) to obtain the reaction mechanism. Moreover, the effects of carbon framework, such as graphene (G), on ZrO2 and In2O3 were assessed in both basic and neutral pH conditions. Also, the morphological, physical, and chemical properties of ZrO2–Ag–G–SiO2 and In2O3–G–SiO2 were studied. In general, ZrO2–Ag–G–SiO2 and In2O3–G–SiO2 exhibited an excellent performance in inert media without any electron donor, indicating further progress for basic glucose, albumin, and ascorbic acid determination in urine.
2. Experimental section
2.1. Materials
All chemical reagents of analytical grade were used without further purification. Graphite powder flakes (>99.99 wt%), zirconium(IV) propoxide (C12H28O4Zr, 70 wt% in 1- propanol), and Pluronic F127 (EO106PO70EO106) were procured from Sigma-Aldrich; InCl3 indium(III) chloride, urea, SDBS – sodium dodecyl benzene sulphonate, and tetraethyl orthosilicate (TEOS, Acros Organics) were procured from Samchun Pure Chemical Co Ltd. Ethylene glycol (C2H6O2, 99.5%) was purchased from Duksan Pure Chemicals Co. Ltd., Korea; hydrochloric acid (HCl) was purchased from Dae-Jung Chemical Co. Ltd., Korea. Deionized water (18.2 MΩ cm−1) was used in all the experiments.2.2. Characterization
The phases of the samples were examined using X-ray diffraction measurements (SHIMADZU XRD-6000) equipped with a Cu Kα X-ray source (1.5406 Å). The Debye–Scherrer equation (eqn (1)) was used to determine the particle size of ZrO2 and SiO2, based on the data acquired via XRD analysis.17
L = Kλ/(FWHM)cos![[thin space (1/6-em)]](https://www.rsc.org/images/entities/char_2009.gif) θ; [d = 0.9λ/β θ; [d = 0.9λ/β![[thin space (1/6-em)]](https://www.rsc.org/images/entities/char_2009.gif) cos cos![[thin space (1/6-em)]](https://www.rsc.org/images/entities/char_2009.gif) θ] θ]
| (1) |
2.3 Electrode preparation and measurements
In2O3–G–SiO2 and ZrO2–Ag–G–SiO2 thin films were prepared using a conventional atomic layer deposition technique.29 In2O3, IG, mesoporous IGS10, and IGS20 individually were ground with ethyl cellulose and PVDF in an agate mortar to form a gas detecting paste. The paste was coated on a substrate by applying a physical coating method and it is important that the paste evenly applied on the surface. The as-prepared coated-substrate put into an electric oven and dried at 100 ° C for 3 h. The paste was coated manually via a physical coating method. The thickness of the coating was 0.1, 0.3, and 0.5 mm, and all the samples had uniform thickness and measurements. An electrochemical cell was used in voltammetry with three electrodes: a working electrode (WE), reference electrode (RE), counter electrode (CE). A cyclic low potential excitation signal was applied between the working electrode and the reference electrode and the current flowing between the working and reference electrodes was estimated. The current peaks were obtained at a specific voltage region, due to the specific redox potentials running on the working terminal. The reference electrode was used for the analysis of the Cyclic Voltammetry (CV). The signal conditioning stage applied time-dependent potential between the working and reference electrodes, and converted the current flowing between the working and reference electrodes into a voltage signal.3. Result and discussion
3.1. Material characterizations
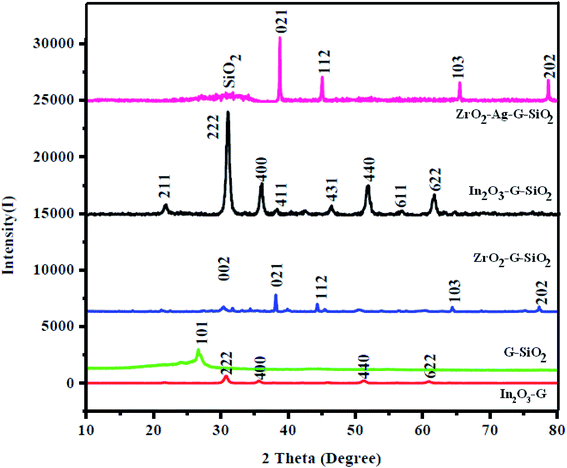
Fig. 1 shows the XRD patterns of ZrO2–GO, GO–SiO2, and ZrO2–GO–SiO2 nanocomposites, and the pattern essentially shows the structural phases of all materials studied. The main (green colored) peak presents the XRD pattern of ZrO2–GO nanocomposites, which correspond to the two crystalline phases, monoclinic (a = 5.1477 Å, b = 5.2096 Å, c = 5.3164 Å) and tetragonal (a = 3.5781 Å, c = 5.1623 Å), and the reference numbers are JCPDS no. 78-0047, and no. 88-1007.18 The peaks were located at 30.63, 35.49, 50.84, 60.46° 2θ assigned to the (002), (101), (102), and (103) planes, respectively, and this result suggested a base-centered monoclinic structured ZrO2. And the other diffraction peaks corresponded to the tetragonal structured ZrO2. The diffraction peak ratio between tetragonal and monoclinic was 7![[thin space (1/6-em)]](https://www.rsc.org/images/entities/char_2009.gif) :
:![[thin space (1/6-em)]](https://www.rsc.org/images/entities/char_2009.gif) 3. The subsequent pattern (orange colored) presents the XRD data of GO–SiO2 nanocomposites; this pattern demonstrated a sharp and wide peak, which was situated at a 2θ of 26.62°. The last pattern (wine colored) presents the XRD of the ternary ZrO2–GO–SiO2 composite. All the characteristic peaks were present, which were allocated to ZrO2, SiO2, and graphene. Also, the XRD pattern of the ternary composite had a new peak, implying that ZrO2 and mesoporous SiO2 undergo slight structural changes to give another XRD peak. The XRD pattern of the binary composite did not show the diffraction peaks of the graphitic material because of the exceptionally low amounts. Furthermore, the XRD results affirmed that mesoporous SiO2 is effectively attached to GO and ZrO2 nanocomposite; additionally, the arrangement strategy is demonstrated to be the best possible combination cycle of the material. We used the Debye–Scherrer formula to assess the crystallite size of ZrO2 and SiO2 particles and discovered them to be 72 and 15 nm, respectively.
3. The subsequent pattern (orange colored) presents the XRD data of GO–SiO2 nanocomposites; this pattern demonstrated a sharp and wide peak, which was situated at a 2θ of 26.62°. The last pattern (wine colored) presents the XRD of the ternary ZrO2–GO–SiO2 composite. All the characteristic peaks were present, which were allocated to ZrO2, SiO2, and graphene. Also, the XRD pattern of the ternary composite had a new peak, implying that ZrO2 and mesoporous SiO2 undergo slight structural changes to give another XRD peak. The XRD pattern of the binary composite did not show the diffraction peaks of the graphitic material because of the exceptionally low amounts. Furthermore, the XRD results affirmed that mesoporous SiO2 is effectively attached to GO and ZrO2 nanocomposite; additionally, the arrangement strategy is demonstrated to be the best possible combination cycle of the material. We used the Debye–Scherrer formula to assess the crystallite size of ZrO2 and SiO2 particles and discovered them to be 72 and 15 nm, respectively.
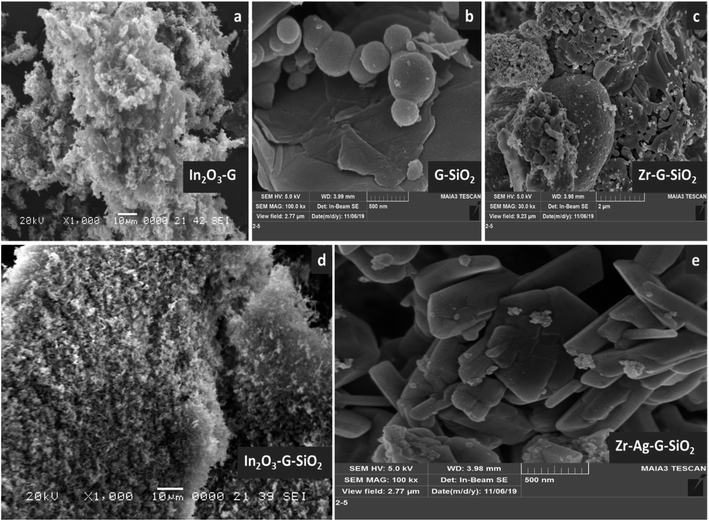
Fig. 2 presents the overall morphology of the as-obtained binary and ternary composites investigated through SEM examination. As shown in Fig. 2(a, b) and (c–e), from the SEM investigation of the consequent GO–SiO2 and ZrO2–GO double composite, the unpredictable 3D cubic ZrO2 and spherical SiO2 were consistently dispersed onto the graphene surface. The normal particle size of ZrO2 was 55.04 nm, and the diameter of SiO2 was 280.21 nm.19 Fig. 2(e) shows that the growth of metal oxide and silica oxide completely covered the whole surface of graphene. The primary oxide compound shape was not changed; however, the size of silica oxide was diminished after adsorption onto the graphene surface. The principle function of graphene was to provide sufficient area of nanocomposite that can be developed and spread (attached) on the surface during the combination cycle. Moreover, graphene forms a covalent bond with the precursors through oxygen-containing functional groups. The results of SEM demonstrated the differences between the paired and ternary composite.
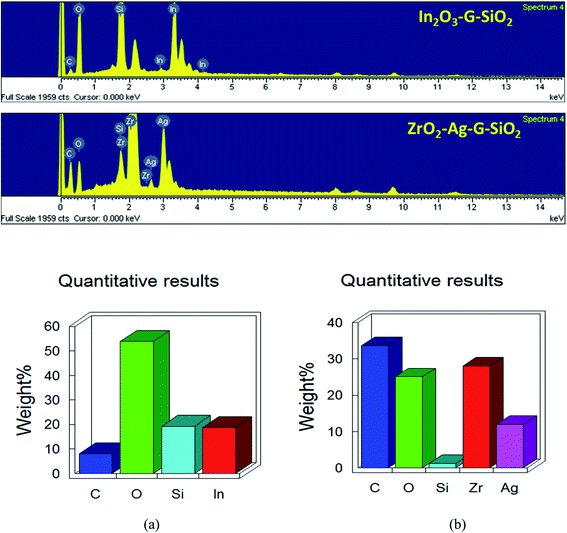
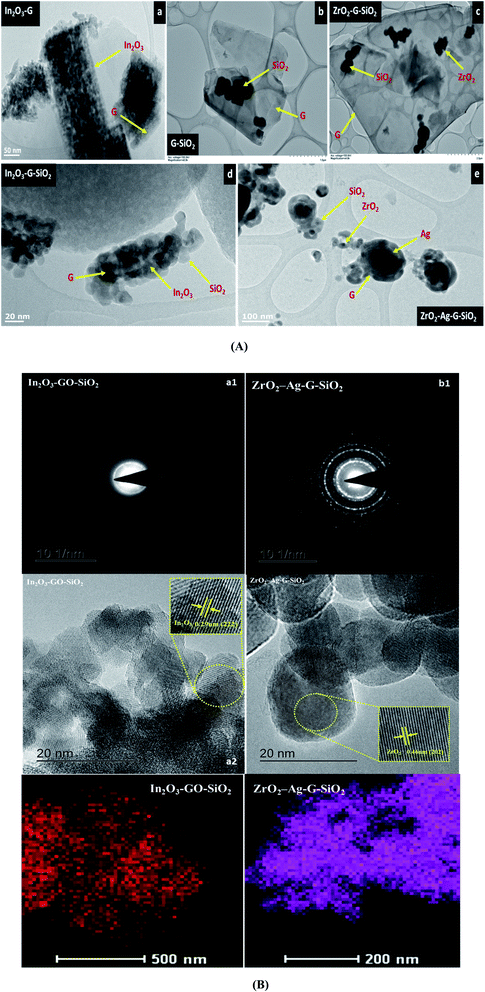
Fig. 3 presents the consequent laboratory-scale examination of a ternary (ZrO2–GO–SiO2) composite, which uncovers the fundamental components, in particular C, O, Zr, and Si. The component of C was obtained from graphene. Zr and Si are the fundamental components in ZrO2 and SiO2. The nuclear and weight amounts of oxygen were high due to the ternary composite comprising of an oxide segment and graphene oxide. Also, a few peaks were seen in the EDX spectra because of a part of the precursor material and contamination from the machine. The shape and morphology of the binary and ternary composites were observed and examined using TEM and HRTEM, and Fig. 4(A) shows images with different magnifications. The metal oxide (ZrO2) nanocomposite appeared as a dark spot in Fig. 4(a) and (b). Silica oxide (SiO2) was round, and was dull colored, as shown in Fig. 4(c) and (d). The silica oxide nanocomposites were agglomerated on the surface of graphene. The silica and modified metal oxide nanocomposites were surrounded by graphene, and it appeared as a light dark shaded region. For a high-magnification HRTEM, Fig. 4B(a2) shows In2O3–GO–SiO2 nanoparticles, and glass-like cross-section borders with the d-dispersing of 0.29 Å compared to In2O3 (222); (b2) shows Zr–Ag–G–SiO2 translucent grid borders with the d-separating of 0.462 Å nm, relating to (202). Further details of the translucent grid were observed in selected area electron diffraction (SAED) examination, as shown in Fig. 4B(b1) and (b2). The patterns uncover three concentric diffraction rings from the centre corresponding to In2O3–GO–SiO2 (211), (222), and (400), and Zr–Ag–G–SiO2, (112), (103) and (202), respectively. The calculation of interplanar spacing depends on the structural phase of the material. If the interplanar spacing (d spacing) is reduced, the planes (hkl) are expanded.
Raman spectroscopy is a light scattering technique, where the laser light interacts with sub-atomic vibrations and photons bringing about a change in the energy, either increase or decrease, of the laser photons. The results of Raman spectroscopy provide data on the electronic band structure of (D and G band) carbon materials, phases and fundamental properties of the spherical phase of SiO2, cubic phase of ZrO2, and graphene because of the solid scattering properties, as shown in Fig. 5. Zirconium oxide (ZrO2) has three different crystalline phases, (a) monoclinic 18 (9Ag + 9Bg), (b) tetragonal 6 (1A1g + 2B1g + 3Eg), and (c) cubic 3 (T2g) vibrational modes.20 The ZrO2 peak (green colored) was located in the wavelength range of 100–800 cm−1. The vibrational modes of the monoclinic phase were allocated as follows: Ag at 177, 333, 346, 476 cm−1, Bg at 501, 637, 756 cm−1, and the shifts at 476 and 637 cm−1 belong to the biphasic structure.21 The GO–SiO2 binary composite exhibited 3 unique peaks (orange colored), which appeared at wavelengths of 510, 1363, and 1590 cm−1. The wide and low-intensity peak was situated at a wavelength of 510 cm−1, which corresponds to the spherical structure of SiO2, while the other two peaks were allocated to the D and G-band of graphene. As a rule, the D-band was at the wavelength of 1390 cm−1 and the G-band was at around 1583 cm−1 because of the E2g mode of graphene.22 The peak properties of the D and G bands (position, intensity, and width) are used for characterizing material composition. In the Raman spectrum of GO–SiO2, the main peak appeared at 1363 cm−1 and the peak can be attributed to the ordinary sp3 hybridized carbon (D band) auxiliary defect, while the subsequent peak can be attributed to the in-plane vibration of sp2 hybridized carbons (G band) that was located at 1590 cm−1 (graphite), and can be used to characterize the arrangement of the electronic structure of graphene. The Raman spectrum of ZrO2–GO–SiO2 with the characteristic peaks of graphene were observed, while the peaks of SiO2 and ZrO2 were not present. Peaks appeared at 1370 cm−1 and 1597 cm−1 Raman wavelengths, and the peak intensity was lower than the intensity of the D and G-groups. In the consequent Raman spectrum, the position of the D and G-band was changed, which was expected of the SiO2 and ZrO2 attached to the surface of graphene, implying that the composition of graphene was changed. The intensity of the D-band was lower than that of the G-band, implying that there were more sp2 bonds and more change from sp3 to sp2. Besides, the intensity ratio of ID/IG determined the sp3/sp2 proportion of graphene, and the value was 1.04. Fig. 5(b) shows the photo-current response of the ternary composite during four on–off cycles of light illumination. Generally, the ternary composite showed rapid and high-velocity current response for each light irradiation.28 This shows the improvement of the high sensing activity of the ternary composite.
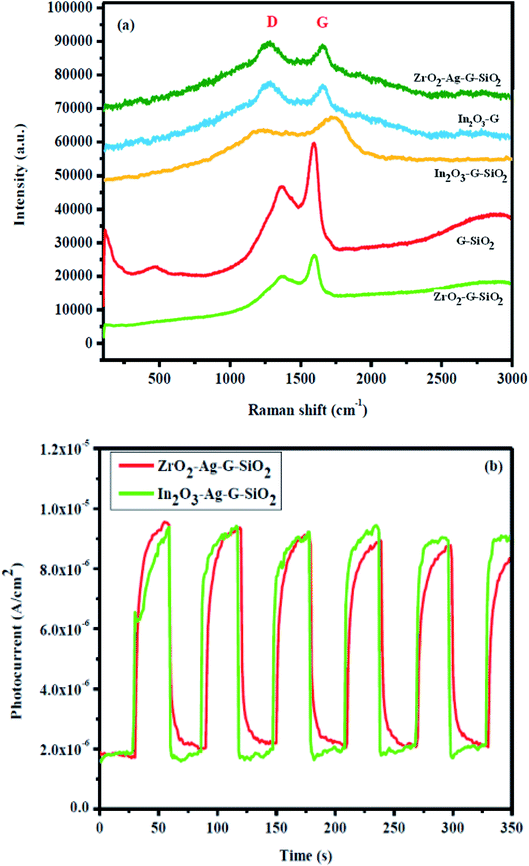 | ||
| Fig. 5 Raman spectra of (a) In2O3–GO, G-SiO2, Zr–G–SiO2, In2O3–GO–SiO2, Zr–Ag–G–SiO2. (b) Photocurrent density of In2O3–GO–SiO2, Zr–Ag–G–SiO2. | ||
The N2 adsorption–desorption isotherms were examined at 77 K for the as-obtained binary and ternary composites, as shown in Fig. 6. The surface area and pore-size distribution were assessed by BET and BJH methods, respectively. The results are shown in Fig. 6, while the summarized information is presented in Table 1. The overall weight of the hysteresis loops was (0.4–1.0) P/P0, as shown in Fig. 6(a). The adsorption isotherm of ZrO2–GO binary composite corresponds to type II isotherm (nonporous or macroporous), while the relationship between the pore shape and the adsorption–desorption isotherm indicate H3 hysteresis. The type H3 hysteresis loop indicates or corresponds to a slit-like pore. The GO–SiO2 binary composite was identified with type IV isotherm with type H1 hysteresis loop. The adsorption isotherm of ZrO2–GO–SiO2 ternary composite exhibited type IV isotherm with type H1 hysteresis loop. The type IV isotherm is normal for mesoporous adsorbents.27 The ternary ZrO2–GO–SiO2 composite has a greater surface area, 106.205 m2 g−1, while the normal pore breadth was 5.4 nm. The spherical SiO2 attached to ZrO2–GO because of the improved value of the specific surface area and the experimental conditions, particularly the calcination temperature. The obtained ternary composite had a high specific surface area and approximately small pores, which exhibit high synergy between the environment of the composite and color material during the degradation cycle. The excellent performance of these mesoporous materials was attributed to a high surface area, tunable pore size, and increased number of active sites of the nano-sized substrate material. High surface area and mesoporosity are directly related to the high adsorption capacity of sensing materials. The hysteresis loops gradually shift to a higher relative pressure (P/P0) for In2O3–GO–SiO2 and ZrO2–GO–SiO2 suggesting that these mesopores were expanding the mesoporous SiO2.
 | ||
| Fig. 6 Nitrogen adsorption–desorption isotherms of (a) In2O3–GO, (b) G-SiO2, (c) Zr–G–SiO2 (d) In2O3–GO–SiO2, (e) Zr–Ag–G–SiO2. | ||
| Samples | BET surface area (m2 g−1) | Total pore volume (cm3 g−1) | Average Pore diameter (nm) |
|---|---|---|---|
| In2O3–GO | 29.688 | 0.105 | 13.995 |
| In2O3–GO–SiO2 | 253.79 | 0.281 | 4.4284 |
| GO–SiO2 | 33.250 | 0.145 | 14.213 |
| Zr–G–SiO2 | 106.205 | 0.123 | 5.6691 |
| Zr–Ag–G–SiO2 | 9.1703 | 0.020549 | 8.9632 |
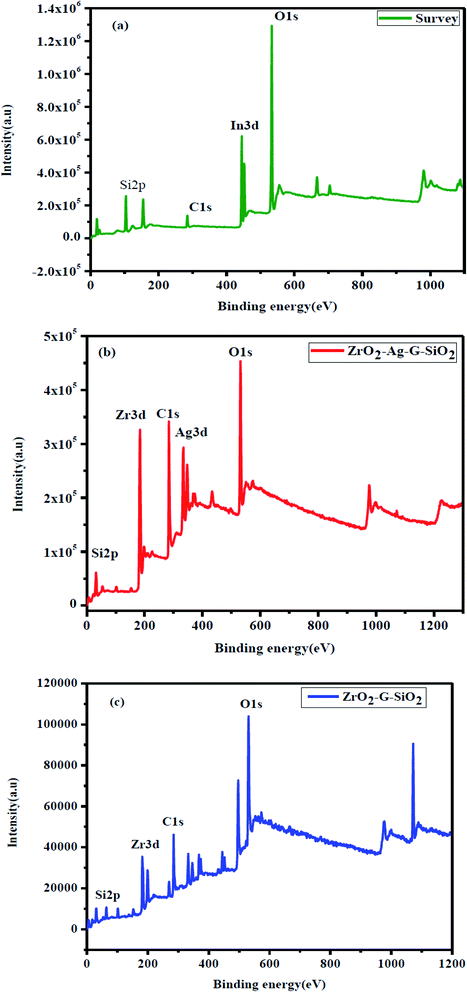
Fig. 7(a) shows the XPS spectra which confirmed the interaction between ZrO2, SiO2, and graphene. XPS investigation was performed over ternary ZrO2–GO–SiO2 composite. Fig. 7(b) shows the XPS spectrum of O 1s, where the peak is at a binding energy of around 531 eV; the peak can be attributed to metal oxide ions; on the other hand, if the binding energy of the peak is higher than 531 eV, it corresponds to hydroxide ions.23 In the XPS spectrum of O 1s, the wide peak was located at 530.79 eV, and the binding energy was lower than 531 eV, demonstrating the type of metal oxide. Fig. 7(c) presents the XPS spectrum of C 1s showing three peaks that were located at the binding energy values of 284.63, 285.65 and 288.38 eV. The XPS spectrum of C 1s comprises few characteristic peaks, such as carbonyl carbon (C![[double bond, length as m-dash]](https://www.rsc.org/images/entities/char_e001.gif) O, (288.4–288.6) eV), aliphatic (C–C, (284.4–285.9) eV), Zr–O–C ((286.6–286.8) eV), and carboxylate carbon (O–C
O, (288.4–288.6) eV), aliphatic (C–C, (284.4–285.9) eV), Zr–O–C ((286.6–286.8) eV), and carboxylate carbon (O–C![[double bond, length as m-dash]](https://www.rsc.org/images/entities/char_e001.gif) O, 289.3 eV).24 The (C–C) and (C–C) bonds indicate the carbon-to-carbon chemical bonding sate, and C–OX (X = metal) bond indicates the metal-to-carbon chemical bonding state. Fig. 7(d) shows the XPS spectrum of Zr 3d comprising two sharp peaks. These two peaks were located at binding energy values of 181.98 and 184.34 eV, attributed to the spin orbital type of Zr 3d5/2 and Zr 3d3/2, and this result is the proof of Zr(4 − x) particles.25 The XPS peaks of Si2p appeared at 101.60 eV binding energy region in Fig. 7(e) and this peak assigned to the presence of O–Si-O. The spins-orbital were not included in the XPS analysis due to peak distortion.26 The binding energy shifts show the strong bonding between in ZrO2–GO–SiO2.
O, 289.3 eV).24 The (C–C) and (C–C) bonds indicate the carbon-to-carbon chemical bonding sate, and C–OX (X = metal) bond indicates the metal-to-carbon chemical bonding state. Fig. 7(d) shows the XPS spectrum of Zr 3d comprising two sharp peaks. These two peaks were located at binding energy values of 181.98 and 184.34 eV, attributed to the spin orbital type of Zr 3d5/2 and Zr 3d3/2, and this result is the proof of Zr(4 − x) particles.25 The XPS peaks of Si2p appeared at 101.60 eV binding energy region in Fig. 7(e) and this peak assigned to the presence of O–Si-O. The spins-orbital were not included in the XPS analysis due to peak distortion.26 The binding energy shifts show the strong bonding between in ZrO2–GO–SiO2.
3.2. Electrochemical response of ZrO2–Ag–G–SiO2 and In2O3–G–SiO2
Fig. 8(a) demonstrates the electrochemical properties of ZrO2–Ag–G–SiO2 and In2O3–G–SiO2, the CV curves of different electrodes with uncovered In2O3–G, G–SiO2, ZrO2–G–SiO2, ZrO2–Ag–G–SiO2 and In2O3–G–SiO2 electrode in 0.2 M PBS (pH ¼ 7.0). Fig. 8(b) shows that, in contrast with the absence of glucose, the increase in the oxidation current due to the increase in glucose concentration occurred on account of ZrO2–Ag–G–SiO2 and In2O3–G–SiO2. Fig. 8(c) shows the oxidation current of AA, ZrO2–Ag–G–SiO2 and In2O3–G–SiO2 display a verified increment at 0.1 V while the other three anodes showed a slight change in the studied low potential range containing 1.0 mM AA. The enhanced electrocatalytic performance of In2O3–G–SiO2 might be due to its synergistic effect and higher electrochemically active surface area compared to other anodes. The mesoporous structure of spherical In2O3–G–SiO2 can provide a large active area for the oxidation state of glucose and AA and the structure can improve the mass exchange. In Fig. 8(d), the oxidation current at ZrO2–Ag–G–SiO2 and In2O3–G–SiO2 show a significant decline at 0.1 V in the presence of albumin. | ||
| Fig. 8 (a) Cyclic voltammograms of In2O3–GO, G-SiO2, Zr–G–SiO2, In2O3–GO–SiO2, Zr–Ag–G–SiO2 in PBS. (b) In2O3–GO–SiO2, Zr–Ag–G–SiO2 with glucose, (c) with ascorbic acid and (d) with albumin. | ||
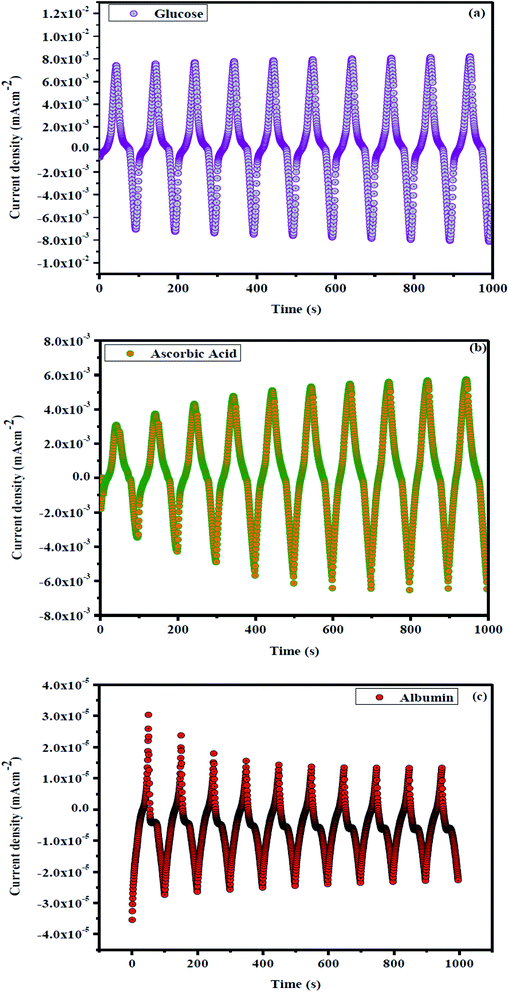
For more information on synergistic activity, clinically negative control urine was used to assess non-enzymatic electrochemical sensitivity to glucose. Fig. 9 shows the concentration dependency of In2O3–GO with glucose, ascorbic acid and albumin. Fig. 9 shows an oxidation current decreasing from 0 to 0.8 V, which indicates that the oxidation current expands slightly in In2O3-G-SiO2, which strengthens the egg white and has less reactivity. Fig. 10(a) and (b) show pH dependency of In2O3–G–SiO2 in PBS. In Fig. 10(a) and (b), both curves of In2O3–G–SiO2 show expanding oxidation current patterns with respect to increasing glucose concentration from 0 to 3 mM in PBS.
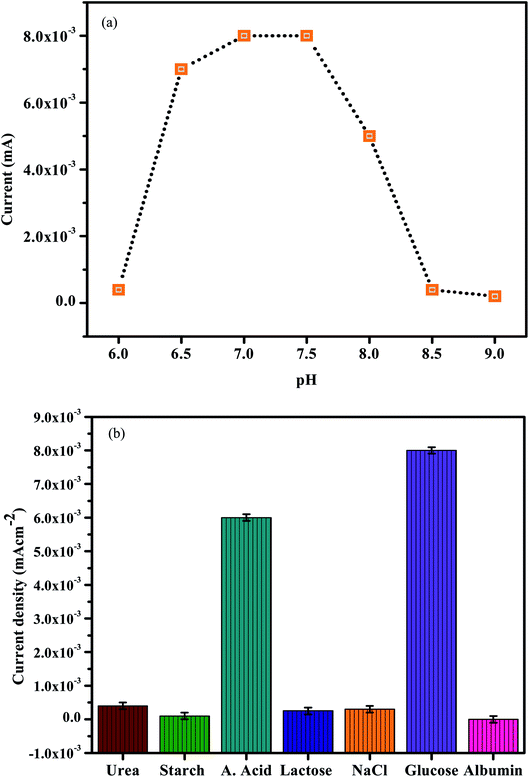 | ||
| Fig. 10 (a) The electrochemical response of the presented sensor in 0.2 M PBS at different pH. (b) Selectivity of the sensor. | ||
3.3. Catalytic performance and detection mechanism in physiological pH
To enhance the electrochemical reaction of In2O3–G–SiO2 for glucose, AA and microalbumin detection, the effect of pH on the electrode reaction was studied by CV in 0.2 M PBS containing 1.0 mM Glucose, AA and microalbumin at various pH. A significant increase in the current signal was observed with the increase in pH and showed the best performance at pH 7.0 (Fig. 10(a)). The result likewise shows that AA can be detected at different pH. This might be credited to the excellent stability of the incorporated In2O3–G–SiO2, which may enhance the capacity to oppose the external condition. Furthermore, since the electrode materials are altogether inorganic materials, in contrast to the organic catalysts, they are less affected by the external condition. To maintain the physiological condition and acquire high sensitivity, pH 7.0 PBS was chosen for further experiments.3.4 Interference
To assess the selectivity of In2O3–G–SiO2, we studied the effect of various interfering ions and organic molecules in the electrochemical trials (Fig. 9(b)). No interference was observed for starch, KCl, albumin, UA, urea, glucose, and NaCl when their concentrations were multiple times higher than that of AA (0.2 mM). The high selectivity could be due to the superimposed active sites of the incorporated electrode having a strong synergistic effect on the oxidative dehydrogenation of ascorbic acid and glucose, and furthermore, mostly in light of the fact that In2O3–G–SiO2 coordinated electrode has no obvious reactant effect on the expected interfering substances in dietary items or other organic samples. The results show the interference capacity of In2O3–G–SiO2.3.5 Reproducibility and stability of the developed sensor
The reproducibility of the sensor was also explored for three estimations with increasing glucose, AA, and albumin concentration. The relative standard deviation (RSD) of the current signal for 1.0 mM AA was under 2%. When In2O3–G–SiO2 was stored at room temperature for 30 days, it showed that the current reaction to 1.0 mM AA retained 98.2% of its initial capacity, demonstrating excellent electrochemical stability of the electrode. As shown in Table 1, In2O3-G-SiO2 nanocomposites had a high surface area and pore size, and their sensing activity to glucose and AA was high due to these properties. In addition, the stability and reproducibility of the sensor were high, and it indicates that the field of application of this material is wide.3.6. Catalytic performance and detection mechanism
According to Fig. 7–10, there were 3 oxidation potentials located at 0.18, 0.42, and 0.88 V corresponding to non-enzymatic glucose and ascorbic acid detection in urine. The feasible component of In2O3–G–SiO2 depended on the electrooxidation of pre-monolayer hydroxyl Co active sites and oxide arrangement of In2O3. The synergistic significance of the OH-ads layer was observed to mediate oxidation, followed by chemisorption of glucose.30 These peaks were attributed to the reduction/oxidation of In2+/In3+ and redox couples. Then, the glucose oxidation kinetics of InOOH was studied along with the charge/discharge profiles of other important species, indicating the decrease of oxygen release in glucose alternatives at a high potential above 0.8 V.8 In neutral pH urine, In2O3 could poorly bond to the hydroxyl ions. Our results demonstrated the presence of In2+/In3+ redox couples. Hence, our proposed detection system of In2O3–G–SiO2 is summarized in eqn (2) and (3).| 2In3+ ↔ 2In4+ + 2e− | (2) |
| In4+ + C6H12O6 (glucose) ↔ 2In3+ + C6H10O6 (gluconolactone) + 2H+ | (3) |
4. Conclusions
In this study, we prepared mesoporous ZrO2–GO–SiO2 and In2O3–G–SiO2 materials and evaluated their performance for glucose, ascorbic acid, and albumin detection in the concentration range from 0 to 3 mM. With the necessity of a strong alkaline condition, In2O3–G–SiO2 with high surface area and adsorption capacity demonstrated a comparable performance for electrochemical reactions using cyclic voltammetry. The both direct synergistic oxidation of the In3+/Co4+ oxidation-oxide pair and manual oxidation were studied by measuring glucose. In view of the results, In2O3–G–SiO2 exhibited excellent sensitivity in urine, recommending practical application for glucose estimation in urine.Conflicts of interest
There are no conflict to declare.Acknowledgements
This work was supported by the Research Foundation of Hanseo University in 2020. The authors are grateful to the staff of the University for financial support.References
- W. Animaw and Y. Seyoum, Increasing prevalence of diabetes mellitus in a developing country and its related factors, PLoS One, 2017, 12, e0187670 CrossRef.
- C. Radhakumary and K. Sreenivasan, Naked eye detection of glucose in urine using glucose oxidase immobilized gold nanoparticles, Anal. Chem., 2011, 83, 2829–2833 CrossRef CAS.
- M. S. Kim and D.-Y. Lee, Urinary glucose screening for early detection of asymptomatic type 2 diabetes in Jeonbuk Province Korean schoolchildren, J. Korean Med. Sci., 2017, 32, 985–991 CrossRef.
- N. Friedrich, T. Skaaby, M. Pietzner, K. Budde, B. H. Thuesen, M. Nauck and A. Linneberg, Identification of urine metabolites associated with 5-year changes in biomarkers of glucose homoeostasis, Diabetes Metab., 2018, 44, 261–268 CrossRef CAS.
- P. Si, Y. Huang, T. Wang and J. Ma, Nanomaterials for electrochemical non-enzymatic glucose biosensors, RSC Adv., 2013, 3, 3487–3502 RSC.
- K. Tian, M. Prestgard and A. Tiwari, A review of recent advances in nonenzymatic glucose sensors, Mater. Sci. Eng., C, 2014, 41, 100–118 CrossRef CAS.
- D. Pletcher, Electrocatalysis: present and future, J. Appl. Electrochem., 1984, 14, 403–415 CrossRef CAS.
- K. E. Toghill and R. G. Compton, Electrochemical non-enzymatic glucose sensors: a perspective and an evaluation, Int. J. Electrochem. Sci., 2010, 2010, 1246–1301 Search PubMed.
- S. Fu, G. Fan, L. Yang and F. Li, Non-enzymatic glucose sensor based on Au nanoparticles decorated ternary Ni–Al layered double hydroxide/single-walled carbon nanotubes/graphene nanocomposite, Electrochim. Acta, 2015, 152, 146–154 CrossRef CAS.
- L. T. Hoa, K. G. Sun and S. H. Hur, highly sensitive non-enzymatic glucose sensor based on Pt nanoparticle decorated graphene oxide hydrogel, Sens. Actuators, B, 2015, 210, 618–623 CrossRef CAS.
- G.-h. Wu, X.-h. Song, Y.-F. Wu, X.-m. Chen, F. Luo and X. Chen, Non-enzymatic electrochemical glucose sensor based on platinum nanoflowers supported on graphene oxide, Talanta, 2013, 105, 379–385 CrossRef CAS.
- L. Hou, H. Zhao, S. Bi, Y. Xu and Y. Lu, Ultrasensitive and highly selective sandpapersupported copper framework for non-enzymatic glucose sensor, Electrochim. Acta, 2017, 248, 281–291 CrossRef CAS.
- X. Liu, W. Yang, L. Chen and J. Jia, Three-dimensional copper foam supported CuO nanowire arrays: an efficient non-enzymatic glucose sensor, Electrochim. Acta, 2017, 235, 519–526 CrossRef CAS.
- Y. Zhong, T. Shi, Z. Liu, S. Cheng, Y. Huang, X. Tao, G. Liao and Z. Tang, Ultrasensitive non-enzymatic glucose sensors based on different copper oxide nanostructures by in situ growth, Sens. Actuators, B, 2016, 236, 326–333 CrossRef CAS.
- Q. Wang, Q. Wang, M. Li, S. Szunerits and R. Boukherroub, Preparation of reduced graphene oxide/Cu nanoparticle composites through electrophoretic deposition: application for nonenzymatic glucose sensing, RSC Adv., 2015, 5, 15861–15869 RSC.
- B. Hai and Y. Zou, Carbon cloth supported NiAl-layered double hydroxides for flexible application and highly sensitive electrochemical sensors, Sens. Actuators, B, 2015, 208, 143–150 CrossRef CAS.
- X. Li, J. Liu, X. Ji, J. Jiang, R. Ding, Y. Hu, A. Hu and X. Huang, Ni/Al layered double hydroxide nanosheet film grown directly on Ti substrate and its application for a nonenzymatic glucose sensor, Sens. Actuators, B, 2010, 147, 241–247 CrossRef CAS.
- Y. Shu, Y. Yan, J. Chen, Q. Xu, H. Pang and X. Hu, Ni and NiO nanoparticles decorated metal–organic framework nanosheets: facile synthesis and high-performance nonenzymatic glucose detection in human serum, ACS Appl. Mater. Interfaces, 2017, 9, 22342–22349 CrossRef CAS.
- N. F. Zubair, S. Jamil, H. N. Bhatti and M. Shahid, A comprehensive thermodynamic and kinetic study of synthesized rGO–ZrO2 composite as a photocatalyst and its use as fuel additive, J. Mol. Struct., 2019, 1198, 126869 CrossRef CAS.
- M. Rahsepar, F. Foroughi and H. Kim, A new enzyme-free biosensor based on nitrogendoped graphene with high sensing performance for electrochemical detection of glucose at biological pH value, Sens. Actuators, B, 2019, 282, 322–330 CrossRef CAS.
- N. Venkatathri, Synthesis of silica nanosphere from homogeneous and heterogeneous systems, Bull. Mater. Sci., 2007, 30, 615–617 CrossRef CAS.
- L. Wang, J. Zhao, H. Liu and J. Huang, Design modification and application of semiconductor photocatalysts, J. Taiwan Inst. Chem. Eng., 2018, 590–602 CrossRef.
- B. M. Mohammed, B. J. Fisher, D. Kraskauskas, S. Ward, J. S. Wayne, D. F. Brophy, A. A. Fowler, D. R. Yager and R. Natarajan, Int. Wound J., 2015, 1–13 Search PubMed.
- M. Levavasseur, C. Becquart, E. Pape, M. Pigeyre, J. Rousseaux, D. Staumont-Sallé and E. Delaporte, Eur. J. Clin. Nutr., 2015, 69, 1076–1077 CrossRef CAS.
- S. Sasazuki, S. Sasaki, Y. Tsubono, S. Okubo, M. Hayashi and S. Tsugane, Eur. J. Clin. Nutr., 2006, 60, 9–17 CrossRef CAS.
- N. Attallah, Y. Osman-Malik, S. Frinak and A. Besarab, Am. J. Kidney Dis., 2006, 47, 644–654 CrossRef CAS.
- Y. Song, C. Gong, D. Su, Y. Shen, Y. Song and L. Wang, A novel ascorbic acid electrochemical sensor based on spherical MOF-5 arrayed on a three-dimensional porous carbon electrode, Anal. Methods, 2016, 8(10), 2290–2296 RSC.
- K. N. Fatema, S. Sagadevan, Y. Liu, K. Y. Cho, C. H. Jung and W. C. Oh, New design of mesoporous SiO2 combined In2O3-graphene semiconductor nanocomposite for highly effective and selective gas detection, J. Mater. Sci., 2020, 55(27), 13085–13101 CrossRef CAS.
- K. N. Fatema, M. R. U. D. Biswas, S. H. Bang, K. Y. Cho and W. C. Oh, Electroanalytical characteristic of a novel biosensor designed with graphene–polymer-based quaternary and mesoporous nanomaterials, Bull. Mater. Sci., 2020, 43, 121 CrossRef CAS.
- M. Janyasupab, C. W. Liu, N. Chanlek, S. Chio-Srichan, C. Promptmas and W. Surareungchai, A comparative study of non-enzymatic glucose detection in artificial human urine and human urine specimens by using mesoporous bimetallic cobalt-iron supported N-doped graphene biosensor based on differential pulse voltammetry, Sens. Actuators, B, 2019, 286, 550–563 CrossRef CAS.
| This journal is © The Royal Society of Chemistry 2021 |

