 Open Access Article
Creative Commons Attribution 3.0 Unported Licence
Blackening of titanium dioxide nanoparticles by atomic hydrogen and the effect of coexistence of water on the blackening
Masahide Fujimotoa,
Masuaki Matsumoto *a,
Naoki Nagatsuka†
 b and
Katsuyuki Fukutani
 *bc
*bc
aTokyo Gakugei Univ., 4-1-1 Nukui-kita-machi, Koganei-shi, Tokyo 184-8501, Japan. E-mail: masuaki@u-gakugei.ac.jp
bInstitute of Industrial Science, The University of Tokyo, 4-6-1 Komaba, Meguro-ku, Tokyo 153-8505, Japan. E-mail: fukutani@iis.u-tokyo.ac.jp
cAdvanced Science Research Center, Japan Atomic Energy Agency, Tokai, Ibaraki 319-1195, Japan
First published on 21st January 2021
Abstract
A fast blackening process of titanium dioxide nanoparticles by exposing to atomic hydrogen was studied by estimating the color of the nanoparticles. The whiteness of TiO2 decreased exponentially with time, which suggests a first-order reaction between atomic H and surface oxygen, whose rate constant is proportional to the ambient pressure of H2. The rate constant increases as the temperature of nanoparticles at exposing to atomic hydrogen. The structure and size of nanoparticles were estimated by the X-ray diffraction (XRD), which shows that a part of anatase transferred to rutile and the crystal sizes of both anatase and rutile increased by hydrogenation above 600 K. The blackening of TiO2 halfway stopped under the condition of the similar partial pressure of water with hydrogen. This suggests the presence of reverse reaction between H2O and oxygen vacancy, whose reaction rate constant is proportional to the partial pressure of H2O.
1 Introduction
Titanium dioxide (TiO2) is one of the most widely used photocatalysts and has been extensively studied after the pioneering work by Fujishima and Honda.1,2 Since the band-gap of TiO2 is wide (about 3 eV), it can absorb only ultraviolet light, which is contained only several % in the solar light. Therefore, many efforts have been made to improve the optical absorption of TiO2 under the solar light, such as generation of donor or acceptor states in the band gap by doping impurities3–6 or production of Ti3+ by self-doping.7 An alternative approach to improve absorption of solar light was proposed by Chen et al.,8–10 and reviewed by Liu et al.11 Chen et al. hydrogenated the anatase TiO2 nanoparticles in a 20 bar H2 atmosphere at about 473 K for 5 days. While the color of natural TiO2 nanoparticles is white, it changed to black by hydrogenation, therefore, it is called the black TiO2 (titania). The narrowing of the band gap was confirmed by X-ray photoelectron spectroscopy and the acceleration of photocatalytic decomposition of methylene blue was observed. Disordering of the outer region of nanoparticles was also observed by high-resolution transmission electron microscopy, which they attributed to the cause of the blackening and the band gap narrowing of TiO2. Selcuk et al. studied the formation mechanism and structure features of the black TiO2 using the first-principles-validated reactive force field molecular dynamics simulations and revealed that surface oxygen vacancies were created by reaction with H2 and its diffusion into bulk is inhibited by a high barrier in the subsurface region, which initiates surface disordering, and that this hydrogenated amorphous shell has a key role in the photoactivity of the black TiO2.12 The interaction of hydrogen with TiO2 has been extensively studied both experimentally and theoretically.2 The reduction of TiO2 and the production of oxygen vacancies or Ti3+, which modify the electronic structure, can be easily caused by vacuum annealing, hydrogen adsorption, electron irradiation, ultraviolet light irradiation, or exposure to molecular or atomic hydrogen.13–16 Among these procedures, the exposure to atomic hydrogen is expected to reduce the TiO2 surface effectively. In this paper, the blackening of the TiO2 nanoparticles by exposing to atomic hydrogen was studied at various sample temperatures and ambient H2 pressures. Since H2O is expected to be one of the products by the reduction of TiO2 by hydrogen and it was reported that the presence of water affects the stability of oxygens and oxygen vacancies at the surface and subsurface sites,17 the effect of partial pressure of H2O on the blackening was also studied.2 Experimental
Blackening of TiO2 nanoparticles was performed in a high-vacuum chamber, whose base pressure was about 10−4 Pa. The anatase TiO2 nanoparticles with an average diameter of 8 nm (ST-01, Ishihara Sangyo Kaisha, Ltd.) were put on a W boat, which could be heated up to 873 K measured by the type K thermocouple. The temperature of the W boat is called the hydrogenation temperature below. The atomic hydrogen was produced by a W filament that was placed about 5 mm from the boat. The filament was heated at about 1973 K by direct current, of which temperature was monitored by a pyrometer. It was reported that the cracking efficiency of H2 was 1.5% at 1873 K and increases exponentially with W filament temperature, which suggests that the atomic hydrogen can be efficiently produced at 1973 K.18After setting the temperature of the W boat and filament at appropriate temperatures, photos of the sample were taken every several seconds. The whiteness of the sample was estimated from the numerical value of the 8 bit digitized monochrome image by using an imaging software. After introducing H2 into vacuum chamber, time evolution of the whiteness was obtained. The whiteness was normalized by the initial value of a series of the measurements. Since only the part of the nanoparticles facing to the W filament was blackened after a measurement of time evolution, the whiteness could be initialized by scrambling with a wobble stick and the next measurement was started. The speed of blackening largely depends on the distance between the sample and the W filament for H2 dissociation. It is necessary to put the W filament near the nanoparticles to blacken them quickly. Though the distance affects the temperature of the sample, this effect is included in the increase of the hydrogenation temperature. It is therefore suggested that the efficient incidence of atomic hydrogen is important for the effective blackening of TiO2.
Structural phase and average size of the nanoparticles were estimated by X-ray diffraction (XRD: Ultima IV, RIGAKU). The fraction of anatase was estimated by the integrated peak intensities for the anatase and rutile. The average size (D) of the nanoparticles was estimated by the Scherrer equation
3 Results
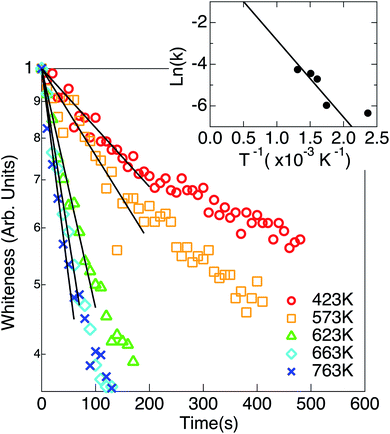
The temperatures of TiO2 nanoparticles and W filament were kept at 573 K and 1973 K, respectively, for about 30 min to get the stable states, and H2 was introduced in vacuum at t = 0. When the ambient H2 pressure (pH2) was kept constant at a fixed pressure from 5.0 × 10⁻³ Pa to 1.0 × 10⁻¹ Pa, the color of the nanoparticles changed from white to black and sintering occurred in a few minutes. The particle size increased by sintering. When the sample was treated without introducing H2 (at the base pressure of 10−4 Pa), only the sintering occurred but the color of the nanoparticles hardly changed. Time evolutions of the whiteness of TiO2 nanoparticles at various pH2 are shown in Fig. 1. As shown in the figure, the whiteness decreased almost exponentially with time and the time constant became smaller as the ambient H2 pressure was increased.Time evolutions of the whiteness of TiO2 nanoparticles at various hydrogenation temperatures (Ts) are shown in Fig. 2. The whiteness initially decreased exponentially, and the initial time constants τ1 decreased as the hydrogenation temperature increased. Decreasing curves of the whiteness deviate from the exponential functions at the low whiteness region.
Though the TiO2 nanoparticles could be blackened in a few minutes under the low ambient H2 pressures, the blackening only occurs at the upper side of the nanoparticles facing to the filament for H2 dissociation, which means that the atomic hydrogen is indispensable for the blackening of TiO2. It is necessary to scramble the nanoparticles every several minutes by the wobble stick to get the uniform black nanoparticles for the XRD experiments.
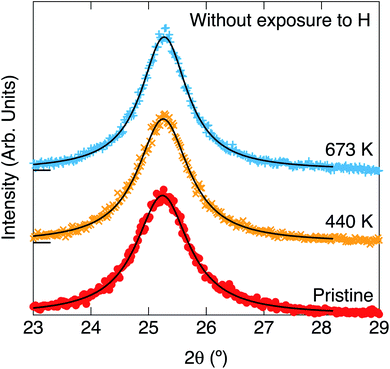
XRDs for the pristine white TiO2 and the heated ones without and with exposure to hydrogen are shown in Fig. 3 and 4, respectively. The parameters of the XRD are summarized in Table 1. The TiO2 nanoparticles were not blackened without exposure to hydrogen. Only one peak can be observed at 25.3° for the pristine white TiO2 nanoparticles. The peak position did not change by heating the white TiO2 nanoparticles without exposure to hydrogen. The peak width slightly narrowed by heating, which means that the average crystal size slightly increased from 7.32 nm to 8.36 nm.
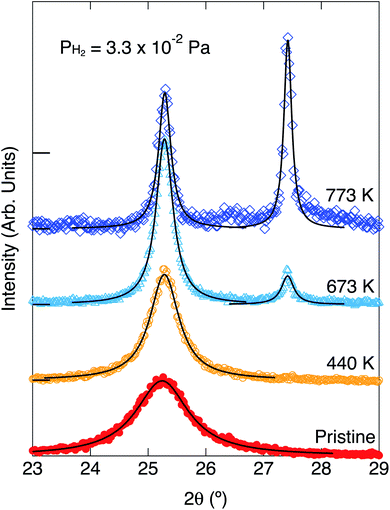
| Color (B/W) | Anatase/rutile | H exposure | Ts (K) | Peak 2θ (°) | Peak width (°) | Fraction | Crystal size (nm) |
|---|---|---|---|---|---|---|---|
| W | A | n | — | 25.2 | 1.112 | 1 | 7.32 |
| W | A | n | 440 | 25.3 | 1.073 | 1 | 7.59 |
| W | A | n | 673 | 25.3 | 0.9745 | 1 | 8.36 |
| B | A | y | 440 | 25.3 | 0.6104 | 1 | 13.3 |
| B | A | y | 673 | 25.3 | 0.3552 | 0.89 | 22.9 |
| B | R | y | 673 | 27.4 | 0.2593 | 0.11 | 31.5 |
| B | A | y | 773 | 25.3 | 0.2575 | 0.53 | 31.6 |
| B | R | y | 773 | 27.4 | 0.1647 | 0.47 | 49.7 |
Blackening of TiO2 was caused by heating under exposure to the atomic hydrogen. XRDs for the black TiO2 produced at the hydrogenation temperatures of 440 K, 673 K and 773 K are shown in Fig. 4. XRD for the pristine white TiO2 is also shown for comparison. The width of the peak at 25.3° narrowed by heating, which suggests that the average crystal size increased from 7.32 nm to 13.3 nm, 22.9 nm and 31.6 nm by heating at 440 K, 673 K and 773 K, respectively. Besides the change in the peak width, another new peak appeared at 27.4° after blackening at and above 673 K. The peak at 25.3° and 27.4° could be assigned to the anatase (101) and rutile (110), respectively, which means that a part of the original anatase TiO2 transferred to rutile at high hydrogenation temperatures. The fractions of anatase were estimated by the integrated intensities of the two peaks. Temperature dependences of the fraction of anatase and the crystal sizes are shown in Fig. 5. They are also summarized in Table 1. As the hydrogenation temperature was increased, the fraction of anatase started to decrease above 500–600 K, from 100% at 440 K to 50% at 780 K. The crystal sizes also increased as the hydrogenation temperature increased. This result is consistent with the previous reports by Mao et al., which showed that the phase transition from anatase to rutile is accelerated by H2 annealing.19
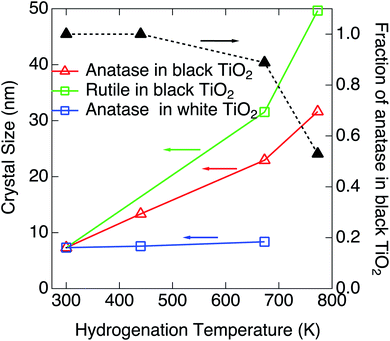 | ||
| Fig. 5 Hydrogenation temperature dependences of the fraction of anatase and the size of nanoparticles and crystal structure at a fixed ambient H2 pressure of 3.3 × 10⁻² Pa. | ||
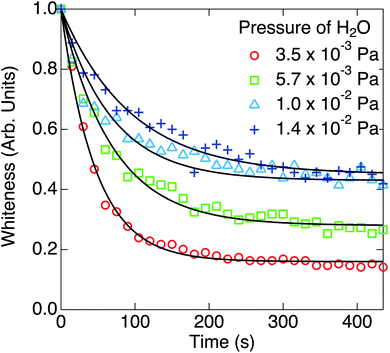
Finally, the effect of coexistence of water impurity was researched. Time evolutions of the whiteness at the partial pressures of H2O (pH2O) of 3.5 × 10⁻³ Pa, 5.7 × 10⁻³ Pa, 1.0 × 10⁻² Pa and 1.4 × 10⁻² Pa are shown in Fig. 6. The base pressure before introducing water was 5.0 × 10⁻⁵ Pa. After setting the partial pressures of H2O to respective values, the temperatures of nanoparticles and W filament were kept at 573 K and 1973 K, respectively, for about 30 min, and H2 with a partial pressure of 3.3 × 10⁻² Pa was introduced into the chamber at t = 0 s. As shown in Fig. 6, the whiteness decreased exponentially, but they saturated to the larger values than those in Fig. 1, which means that the blackening of TiO2 nanoparticles halfway stopped.
4 Discussion
It is thought that the disordering of the outer region of the nanoparticles is related to the blackening from the results by HRTEM.8 This disordering is thought to be caused by the reduction of TiO2, which produces oxygen vacancies and/or interstitial hydrogen near the surface. Since the production of OH does not cause blackening16 and the H amount is confirmed to be smaller than 1 atomic% by nuclear reaction analysis,21 the production of oxygen vacancies is focused and discussed in this manuscript.The reaction between the atomic hydrogen from the high temperature W filament and the surface oxygen (Os) of TiO2 nanoparticles can be written by the following formula.11,12
| 2H + Os → H2O + VO | (1) |
If the number of H2 is enough and the Arrhenius type rate equation is assumed in this reaction, the coverage of surface oxygen ([Os]) obeys the following differential equation.
 | (2) |
| W ∝ [Os] ∝ exp(−k1t), | (3) |
k1 = A1![[thin space (1/6-em)]](https://www.rsc.org/images/entities/char_2009.gif) exp[−Ea/(kBTs)], exp[−Ea/(kBTs)],
| (4) |
 , where mH2 and Tg are the mass and the temperature of ambient H2 molecules, it is reasonable that the reaction rate constant is proportional to the ambient pressure of H2.
In Fig. 2, the whitenesses also change exponentially at the initial stages of the reaction. However, it is difficult to fit each curve by a single rate constant. The slopes of the curves significantly change in the blackening process. This suggests a possibility of the presence of two blackening processes with different reaction rate constant, although this cause is not known yet.
It should be noted that the absolute value of the reaction constant at 573 K in Fig. 2 is different from that at 1.0 × 10⁻² Pa in Fig. 1 in spite of the similar condition of reaction. As described in the Experimental section, this is because the distance between the sample and the W filament is different from each other. Though the absolute value of the rate constant cannot be discussed, the temperature dependence of the relative rate constant is discussed.
The Arrhenius plot for the reaction (eqn (4)) is plotted in the inset of Fig. 2. The activation energy for the reaction (1) was estimated to be 186 ± 50 meV. Scheiber et al. reported that migration of VO from surface to subsurface starts at temperatures ∼200 K, which suggests that diffusion of O from subsurface to surface also starts at such low temperatures.20 Therefore, it is suggested that the diffusion of VO or O are not a rate-determining process for the reaction (1). Ohashi et al. reported that the tailing feature at the valence band maximum that is characteristic to the black TiO2 was not observed by annealing after H ion irradiation, where no structural disorder occurred by H incorporation in TiO2 without annealing.16 In the present work, on the other hand, the TiO2 could be blackened by annealing under the atomic H irradiation.
Since H2O is the product of the reaction (1), the reverse reaction also occurs if a large amount of H2O gas exists in the atmosphere.
| H2O + VO → H2 + Os | (5) |
If the number of incident H2O gas is enough and the first order rate equation is also assumed in this reaction, the differential equation for the two reactions (1) and (5) can be written as follows.
 | (6) |
 | (7) |
 | (8) |
The parameters k1 and k2 were estimated from the reaction rate constants (k′ = k1 + k2) and the saturation values of the whiteness (ws = k2/(k1 + k2)) by fitting the experimental curves to eqn (8) in Fig. 6. They are summarized in Table 2 and plotted in Fig. 7. Though the trends of increasing of k2 with increasing pH2O are shown, the proportionality between k2 and pH2O, which is expected under the assumption of a similar equation with eqn (4), is not clear. It is also suggested that the reaction (1) between H2 and Os is severely blocked by the presence of H2O, by which k1 largely decreases with increasing pH2O. Li and Gao reported that the surface VO becomes more stable than the subsurface VO by water adsorption, by which water dissociation can be activated. This may also increase k2, which is consistent with our results in Fig. 7.
| pH2O/Pa | k′/s−1 | ws | k1/s−1 | k2/s−1 |
|---|---|---|---|---|
| 3.50 × 10⁻³ | 0.0215 | 0.16 | 0.018 | 0.003 |
| 5.70 × 10⁻³ | 0.0146 | 0.28 | 0.011 | 0.003 |
| 1.0 × 10⁻² | 0.0146 | 0.43 | 0.008 | 0.006 |
| 1.40 × 10⁻² | 0.0100 | 0.44 | 0.006 | 0.004 |
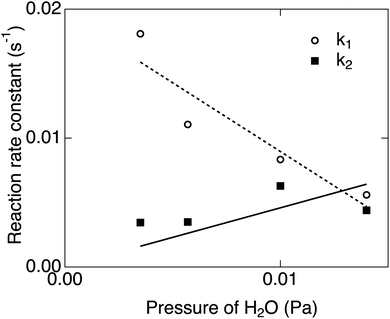 | ||
| Fig. 7 pH2O dependences of k1 and k2 estimated from the rate constants and the saturation values of the whiteness in Fig. 6. | ||
5 Summary
The blackening process of TiO2 nanoparticles by exposing to atomic hydrogen was studied. The whiteness of TiO2 decreased exponentially with time. Assuming that the whiteness is proportional to the coverage of the surface oxygen vacancy, the rate constant in the first order rate equation for the reaction between H2 and surface oxygen is proportional to the pressure (the impinging rate) of H2, and increases with increasing the hydrogenation temperature. The crystal size and the anatase/rutile ratio were estimated by XRD, which shows that the decrease in the fraction of anatase begins almost at the same hydrogenation temperature with the increase in the size of TiO2 nanoparticles. The blackening of TiO2 halfway stopped under the condition of the similar partial pressure of water with hydrogen. This suggests the presence of reverse reaction between H2O and oxygen vacancy and the presence of H2O severely blocks the reaction between H2 and surface oxygen. Tailing of the valence band maximum and the enhancement of photocatalytic reaction were confirmed for the single crystal TiO2 blackened by the same method, and the surface structure is under study.21 It is expected that our new method would contribute the efficiency improvement of photocatalyst based on TiO2.Conflicts of interest
There are no conflicts to declare.Acknowledgements
This work was partly supported by Grants-in-Aid for Scientific Research (JSPS KAKENHI under Grant No. JP17K05052 and JP18H05518).References
- A. Fujishima and K. Honda, Nature, 1972, 238, 37 CrossRef CAS.
- U. Diebold, Surf. Sci. Rep., 2003, 48, 53 CrossRef CAS.
- R. Asahi, T. Morikawa, T. Ohwaki, K. Aoki and Y. Taga, Science, 2001, 293, 269 CrossRef CAS.
- S. Soni, M. Henderson, J.-F. Bardearu and A. Gibaud, Adv. Mater., 2008, 130, 5018 Search PubMed.
- X. Chen and C. Burda, J. Phys. Chem. B, 2004, 108, 15449 Search PubMed.
- X. Chen and C. Burda, J. Am. Chem. Soc., 2008, 130, 5018 CrossRef CAS.
- F. Zuo, L. Wang, Z. Zhang, D. Borchardt and P. Feng, J. Am. Chem. Soc., 2010, 132, 11856 CrossRef CAS.
- X. Chen, L. Liu, P. Yu and S. Mao, Science, 2011, 331, 746 CrossRef CAS.
- X. Chen, L. Liu, Z. Liu, M. Marcus, W.-C. Wang, N. Oyler, M. Grass, B. Mao, P.-A. Glans, P. Yu, J. Guo and S. Mao, Sci. Rep., 2013, 3, 1510 CrossRef.
- L. Liu, P. Yu, X. Chen, S. Mao and D. Shen, Phys. Rev. Lett., 2013, 111, 065505 CrossRef.
- X. Liu, G. Zhu, X. Wang, X. Yuan and T. Lin, Adv. Energy Mater., 2016, 6, 1600452 CrossRef.
- S. Selcuk, X. Zhao and A. Selloni, Nat. Mater., 2018, 17, 923 CrossRef CAS.
- H. Liu, H. Ma, X. Li, W. Li, M. Wu and X. Bao, Chemosphere, 2003, 50, 39 CrossRef CAS.
- Z. Lu, C.-T. Yip, L. Wang, H. Huang and L. Zhou, ChemPlusChem, 2012, 77, 991 CrossRef CAS.
- K. Fukada, M. Matsumoto, K. Takeyasu, S. Ogura and K. Fukutani, J. Phys. Soc. Jpn., 2015, 84, 064716 CrossRef.
- Y. Ohashi, N. Nagatsuka, S. Ogura and K. Fukutani, J. Phys. Chem. C, 2019, 123, 10319 CrossRef CAS.
- Y. Li and Y. Gao, Phys. Rev. Lett., 2014, 112, 206101 CrossRef.
- A. Sutoh, Y. Okada, S. Ohta and M. Kawabe, Jpn. J. Appl. Phys., 1995, 34, L1379 CrossRef CAS.
- W. Mao, M. Wilde, S. Ogura, J. Chen, K. Fukutani, H. Matsuzaki and T. Terai, J. Phys. Chem. C, 2018, 122, 23026 CrossRef CAS.
- P. Scheiber, M. Fidler, O. Dulub, M. Schmid, U. Diebold, W. Hou, U. Aschauer and A. Selloni, Phys. Rev. Lett., 2012, 109, 136103 CrossRef.
- M. Fujimoto, M. Matsumoto, N. Nagatsuka and K. Fukutani, in preparation.
Footnote |
| † Present address: Department of Chemistry, Graduate School of Science, Kyoto University, Kyoto 606-8502, Japan. |
| This journal is © The Royal Society of Chemistry 2021 |


