 Open Access Article
DFT studies of the CH4-SCR of NO on Fe-doped ZnAl2O4(100) surface under oxygen conditions
Xiang Ren ,
Honglin Tan*,
Qian Jie and
Jianqi Liu
Faculty of Materials Science and Engineering, Kunming University of Science and Technology, Kunming 650093, China. E-mail: 852419171@qq.com
First published on 4th January 2021
Abstract
The catalytic reduction performance of NO on the surface of Fe-doped ZnAl2O4 (100) was calculated based on DFT. The adsorption of NO and other molecules, the change of reaction energy of CH4 and C2H4 as reducing agents, and the activation energy barrier of CH4 were studied. It was found that the best adsorption energy of NO is −2.166 eV. Compared with Al and Zn sites, doped Fe atoms are better adsorption catalytic sites. At temperatures of 300 K and 600 K, the molecules will move in the direction of the Fe atoms. O2 adsorption will repel NO, reduce its adsorption energy, and cause NO to lose electrons and be oxidized. The reaction enthalpy with CH4 as the reducing agent is −7.02 eV, and with C2H4 is −3.45 eV. Transition state calculations show that O reduces the dissociation barrier of CH4 by about 2 eV. The smaller adsorption energy and negative reaction enthalpy of the product indicate that the iron-doped ZnAl2O4 has a good catalytic NO potential. This also provides a basis for future research on the catalytic mechanism of different hydrocarbons.
1. Introduction
With economic development, pollution, especially air pollution, has been increasingly prevalent.1,2 A large amount of NOx emissions come from coal-fired power and the use of automobiles. NOx is a harmful gas and is the main cause of air pollution, particularly in terms of acid rain. It also causes photochemical smog and does harm to people's health.3,4 So it is important to study ways to cut NOx emissions. Selective catalytic reduction technology (SCR) is currently the most successful and widely used flue gas denitration technology. HC-SCR with hydrocarbon as a reducing agent has low catalytic reaction temperature and high catalytic activity in an oxygen-rich environment. The research and development of catalysts are among core issues surrounding SCR, and the performance of the catalyst directly affects the outcomes of NOx removal.5–9Finding catalysts and reducing agents that have better performances and lower prices are focuses of the current research. The metal oxide catalyst is a kind of catalyst that is easy to obtain and has good catalytic properties. A complex oxide is composed of two or more metal oxides. It has better properties than a single oxide, with better stability, corrosion resistance, higher-temperature resistance, as well as more hardness compared with other properties. The development of composite oxides including spinel has become an important research area in the field of catalysis today. At present, spinel-type catalysts have a wide range of catalytic activation temperatures, good dispersibility, thermal stability, and hydrothermal stability, and are particularly suitable for tail gas treatment of oxygen-rich lean burn.10–16 He et al.17 studied the selective catalytic reduction of NOx by BaAl2O4 spinel under oxygen. The results show that at 673 K, the presence of oxygen reduces the light-off temperature of soot and promotes the conversion of NOx-N2. Xu et al.18 stated that 0.05Pd-doped MAl2−xO4 (M = Co, Cu, Zn) significantly improved the conversion of NO removal at 100–300 °C and 2% oxygen. It has been found that O2, which is ubiquitous in the air, has an inevitable effect on the catalytic removal of NOx.
In recent years, DFT calculation has been very extensive in predicting the structure and performance of catalysts.19,20 For example, two-dimensional materials as single-site catalysts have been successfully designed for a variety of chemical reactions.21–24 The adsorption performance is closely related to the catalysis.25–28 At present, the adsorption performance of NOx on the spinel surface is calculated based on the first-principles method.29–33 The effects of spinel-catalyzed species adsorption on the surface activity are investigated. Jiang et al.34 used the first-principles VASP software to study the related properties of NO adsorbed on the surface of CuFe2O4(100) by N and O ends, respectively. Zou et al.27 calculated the adsorption properties of NH3 on the ZnFe2O4 surface. Xiang35,36 found that the property of NO2 and NO adsorbed on ZnGaAlO4(100) surface.
An important member of the AB2O4 spinel oxide family is ZnAl2O4, which is called zinc aluminate. This material is a wide band-gap material with an energy gap of about 4 eV at room temperature. ZnAl2O4 has many interesting properties, making it an ideal choice for use in different potential fields. At present, there are few studies on the catalytic reduction of NO by aluminum–zinc spinel. The doping of transition metal elements has a significant improvement in the catalytic effect. In this paper, Fe-doped ZnAl2O4 is used as a catalyst to study the adsorption performance of NO and other gas molecules on the (100) surface by density functional theory. Then the energy change of the surface reaction and the dehydrogenation barrier of CH4 were calculated. This study attempted to delve into its catalytic mechanism, studying whether it can be used as a good catalyst, and the role of oxygen in the reaction.
2. Computational details and crystal structure
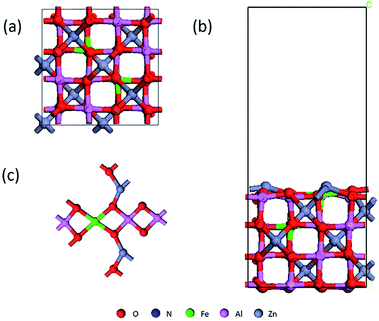
The First-principles calculations were conducted using Materials-Studio with exchange-correlation potential effects treated by the generalized gradient approximation (GGA) by Perdew–Burke Ernzerhof (PBE). The Dmol3 module of Material Studio based on density functional theory is used to calculate the adsorption structure and electronic structure. To facilitate the geometry optimization progress, the convergence criteria for the energy, force, and displacement were set at 1.0 × 10⁻⁵ Ha, 0.001 Ha Å−1, and 0.001 Å, respectively. The Brillouin zone was set at 3 × 3 × 1. The calculation uses a spin non-limiting method, with a valence electron wave function and a polarization function plus a double-valued basis set expansion (DNP). For Zn, Al, Fe, O, N atoms, effective core potential treatment (ECP) was adopted and Al-3s3p, Zn-3p3d4s, Fe-3d4s were treated as valance electrons states. A super-soft description was used between core and valence electrons. To balance the computational cost and accuracy of the calculations, a Hexadecapole polarization potential deployment was used with a Fermi tailing effect of 0.008 Hartree and an orbital intercept radius of 4.8 Å. To test the stability of NO molecules on the surface at ambient temperature, ab initio MD as implemented in Dmol3 simulations have been carried out. NVT (N, V, and T are the constant number of atoms, constant volume, and constant temperature, respectively) ensemble is selected and the Nose–Hoover thermostat method is used to control the temperature at 300 K without external pressure in the calculation. The simulation time step is set at 1 fs and the total simulation time is 1.5 ps to enable the calculation finish within a reasonable time range. The transition states were located using the complete linear synchronous transit/quadratic synchronous transit (LST/QST) method. And the frequencies of them are examined to confirm the validity.We first calculated the lattice structure of ZnAl2O4, a = 8.2188, b = 8.1843, c = 8.2335; α = β = γ = 90.0°, which is in good agreement with other data. We know that there are tetrahedral and octahedral positions in the crystal lattice, and Fe can replace Zn and Al atoms respectively. Nimai Pathak found that iron tends to occupy tetrahedral sites when doped at low concentrations. M. A. Lahmer also found through calculations that replacing aluminum with iron atoms is more stable than replacing zinc.37,38 Considering that it is easier to dope on the surface, we choose to dope Fe to Al sites near the surface, as shown in Fig. 1(a).39 The lattice constant of Fe-doped ZnAl2O4 (the following are expressed with Fe/ZnAl2O4) is slightly increased, and the lattice is still a face-centered cubic structure. For all the figures in this article: red for O, blue for N, green for Fe, pink for Al, and gray for Zn. We cut the surface of the low-index surface (100) and chose to expose the indicator layer with more metal atoms because it is more beneficial to the catalytic reaction.
The vacuum region thickness of 15 Å was chosen to eliminate the interaction effects of the neighboring slab. The optimized structure is shown in Fig. 1(b), and then we perform the adsorption calculation. The expression of the adsorption energy is:
| Eads = Emolecule+slab − Eslab − Emolecule |
Among them, Emolecule+slab, Eslab, and Emolecule are the total energy of the adsorbed molecules and surface models, the energy of the surface model, and the energy of a single adsorbed molecule respectively.
3. Results and discussion
Two kinds of stable adsorption structures were obtained by optimizing the adsorption of NO on the surface of Fe/ZnAl2O4: (1) the adsorption configuration of N-down adsorption, as shown in Fig. 2(a–c); (2) the adsorption configuration of O-down adsorption, as shown in Fig. 2(d–f). It can be seen from Fig. 2 the N or O atoms have different adsorption bond lengths on the metal atoms. Among them, the N–Fe adsorption bond has the shortest length, and the N-end adsorption on the Fe site has the strongest adsorption strength in single-ended adsorption. This is consistent with Xiang Chao's research on ZnGaAlO4(100) and Pâmella's research on Co3O4(100) surface.35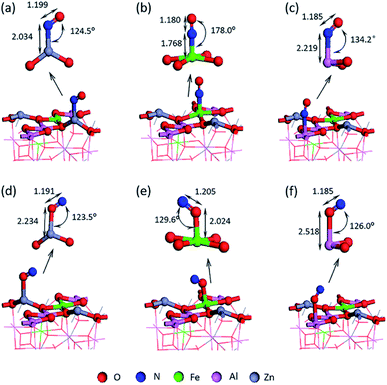 | ||
| Fig. 2 Single-ended adsorption structure of NO adsorbed on the surface (a) Zn–NO; (b) Fe–NO; (c) Al–NO; (d) Zn–ON; (e) Fe–ON and (f) Al–ON. | ||
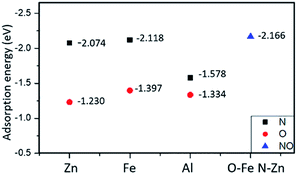
It can be seen from Fig. 3 that the adsorption energy of the O terminal of NO is −1.230 eV to −1.397 eV, while the adsorption energy at the N terminal is higher, the value is −1.578 eV to −2.118 eV. The positive adsorption energy is expressed as an endothermic process, and the adsorption structure is thermodynamically unstable. All the adsorption energy is negative, indicating that the process is exothermic, and the corresponding adsorption structure is stable.
The bonding mechanism diagram of NO molecule is shown in Fig. 4. (a) is the PDOS of the N and O atoms before the adsorption of NO molecules, and the 3d orbital of the surface Fe, (b) the PDOS diagram of the O-end adsorption on Fe, and (c) the PDOS diagram of the N-end adsorption on Fe. It can be seen that the Fe 3d on the surface of Fe/ZnAl2O4 (100) has an energy level on both sides of the Fermi surface. After adsorption, the 3d peak of Fe is severely cleaved, and the p-orbital of NO and the 3d orbital of Fe atom are strongly hybridized near the Fermi surface, and the energy levels are all shifted to the left, demonstrating that the adsorption produces a strong interaction. Moreover, the intensity of the Fe-3d peak becomes small, which means that electrons are transferred from the surface Fe to the NO molecule. According to the change of static charge value, the charge changes of the seven kinds of NO adsorbed on the surface structure in Fig. 2 are −0.132 e, −0.112 e, −0.155 e, −0.161 e, −0.230 e, −0.145 e, −0.247 e. It also proves that charge is transferred from the surface to the gas molecules.
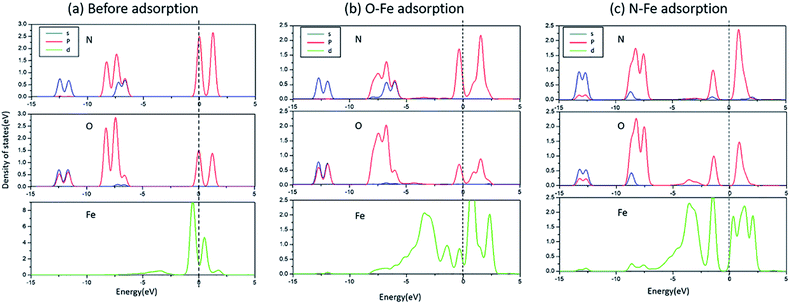 | ||
| Fig. 4 The PDOS of N, O, and Fe in different situations (a) before adsorption; (b) O–Fe adsorption; (c) N–Fe adsorption. | ||
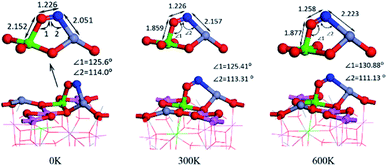
We calculated the adsorption energy of different double-end adsorption on the surface and found that it is most stable when adsorbed by the N–Zn O–Al structure (as shown in Fig. 5(a)). It has the largest adsorption energy of −2.166 eV. At this time, the N–O bond length is 1.226 Å. Compared with the free state NO, the N–O bond length is 0.062 Å (the maximum elongation), and the surface NO has a strong interaction with the surface. Fig. 5 shows the calculated molecular dynamics at 300 K and 600 K. It was found that as the temperature increased, the molecules tilted towards Fe atoms. Generally, high temperature will increase the atomic distance and weaken the strength, but the Fe–O bond length even decreases at 300 K, which may prove that Fe atoms have a better high-temperature adsorption performance.
Fig. 6(a) shows the most stable adsorption state of a single O2 on the Fe/ZnAl2O4 (100) surface. We intend to study the catalytic effect under oxygen-rich conditions, so we would consider the effect of adsorption on NO in the presence of oxygen. First, we calculated the adsorption energy of oxygen in different sites and found the best adsorption site. When O2 is adsorbed on Fe, the adsorption bond length is the shortest and the adsorption capacity is the strongest. The adsorption energy can reach −4.21 eV, and the distance between O and surface Fe is 1.952 Å, which is the shortest among all adsorption sites. The distance between the two oxygen atoms is 1.289 Å, which is 0.063 Å longer than the 1.226 Å before adsorption. This is due to the increase in bond length caused by the attraction of the surface to the molecules. We performed a co-adsorption calculation and the results are shown above. Fig. 6(b) shows the structure after the co-adsorption of NO and O2. The NO–N end is adsorbed at the Zn position, which is consistent with the original. The N–Zn distance is 2.122 Å, and the distance between NO is 1.176 Å. Compared with the single adsorption NO, the intramolecular distance becomes shorter, and the distance from the surface Zn becomes longer. The reason may be that the co-adsorption of O2 causes a certain repulsion between the molecules. The NO single adsorption is preferably N–Zn O–Fe, and at this time, due to the presence of O2, the O atom of NO is not bent to this side, which proves that there is a repulsive effect. The total adsorption energy of the two molecules is −2.85 eV, which is lower than the adsorption energy of the two single adsorptions. The interaction between NO and O2 can be calculated by expression:
| Einter = Eslab+NO+O2 − Eslab+NO − Eslab+O2 + Eslab |
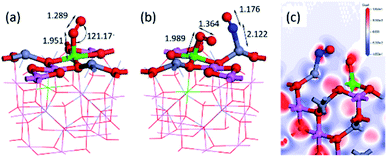 | ||
| Fig. 6 (a) Most stable O2 adsorption structure, (b) NO, O2 co-adsorption structure and (c) the differential charge density map. | ||
The charge distribution can be seen from Table 1 and Fig. 6(c) differential charge diagram. When NO is adsorbed on the surface, the surface metal atoms lose electrons, and NO gets electrons. However, when co-adsorbed with O2, O2 has a strong electron-withdrawing ability, and the electrons that lead to NO absorption are plundered by O2. The charge amount of NO is changed from −0.16 e to 0.022 e, and the charge of O2 is changed from −0.307 e to −0.584 e, which proves that the presence of O2 causes NO to be deactivated and oxidized. Many people have researched and found this phenomenon, such as Ingrit Castellanos found that the NO2 peak will appear when NO is adsorbed on Fe-HFER.40 Zekang Lyu et al.'s research on α-Fe2O3 (0 0 1) also found that the surface acidity increases after the transition metal is doped, and NO is more easily oxidized.41
| Eads (eV) | Einter (eV) | Charges change (|e|) | |
|---|---|---|---|
| NO | −2.16 | — | −0.12 |
| O2 | −4.21 | — | −0.37 |
| NO O2 | −2.85 | 1.184 | NO 0.022/O2 −0.584 |
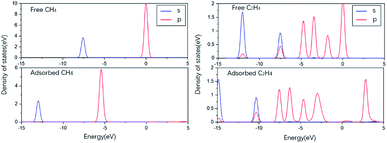
To predict the reaction of NO on its surface, we also calculated the adsorption of other gas molecules related to the reaction, such as CH4, C2H4, and the product N2 and H2O. The structure and key length data can be seen in Fig. 7 and Table 2. We can find that N2 and H2O as the product have low adsorption capacity on the surface, which is beneficial to the desorption process of the product and prevents its catalytic poisoning. The structural diagrams of CH4 and C2H4 show that they are far away from the surface and are not shown to be bonded. It can be seen from the PDOS diagram in Fig. 8 that the orbital shape of the C atom before and after adsorption does not change, but all shift to the low energy direction. This phenomenon can also be seen on the adsorption of many molecules.
| Eads (eV) | dm-s (Å) | |
|---|---|---|
| N2 | −0.58 | 2.265 |
| H2O | −1.18 | 2.225 |
| CH4 | −0.57 | 4.418 |
| C2H4 | −3.42 | 2.870 |
The adsorption performance of the reducing agent NH3 on various surfaces has been extensively calculated by many researchers. Its strong adsorption and charge transfer are effective prerequisites for molecular activation and promotion of reactions. However, many experimental studies have proved that CH4 is one of the good reducing agents, even if it has poor adsorption. We can use the following method to do a brief verification.
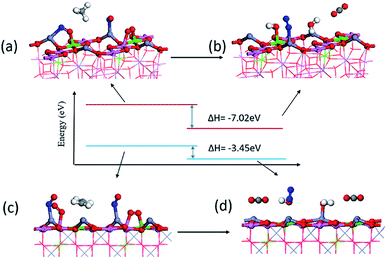
As shown in Fig. 9, since it is difficult to adsorb many molecules on the surface of a single unit cell at the same time, we established a 2 × 1 unit cell surface model to adsorb the reactant product molecules according to their stable adsorption sites. The total energy change before and after the surface reaction can be obtained to understand the difficulty of the reaction to a certain extent. The reaction from (a) to (b) is CH4 + 2NO + O2![[double bond, length as m-dash]](https://www.rsc.org/images/entities/char_e001.gif) N2 + 2H2O + CO2. The calculated reaction enthalpy becomes −7.02 eV, which is a relatively high value. Prove that the reaction is easy to proceed. The reaction from (c) to (d) is C2H4 + 2NO + 2O2
N2 + 2H2O + CO2. The calculated reaction enthalpy becomes −7.02 eV, which is a relatively high value. Prove that the reaction is easy to proceed. The reaction from (c) to (d) is C2H4 + 2NO + 2O2![[double bond, length as m-dash]](https://www.rsc.org/images/entities/char_e001.gif) N2 + 2H2O + 2CO2, and the reaction enthalpy change is only −3.45 eV. Gibbs free energy is the best parameter to measure whether the reaction can proceed, but the substances before and after the reaction are all four molecules adsorbed on the surface. The adsorption process is caused by electron transfer and attraction on the surface. The desorption of the final product is caused by the increase in entropy at a certain temperature. The enthalpy change shows the energy change of the reaction after the molecules are adsorbed on the surface.
N2 + 2H2O + 2CO2, and the reaction enthalpy change is only −3.45 eV. Gibbs free energy is the best parameter to measure whether the reaction can proceed, but the substances before and after the reaction are all four molecules adsorbed on the surface. The adsorption process is caused by electron transfer and attraction on the surface. The desorption of the final product is caused by the increase in entropy at a certain temperature. The enthalpy change shows the energy change of the reaction after the molecules are adsorbed on the surface.
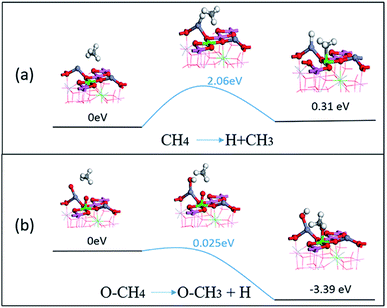
From the adsorption and dissociation barriers of CH4 on the surface, it can be seen that methane is a stable molecule, which is difficult to activate in the reaction. As shown in Fig. 10(a), CH4 removes an H atom from the surface, and the energy barrier of 2.06 eV needs to be overcome, and the –CH3 energy of the subsequent structure is also greater than the original molecule. This proved that its molecules will not activate and decompose on the surface. But the presence of oxygen can greatly reduce the decomposition barrier. As shown in Fig. 10(b), surface oxygen atoms can come from the decomposition of oxygen or diffuse to the surface from the spinel lattice. The CH4 dissociates an H in this case and only needs a 0.025 eV barrier and the energy of the subsequent adsorption state is also more stable, at −3.39 eV. The presence of oxygen atoms on the surface will greatly promote the activation and dissociation of CH4, which in turn will cause subsequent reduction reactions with NO or nitrate.
Finally, the general process of NO catalyzing on the Fe/ZnAl2O4 surface is shown in Fig. 11. Oxygen can promote the formation of nitrates from NO, and it can also promote the activation and decomposition of CH4. Then the two have subsequent reactions, gradually reducing to produce N2, H2O, and CO2.
4. Conclusions
The adsorption configuration of NO, and other molecules on the surface of Fe/ZnAl2O4 (100) was constructed based on DFT. The optimized structures and energy of each adsorption site were calculated. It is found that for NO, the adsorption effect at the N-terminus is stronger than that at the O-terminus, and the optimal adsorption site is the doped Fe atom. The adsorption effect of Fe end is still strong at 300 K and 600 K. It also describes the repulsion phenomenon that occurs when NO and O2 coexist. O2 attracts NO electrons, reducing its adsorption effect and producing an oxidation effect. Using CH4 and C2H4 as reducing agents, this study calculated the reduction enthalpy of NO in Fe/ZnAl2O4 (100). It is found that they are both exothermic reactions and prone to reactions. The stable CH4 molecules have better catalytic properties instead. We have studied its dissociation ability and found that the presence of O can lower the energy barrier of 2 eV and greatly promote the activation of CH4. The results show that Fe/ZnAl2O4 has a good potential for CH4-SCR to catalyze NO on oxygen conditions.Author contributions
Honglin Tan: conceptualization, methodology, funding acquisition, writing – review & editing, Xiang Ren: data curation, writing – original draft, formal analysis, Jie Qian: data curation, formal analysis, Investigation, Jianqi Liu: visualization, investigation, validation.Conflicts of interest
The authors declare that they have no conflict of interest.Acknowledgements
This work was supported by the National Natural Science Foundation of China (51662023).References
- S. Roy, M. S. Hegde and G. Madras, Appl. Energy, 2009, 86, 2283–2297 CrossRef CAS.
- Y.-q. Wang, X.-f. Yan, W. Xiao and Y.-x. Shao, Bull. Korean Chem. Soc., 2017, 38, 625–631 CrossRef CAS.
- T. Boningari and P. G. Smirniotis, Curr. Opin. Chem. Eng., 2016, 13, 133–141 CrossRef.
- P. Granger and V. I. Parvulescu, Chem. Rev., 2011, 111, 3155–3207 CrossRef CAS.
- M. Kantcheva and A. S. Vakkasoglu, J. Catal., 2004, 223, 352–363 CrossRef CAS.
- M. Fu, C. Li, P. Lu, L. Qu, M. Zhang, Y. Zhou, M. Yu and Y. Fang, Catal. Sci. Technol., 2014, 4, 14–25 RSC.
- F. Gao, X. Tang, H. Yi, S. Zhao, C. Li, J. Li, Y. Shi and X. Meng, Catalysts, 2017, 7, 199 CrossRef.
- C. Niu, J. Niu, S. Wang, Z. Wang, S. Dong, H. Fan, Y. Hong and D. Liu, Catal. Commun., 2019, 123, 49–53 CrossRef CAS.
- G. Xu, J. Ma, L. Wang, W. Xie, J. Liu, Y. Yu and H. He, Appl. Catal., B, 2019, 244, 909–918 CrossRef CAS.
- S. Yang, J. Li, C. Wang, J. Chen, L. Ma, H. Chang, L. Chen, Y. Peng and N. Yan, Appl. Catal., B, 2012, 117–118, 73–80 CrossRef CAS.
- M. Zawadzki, W. Walerczyk, F. E. López-Suárez, M. J. Illán-Gómez and A. Bueno-López, Catal. Commun., 2011, 12, 1238–1241 CrossRef CAS.
- S. G. Menon, K. S. Choudhari, S. A. Shivashankar, C. Santhosh and S. D. Kulkarni, J. Alloys Compd., 2017, 728, 1083–1090 CrossRef CAS.
- D. Fino, N. Russo, G. Saracco and V. Specchia, J. Catal., 2006, 242, 38–47 CrossRef CAS.
- M. Yuan, Y. Su, W. Deng and H. Zhou, Chem. Eng. J., 2019, 375, 122091 CrossRef CAS.
- D. Yadav, P. Singh and R. Prasad, Int. J. Hydrogen Energy, 2018, 43, 5346–5357 CrossRef CAS.
- M. A. Lahmer, Surf. Sci., 2018, 669, 189–197 CrossRef CAS.
- H. Lin, Y. Li, W. Shangguan and Z. Huang, Combust. Flame, 2009, 156, 2063–2070 CrossRef CAS.
- C. Xu, W. Sun, L. Cao, T. Li, X. Cai and J. Yang, Chem. Eng. J., 2017, 308, 980–987 CrossRef CAS.
- L.-M. Y. Jin-Hang Liu and E. Ganz, ACS Sustainable Chem. Eng., 2018, 6, 15494–15502 CrossRef.
- J. Yang, X. L. Wang, Y. Qu, X. Wang, H. Huo, Q. Fan, J. Wang, L.-M. Yang and Y. Wu, Adv. Energy Mater., 2020, 10, 2001709 CrossRef CAS.
- L.-M. Yang, V. Bačić, I. A. Popov, A. I. Boldyrev, T. Heine, T. Frauenheim and a. E. Ganz, J. Am. Chem. Soc., 2015, 137, 2757–2762 CrossRef CAS.
- Y. Z. Bingyi Song, H.-M. Yang, Ji-H. Liao, Li-M. Yang, X.-B. Yang and E. Ganz, J. Am. Chem. Soc., 2019, 141, 3630–3640 CrossRef.
- J.-H. Liu, L.-M. Yang and E. Ganz, J. Mater. Chem. A, 2019, 7, 3805–3814 RSC.
- J.-H. Liu, L.-M. Yang and E. Ganz, J. Mater. Chem. A, 2019, 7, 11944–11952 RSC.
- D. Fang, D. Li, F. He, J. Xie, C. Xiong and Y. Chen, Comput. Mater. Sci., 2019, 160, 374–381 CrossRef CAS.
- D. Ren and K. Gui, Appl. Surf. Sci., 2019, 487, 171–179 CrossRef CAS.
- C.-y. Zou, W. Ji, Z. Shen, Q. Tang and M. Fan, Appl. Surf. Sci., 2018, 442, 778–786 CrossRef CAS.
- X. C. Li and H. W. Gao, Materials, 2019, 12, 1379 CrossRef CAS.
- B. Zhu, Q. Fang, Y. Sun, S. Yin, G. Li, Z. Zi, T. Ge, Z. Zhu, M. Zhang and J. Li, J. Mater. Sci., 2018, 53, 11500–11511 CrossRef CAS.
- Z. Artuc, H. Ustunel and D. Toffoli, RSC Adv., 2014, 4, 48492–48506 RSC.
- H. Gao and Z. Liu, RSC Adv., 2017, 7, 13082–13091 RSC.
- L. P. Cui, J. T. Liu, S. Z. Liu, M. F. Wang, Z. H. Gao, Z. J. Zuo and W. Huang, J. Mol. Model., 2018, 24, 65 CrossRef.
- Z. M. Liu, L. L. Ma and A. S. M. Junaid, J. Phys. Chem. C, 2010, 114, 4445–4450 CrossRef CAS.
- Z. Jiang, W. Zhang, W. Shangguan, X. Wu and Y. Teraoka, J. Phys. Chem. C, 2011, 115, 13035–13040 CrossRef CAS.
- C. Xiang, H. Tan, J. Lu, L. Yu, P. Song, C. Zeng, D. Zhang and S. Tao, Phys. Scr., 2014, 89, 075401 CrossRef.
- C. Xiang, H. Tan, J. Lu, L. Yu, P. Song, C. Zeng, Y. Liang, S. Tao and Z. Chen, Appl. Surf. Sci., 2015, 349, 138–146 CrossRef CAS.
- M. A. Lahmer, Comput. Condens. Matter, 2019, 20, e00387 CrossRef.
- N. Pathak, S. K. Gupta, K. Sanyal, M. Kumar, R. M. Kadama and V. Natarajana, Dalton Trans., 2014, 43, 9313–9323 RSC.
- A. B. F. Zerarga, R. Khenata and S. Bin-Omran, Solid State Sci., 2011, 13, 1638–1648 CrossRef.
- O. M. Ingrit Castellanos, Appl. Catal., B, 2018, 223, 143–153 CrossRef.
- S. N. Zekang Lyua, C. Lua, G. Zhaob, Z. Gonga and Y. Zhuc, Fuel, 2020, 267, 117147 CrossRef.
| This journal is © The Royal Society of Chemistry 2021 |

