 Open Access Article
Dipole moments of conjugated donor–acceptor substituted systems: calculations vs. experiments†
Vladimir Lokshina,
Mark Sigalovb,
Nina Larina‡
a and
Vladimir Khodorkovsky *a
*a
aAix Marseille Université, CNRS, CINaM UMR 7325, 13288, Marseille, France. E-mail: khodor@cinam.univ-mrs.fr
bDept. of Chemistry, Ben-Gurion Univ. of the Negev, Beer-Sheva, 84105, Israel
First published on 4th January 2021
Abstract
We find that quantum mechanical calculations using B3LYP/aug-cc-pVTZ model chemistry involving anharmonic correction on simple conjugated organic compounds without rotating moieties provide the dipole moment values and molecular geometries with high accuracy. In the presence of one or two conjugated electron donating or accepting substituents capable of hindered rotation, the calculated dipole moments reproduce the experimental results equally well only in the cases when the experiments were done at the temperatures at which rotation of substituents remains hindered. In order to reproduce the experimental dipole moments determined at higher temperatures, a model assuming free (unhindered) rotation should be applied. In these cases, the contribution of each rotamer is equal and using anharmonic correction is not necessary. The APFD functional produces similar results and the M062X functional yields larger deviations from the experimental data. The other methods, like HF and MP2, are the least accurate with the basis sets usually employed for interpreting the experimental data.
Introduction
The dipole moment (DM) of organic compounds is an important quantity describing two opposite charges separated by a distance and thus characterizing the electron density distribution within the molecules. Since the first experimental determinations performed about 100 years ago, the DMs have been determined for most common organic compounds and their values are tabulated in a number of reference books.1,2 The dependence of the DMs on molecular structures gave rise to such important chemistry concepts as inductive and mesomeric effects. The experimental methods for determination of DMs and their use in stereochemical analysis and the relationship to the electronic structures are discussed in detail in ref. 3 and references therein.The experimental determination of DMs is based on orientation of polar molecules in an applied electric field and the dipole moment values can be extracted from the results of measuring the dielectric constants or analyzing microwave spectra.4 The most accurate DMs are determined using the Stark effect in the gas phase. Indeed, the reliable data can be obtained when the intermolecular interactions are excluded.4 Therefore, the experiments in the gas phase at low pressures can be regarded as the most reliable, although even under these conditions the possibility of intermolecular interactions can not be completely excluded. The majority of experimental DMs reported before 1990's were determined using benzene as a solvent. Depending on the solute nature, intermolecular interaction stemming from dipole association, hydrogen bonds formation (in particular “dioxane effect”), intermolecular charge transfer, etc., can influence the experimental values of dipole moments.
The interest toward the conjugated donor–acceptor substituted systems (push–pull derivatives) during the past three decades gave rise to numerous investigations on their nonlinear optical properties and provided a wealth of the experimentally determined molecular DM, polarizability and hyperpolarizability values.5
During the past three decades, quantum mechanical calculations were extensively employed for interpretation of the experimental results and design of organic chromophores with large NLO response. Calculations of the DMs and hyperpolarizabilities using semiempirical, ab initio HF, MP2 and various DFT-based methods on push–pull molecules involved two main approaches: variation of methods, especially, finding the best functional for the DFT6–8 calculations and variation of basis sets9,10 for geometry optimization and final electric properties calculation.
Thus, for a series of NLO chromophores, the model chemistries B3LYP/STO-3G, AM1 and MP2/6-31 were recommended with a warning that B3LYP with a larger basis showed larger errors.6 Alternative attempts to fight the apparent overestimation of the DFT methods involved using CAM-B3LYP and M05-2X functionals combined with thorough conformational search7 and optimal tuning the hybrid variants of PBE functional8 to better reproduce the MP2 calculation results. A general conclusion from the first approach is that the conventional exchange-correlation functionals are not suitable for evaluation of DMs of push–pull molecules owing to the large overestimation of the degree of charge transfer,9,10 and the calculations of the second polarizability afforded “almost catastrophic” results.9
The second approach suggests adjusting basis sets for H, C, N and O atoms to reproduce the experimental dipole moments, polarizabilities and hyperpolarizabilities.11,12 Using B3LYP functional with NLOIII basis set afforded DM and hyperpolarizability of polyatomic molecules in good agreement with the experiments.11
Another experimental approach closely related to the dipole moment determinations and serving as an alternative quantitative evaluation of the electron density distribution within molecules is variable temperature NMR spectroscopy (dynamic NMR or D-NMR).13 This technique allows to determine barriers to internal rotation of flexible groups in the range of about 4.5–23 kcal mol−1. Separate NMR signals of the identical nuclei in the different magnetic environment observed at temperatures at which molecular motion is slow, i.e., the time spent by the nuclei in different positions is longer than the interconversion time. When the temperature increases, the signals become broader and then coalesce into one broad signal that finally becomes narrow at fast motion (typically, several thousand rotations per second). The coalescence temperature corresponds to the rate of exchange that is identical to the difference (Δν, Hz) in the peak frequencies (where NMR is no longer able to distinguish frequencies). At the coalescence temperature Tc, the interconversion rate constant k(Tc) can be calculated as k(Tc) = πΔν/√2, where Δν is measured without exchange at low temperatures. The first experiments on evaluation of substituent rotational barriers in push–pull molecules were carried out about 60 years ago. For instance, the rotational barriers of the formyl group at the coalescence temperatures (Tc) in benzaldehyde, 4-methoxybenzaldehyde and 4-N,N-dimethylaminobenzaldehyde are 7.9 (Tc = 150 K), 9.2 (Tc = 174 K) and 10.8 (Tc = 202 K) kcal mol−1,14 respectively, demonstrating the increase in intramolecular charge transfer from the electron donating phenyl-, methoxy- and dimethylamino-groups to the accepting carbonyl group. It is worth of noting here that the barriers to rotation determined by microwave spectra are sometimes considerably lower than those determined by D-NMR and calculated by quantum mechanical methods, which was the subject of a polemics15 that lasted 10 years.
Recently, we found that quantum mechanical calculations of barriers to rotation within push–pull π-conjugated molecules involving strong electron donors (D) and acceptors (A) can reproduce the experimentally determined barriers within 0.28–0.19 kcal mol−1 using B3LYP or APFD functionals only when the explicit rotation of the substituents is taken into account.16 Only in this case the experimental barriers can be reproduced within the experimental error using B3LYP or APFD functionals with basis sets above + G(2d,p) or aug-cc-pVDZ, whereas M062X functional and MP2 fail with the same basis sets or larger. This approach implies that at least above the Tc at the temperatures when the internal hindered rotation becomes unhindered (free fast rotation) all rotamers are equally present.
There are a number of indications that rotation of the moieties within molecules with hindered internal rotation at temperatures above Tc (above the barriers to internal rotation) occurs nonstatistically. Thus, low-resolution microwave spectra of such compounds show more bands than expected.17 The authors explain this phenomenon by the presence of the overlapping bands of the species freely rotating above the barrier to rotation. The possibility of nonequilibrium behavior of internally rotating species have been discussed in ref. 18 and the authors cautiously conclude that “until more studies are performed and we have a better understanding of nonstatistical effects on low-energy processes, we believe it is prudent to report and interpret results of conformational interconversion studies assuming the kinetics is statistical but to always be aware that this approach may not always be quantitatively correct”. The authors, however, did not take into account the influence of temperature. To the best of our knowledge, no systematic studies in this direction have hitherto been undertaken. Most of the microwave spectra analyzed so far had been recorded at unknown temperatures.
Here we report on the results of our quantum mechanical investigations and further NMR experiments to verify the applicability of the above concept for calculations of the DM to a series of organic polar molecules.
Computational and experimental details
All calculations were carried out using Gaussian 16 software19 as described previously.16 Anharmonic frequency calculations were done with geometry optimized structures using opt = vtight keyword. For computational results throughout the paper we use the notation of Gaussian output: Se for equilibrium, Sz for vibrationally averaged at 0 K and Sa for vibrationally averaged at 298 K interatomic distances. The indices GS and TS denote the values calculated for ground and transition states, respectively.The NMR spectra were recorded on the Bruker AMX-400 spectrometer at 400.1 MHz.
Results and discussion
Comparison of the experimental DMs with the calculated values is not a simple task, but one involving several underwater stones. Specific solvent–solute interactions, such as the formation of the HBs, can strongly influence the measured DM and the data determined in solvents that exhibit hydrogen bond accepting (HBA) and donating (HBD) properties cannot be reproduced with high accuracy by the QM calculations, especially when a weak donor is conjugated with a strong acceptor. For instance, nitrobenzene molecule, which can be considered as a combination of a weak donor (the phenyl group) conjugated with a strong acceptor (the nitro group) involving no bridge and one rotor serves as a good example. Thus, there are more than 80 DM values provided in ref. 1 and 2 for this compound: 0.71–4.69 D for liquid, 3.89–4.08 D in hexane, 3.90–4.4 D in benzene, 3.17–3.24 D in chloroform, 3.88–4.05 D in carbon tetrachloride, 4.28 in xylene, etc. The DMs of 4.22 and 4.28 determined in the gas phase20,21 corrected in ref. 2 seem to be the most reliable, although intermolecular interaction cannot be fully excluded (4.4 D is also mentioned in ref. 22). Any quantum mechanical calculation in any solvent using the PCM model gives the DM of nitrobenzene above 5 D and the experimental values below 4 D can with the high degree of certainty be ascribed to solvent–solute interactions or self-aggregation in less polar solvents.The aggregation phenomena can be expected as the H atoms of the phenyl ring with strong accepting substituents are HBD by themselves and the nitro group is an efficient HBA. The aggregation is also promoted by high concentrations of the solute molecules: the usual concentrations used for the measurements in solutions are between 10−1 to 10−2 M, that is 1–2 orders larger than usual concentrations in the NMR experiments. The ability of push–pull derivatives involving both strong electron donors and acceptors to form intermolecular HB is diminished, as they are stabilized by considerable intramolecular charge transfer.
Another source of errors is related to the possible presence of moisture. In this case, a large degree of intramolecular charge transfer in push–pull molecules with a carbonyl group as an acceptor can demonstrate negative solvatochromism explained by crossing the cyanine limit and converting into a betaine with full charge transfer (D–bridge–CH![[double bond, length as m-dash]](https://www.rsc.org/images/entities/char_e001.gif) O <–> D+
O <–> D+![[double bond, length as m-dash]](https://www.rsc.org/images/entities/char_e001.gif) bridge
bridge![[double bond, length as m-dash]](https://www.rsc.org/images/entities/char_e001.gif) CH–O−), not confirmed however by quantum mechanical calculations. A representative example is stilbazolium betaine, which loses the betaine character after thorough drying.23 Negative solvatochromism was apparently the result of the interplay of non-specific and specific interactions with more polar solvents.
CH–O−), not confirmed however by quantum mechanical calculations. A representative example is stilbazolium betaine, which loses the betaine character after thorough drying.23 Negative solvatochromism was apparently the result of the interplay of non-specific and specific interactions with more polar solvents.
After the absence of specific solvent–solute or solute–solute interactions is confirmed and the experimental data are regarded as reliable, the most important requirement for comparing the experimental DMs with the calculated ones is taking into account other experimental conditions, in particular the temperature. Obviously, both the zero-point corrected calculated DMs, preferably including the anharmonic correction and the temperature of the experiment should be considered, as molecular vibrations can strongly affect the DMs of flexible molecules.
In the subsections below we discuss the following issues:
– what is the most reliable model chemistry for calculating the DMs of the organic molecules not involving the rotating moieties;
– DMs calculations on organic molecules involving one rotating moiety;
– DMs calculations on D–A substituted organic molecules involving two rotating moieties separated by a bridge.
Model chemistries for calculating the DMs: a comparison
Recently, the results of DM calculations for several sets of inorganic and organic molecules using high-level density-fitted coupled-cluster (CC) methods, such as coupled-cluster singles and doubles (CCSD), and coupled-cluster singles and doubles with perturbative triples (CCSD(T)) along with a number of common DFT functionals and Hartree–Fock (HF) was published.24,25 The authors conclude24 that for all test sets considered, the CCSD(T) method provides substantial improvements over HF, by 0.076–0.213 D. Further, the results indicate that even though the performances of the common DFT functionals considered (B3LYP, BP86, M06-2X, and BLYP) are noticeably better than that of HF, their results are not comparable with the CC methods. Consequently, in the authors' opinion, these results demonstrate that the CCSD(T)/CBS level of theory provides highly accurate dipole moments, with its quality approaching the experimental results. Unfortunately, the calculated24 dipole moments correspond to the equilibrium structures (i.e., at the optimized molecular geometries) and compared with the experimentally determined dipole moments, mostly from ref. 26, which do not provide the experimental conditions and are sometimes averaged or not updated. Whereas geometry optimized structures can be compared with the semiempirical equilibrium interatomic distances re, obtained by taking into account rovibrational corrections,27 in general, the experimental dipole moments can be reproduced by calculations only after the vibrationally average structures at the respective temperatures are calculated. Therefore, the conclusions in ref. 24 can be misleading.Here we present the results of our DM calculations including the anharmonic frequency corrections on some simple conjugated molecules. In our opinion, suitable computation model chemistry should provide reasonable results not only by reproducing one select property like the DM, but also provide reasonable molecular geometries. Therefore, we also present here the calculated vs. experimental characteristic bond lengths (for the full tables of molecular geometries see the ESI†).
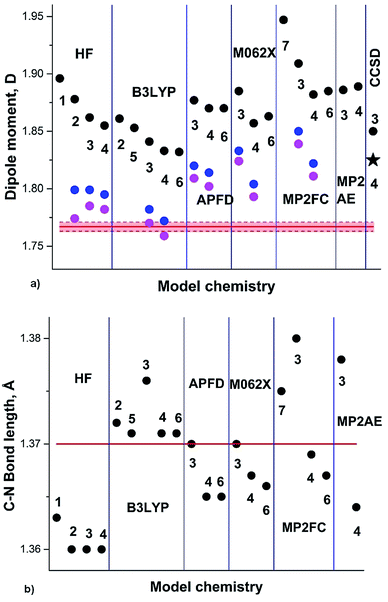
The most recent experimental DM of pyrrole (1) (Chart 1) determined in gas phase by the Stark effect is 1.767(2) D.28 The temperature at which the measurements were carried out is not indicated, but taking into account that pyrrole gas at 35 °C was injected into the spectrometer chamber through a pulsing nozzle and cooled down during expansion; we assume that it was close to or below the room temperature (RT). The summary of our calculations is shown in Fig. 1 (for the full data tables for this and other derivatives see ESI†).
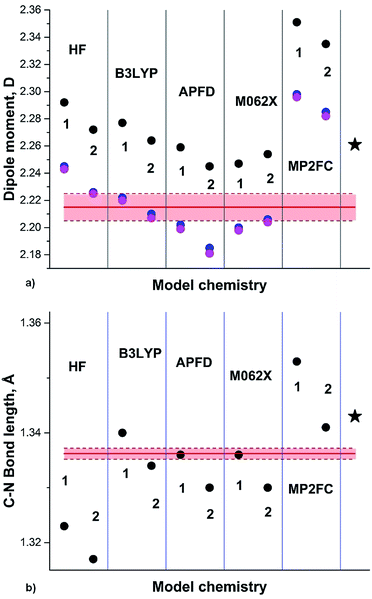 | ||
| Fig. 1 (a) Pyrrole experimental DM:28 red line; DM calculated on Se: black circles; at 0 K (Sz): blue circles; at RT (Sa): magenta circles; black asterisk: from .24 (b) Semiempirical C–N equilibrium bond length:29 red line; calculated on Se: black circles. Basis sets: 1: 6-31G(d); 2: 6-311+G(2d,p); 3: aug-cc-pVDZ; 4: aug-cc-pVTZ; 5: 6-311++G(2df,2p); 6: aug-cc-pVQZ; 7: 6-31+G(d,p). | ||
Only two methods approach the pink rectangular (showing the experimental errors): HF with relatively small basis and B3LYP with aug-cc-pVXZ, X = D, T. Unexpected is poor performance of APFD, M062X and, especially, MP2 methods. The C–N equilibrium bond length is reasonably reproduced by B3LYP, MP2FC/aug-cc-pVTZ, APFD and M062X with aug-cc-pVDZ, whereas HF and MP2AE apparently failed.
The DM of pyridine (2) in the gas phase determined by the Stark effect at −20 to 25 °C (ref. 30) amounts 2.215 ± 0.01 D. Our calculation results summary is presented in Fig. 2.
 | ||
| Fig. 2 (a) Pyridine experimental DM:30 red line; DM calculated on Se: black circles; at 0 K (Sz): blue circles; at RT (Sa): magenta circles; black asterisk: from .24 (b) Semiempirical C–N equilibrium bond length:29 red line; calculated on Se: black circles. Basis sets: 1: aug-cc-pVDZ; 2: aug-cc-pVTZ. | ||
The experimental augmented by B3LYP/6-311+G(3df,2pd) equilibrium C–N bond length re 1.3362(5) Å (semiempirical) is well reproduced by B3LYP functional, underestimated by HF, and overestimated by MP2FC and CCSD. Another experimental structure of pyridine, augmented by MP2/6-311++G(2d,2p)31 provided r0 and rs C–N bond lengths of 1.340(5) Å and 1.340(2) Å. This value correlates well with the calculated S0 geometries using aug-cc-pVTZ basis set: 1.338 Å (B3LYP), 1.335 Å (APFD), 1.334 Å (M062X) and 1.345 Å (MP2). The HF result underestimates this bond length (1.321 Å).
The above two examples suggest that B3LYP/aug-cc-pVTZ is a reliable model chemistry for calculating both DMs and molecular geometries.
Conjugated D–A derivatives involving one rotor
Assuming free unhindered rotation of substituents under conditions of fast motion (above Tc) in molecules with one rotor suggests a simple approximation: averaging the extreme dipole moments occurring during rotation as shown for benzaldehyde and formamide in Scheme 1. In the following discussion we denote these DM values as μavg. A more precise approximation requires calculation of the mean DM of all rotamers formed during rotation from PES with any desirable step, denoted by us as μmean. The changes in the C–C and C–N bond lengths during rotation are estimated the same way as ravg and rmean.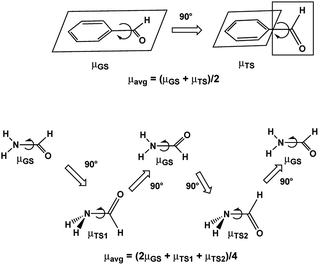 | ||
| Scheme 1 Dipole moments of rotamers formed upon rotation over C–CO bond of benzaldehyde and C–N bond of formamide. | ||
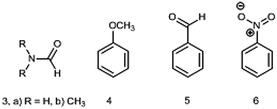
The DM of formamide (3, R = H) (Chart 2) is an interesting and instructive example. This compound is prone to self-association and solvation in solution owing to the formation of HBs with itself and/or solvents32,33 and the reliable information on a single molecule can be obtained only in the gas phase. The permanent interest in this molecule exists because it is the smallest molecule with the peptide bond rendering it important not only for biochemistry, but also in astrochemistry as a potential prebiotic molecule detected in space.34
Several gas-phase structures, experimental, semiempirical and calculated on high levels of theory are known for this compound (see ref. 35 and references therein). Paradoxically, to the best of our knowledge, only two experimental DM determinations were published. C. T. Zahn36 investigated free rotation within a series of simple organic compounds by measuring their DMs using conventional methods (permittivity and refractive index measurements). He found that at 150, 165 and 176 °C, the DM of 3a is constant and amounts 4.22 D. The author noticed that although a wider temperature range measurements were impossible owing to the low vapor pressure of 3a and its partial decomposition at the boiling point (192 °C), a comparison of the experimental DM with the calculated using the C–H, N–H, C![[double bond, length as m-dash]](https://www.rsc.org/images/entities/char_e001.gif) O and C–N bond moments proves free rotation over the C–N bond.
O and C–N bond moments proves free rotation over the C–N bond.
The second DM has been determined in 1957 (ref. 37),§ using the Stark effect to produce the DM of 3.714 ± 0.06 D. The considerable difference with the previous measurements36 was explained by possible decomposition of 3a at 150 °C, however, although the possibility of decomposition has been discussed and excluded in ref. 36, there is no indication of the temperature at which the measurements37 were carried out.
The C–N bond length r according to the same paper37 was 1.343 ± 0.007 Å. The authors concluded that 3a possesses a planar structure. In order to study the effect of isotopic substitution including 14N, the formamide microwave spectra were re-measured to yield the C–N bond length of 1.376 ± 0.010 Å.38 No data on the experiment temperature were given. A pyramidal model for formamide with two equilibrium configurations separated by a barrier of 1.06 kcal mol−1 was deduced. Later, a complete substitution rs structure including also 13C and 18O was determined39 affording a planar structure with the C–N bond length of 1.352 ± 0.012 Å. Once again, no information on the temperature was provided. The structure of formamide was determined also by gas electron diffraction at unknown temperature. The C–N bond length rg was found to be 1.368 ± 0.003 Å (ref. 40). High level calculations41 using MP2, MP4, CCSD and CCSD(T) and up to cc-pVTZ basis sets confirmed the planar equilibrium structure and produced the “best” theoretical estimate of the C–N bond length of 1.354(5) Å that according to the authors agrees very well with rs 1.352 Å (ref. 39) and suggests that other values rs 1.376 Å (ref. 38) and and rg 1.368 Å (ref. 40) are definitely too long. The high-resolution far-infrared spectrum of formamide was recorded at 400 K (ref. 42) and the large amplitude motion (LAM) analysis provided 1.3560(26) Å (model 1) and 1.3575(25) Å (model 2) for the C–N bond length. The most recent microwave spectrum of formamide was recorded at room temperature,43 but no structural data have been derived. The equilibrium C–N bond length re was estimated to be 1.3547 Å (ref. 44) and, more recently as 1.354(2) Å.35 The value of r0 was 1.3630 Å as provided in ref. 32.
The results of our calculations on the GS of formamide (3a) including the anharmonic correction are summarized in Fig. 3 and Table 1. The general trend observed in the case of pyrrole is also noticeable for formamide: HF, B3LYP and M062X dipole moments and C–N bond lengths converge quite rapidly with increasing basis set. Thus, the calculated DMs of 3a at RT using B3LYP/aug-cc-pVDZ, TZ and QZ are: 3.706, 3.636 and 3.640 D, respectively; for M062X/aug-cc-pVDZ, TZ and QZ the respective DMs are 3.637, 3.612 and 3.596 D; for MP2FC/aug-cc-pVDZ, TZ and QZ are 3.314, 2.968 and 3.450 D. The C–N calculated Se bond lengths are 1.362, 1.357 and 1.356 Å (B3LYP DZ, TZ and QZ) and 1.359, 1.355 and 1.354 Å (M062X) DZ, TZ and QZ). The C–N calculated Sa bond lengths are 1.376, 1.373 and 1.372 Å (B3LYP DZ, TZ and QZ) and 1.375, 1.373, 1.372 Å; M062X (DZ, TZ and QZ) and 1.392, 1.393 and 1.374 Å MP2FC (DZ, TZ and QZ) are in agreement with the experimental rs 1.376 Å (ref. 38), although the MP2FC requires large QZ basis set.
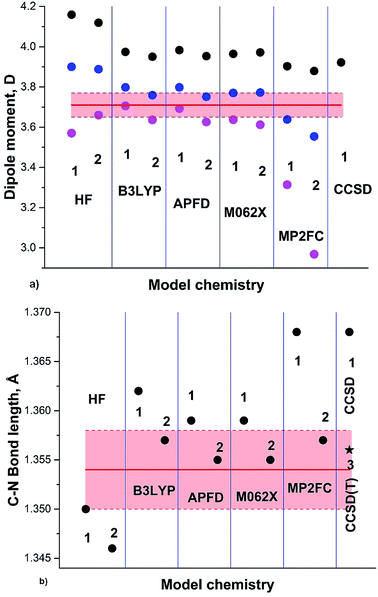 | ||
| Fig. 3 (a) Formamide (3a) experimental DM:37 red line; DM calculated on Se: black circles; at 0 K (Sz): blue circles; at RT (Sa): magenta circles. (b) Semiempirical C–N equilibrium bond length (re):35 red line; calculated on Se: black circles; black asterisk: from .41 Basis sets: 1: aug-cc-pVDZ; 2: aug-cc-pVTZ; 3: cc-pVTZ. | ||
| Model | μe | μz | μa | Se | Sz | Sa |
|---|---|---|---|---|---|---|
| a For other experimental bond lengths see the text. | ||||||
| HF | ||||||
| DZ | 4.159 | 3.900 | 3.570 | 1.350 | 1.364 | 1.375 |
| TZ | 4.119 | 3.888 | 3.657 | 1.346 | 1.359 | 1.368 |
| QZ | 4.104 | 3.883 | 3.680 | 1.345 | 1.359 | 1.366 |
![[thin space (1/6-em)]](https://www.rsc.org/images/entities/char_2009.gif) |
||||||
| B3LYP | ||||||
| DZ | 3.974 | 3.798 | 3.706 | 1.362 | 1.373 | 1.376 |
| TZ | 3.950 | 3.759 | 3.636 | 1.357 | 1.369 | 1.373 |
| QZ | 3.938 | 3.753 | 3.640 | 1.356 | 1.368 | 1.372 |
![[thin space (1/6-em)]](https://www.rsc.org/images/entities/char_2009.gif) |
||||||
| M062X | ||||||
| DZ | 3.964 | 3.773 | 3.637 | 1.359 | 1.371 | 1.375 |
| TZ | 3.972 | 3.772 | 3.612 | 1.355 | 1.367 | 1.373 |
| QZ | 3.945 | 3.746 | 3.596 | 1.354 | 1.367 | 1.372 |
![[thin space (1/6-em)]](https://www.rsc.org/images/entities/char_2009.gif) |
||||||
| MP2FC | ||||||
| DZ | 3.903 | 3.638 | 3.314 | 1.368 | 1.382 | 1.392 |
| TZ | 3.879 | 3.554 | 2.968 | 1.358 | 1.374 | 1.393 |
| QZ | 3.879 | 3.652 | 3.450 | 1.355 | 1.368 | 1.374 |
A large variety of the experimental structural data and the related discussions concerning the planarity of 3a stem apparently from the temperature dependence of the formamide structure, as the experiments were carried out at different and often not indicated temperatures. The gas-phase dynamic 1H-NMR spectra of [15N] formamide showed that the coalescence temperature Tc separating the slow and fast-exchange temperature ranges is about 326 K (53 °C)45 and ΔG≠298 = 16.0 ± 0.1 kcal mol−1.18 The barrier to rotation and Tc of formamide is noticeably lower than the one determined in gas phase for dimethylformamide (3b)46 and close to the one found for N,N-dimethylaminoacroleine, vinylog of 3b, in tetrachloroethane (this work) as shown in Fig. 4. Expectedly, the dependence of rate constants k on temperature can be fitted with high precision by an exponential function and the exponential growth of k at temperatures exceeding Tc can lead rapidly to the region of very large k values and rotational vibrations turn into full free rotation.
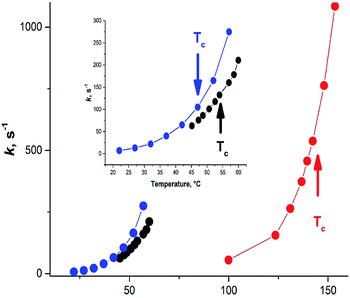 | ||
| Fig. 4 Dependence of the interconversion rate constant on temperature. Black circles: formamide (3a), from ;45 blue circles: N,N-dimethylaminoacroleine, this work; red circles: dimethylformamide (3b) from ref. 46. | ||
Therefore, the variety of experimental geometries available in the literature strongly depends on the temperature at which the experiments were carried out. Fast rotation over the C–N bond accompanied with pyramidalization of the NH2 group in 3a and elongation of the C–N bond will strongly affect the observed spectral patterns. Thus, the presence or absence of lines corresponding to several rotamers will depend on Tc of the investigated compound and the temperature of spectra recording. Interpretation of the gas phase IR spectra of 3a and the observation of several bands related to the out-of-plane mode required application of a special unsymmetrical LAM model.42 Notably, the IR spectra were recorded at about 400 K (127 °C), above the Tc and, therefore, this observation can be interpreted as the result of free rotation as well.
Now we can re-appreciate the second known value of the formamide DM of 3.22 D determined at 150 °C (423 K).36 The B3LYP/aug-cc-pVTZ frequency (with anharmonic correction) run at 423 K yielded DM of 3.542 D at this temperature. If we assume the hypothesis of free fast rotation over the C–N bond (Scheme 1), all rotamers formed upon rotation between 0 and 360° should be present at this temperature. The calculated at the same model chemistry DMs are 3.950 D for the ground planar state of 3a, 3.671 D for the first transition state TS1 and 1.449 D for TS2. The average DM of all co-existing species can be roughly estimated as the average of these values μavg = 3.255 D. A reasonably good fit to the experiment at 423 K supports the conclusion of free rotation over the C–N bond.36 We conclude that the delocalization errors of the approximate functional as B3LYP are at least negligible when the experimental temperatures are considered.
The following group of compounds, anisole (4), benzaldehyde (5) and nitrobenzene (6) are easier to analyze, as these compounds possess relatively low barriers to rotation and for two of them (4 and 5) the dipole moments using the Stark effect were determined at RT. The calculated in the gas phase barriers to rotation are ΔG≠298 = 3.06, 6.00 and 8.44 kcal mol−1, for 4, 5 and 6, respectively (B3LYP/aug-cc-pVTZ). The experimental value available for benzaldehyde (5) in vinyl chloride 7.9 kcal mol−1 corresponds to Tc = 150 K (−123 °C).14 Thus, Tc of these compounds are well below the RT and we might expect fast free rotation in all three compounds.
The phenyl group in monosubstituted benzene derivatives can be considered as a weak electron acceptor or weak electron donor depending on the substituents and 4–6 can serve as simple models of push–pull molecules. The available DMs measured by the Stark effect are: for anisole 4 (1.2623 (14) D47) and benzaldehyde 5 (3.214 ± 0.027 D;48 3.1397 (24) D47). The experimental DM values for nitrobenzene 6 determined only by the dielectric methods in the gas phase amount 4.22 ± 0.05 (442.1–548.7 K),21 4.27 ± 0.01 (402–523 K, practically constant),20 (as corrected in ref. 2). The value of 4.4 D was also reported in ref. 22 (Table 2).
The potential energy scans (PES) for 4–6 corresponding to the rotation of a substituent from 0 to 90° with steps of 10° and the respective curves of changes in the DM are shown in Fig. 1S (ESI†). Since at room temperature and above the molecules are above the rotation barriers, we can assume again that all possible rotamers are present and the measured DM will correspond to the mean DM of the rotamers from the PES (denoted as μmean). Considering the reproducibility of the experimental DM measurements, both μavg and μmean provide very good estimations of the dipole moments of 4–6. The experimental bond lengths are also reproduced satisfactorily by the calculated averaged GS and TS bond lengths (Table 3).
| Comp. | Se | Sz | Sa | SeTS | ravg | rexp |
|---|---|---|---|---|---|---|
| a Ref. 47.b Ref. 49.c Ref. 50.d Ref. 51.e ra,avg. | ||||||
| 4 | 1.418 | 1.421 | 1.406 | 1.380 | 1.372 | rs 1.381(4)a |
| rm 1.372(3) | ||||||
| 5 | 1.478 | 1.484 | 1.484 | 1.499 | 1.489 | rs 1.498(4)b |
| rg 1.479(4) | ||||||
| rm 1.492(3) | ||||||
| 6 | 1.477 | 1.485 | 1.485 | 1.479 | 1.478 | re 1.482(6)c |
| 1.487e | re 1.470(15) | |||||
| rs 1.4916(17) | ||||||
| rg 1.486 (4)d | ||||||
| rg 1.478 (13) | ||||||
It is noteworthy that the calculated for 4–6 values of DMs in the gas phase are expectedly always lower than those calculated in solvents. Thus, the calculated DMs of benzaldehyde (5) in benzene are μeGS = 4.033 D, μeTS = 3.237 and μavg = 3.64 D, higher than the values in the gas phase by about 0.45 D. The reported experimental values in this solvent are 2.78–2.99 D.1 This difference may be an indication of the solute–solvent or solute–solute specific interactions. Indeed, the phenyl group is a weak electron donor and strong electron accepting –HC![[double bond, length as m-dash]](https://www.rsc.org/images/entities/char_e001.gif) O group, being unable to participate in efficient intramolecular charge transfer can realize its potential as a HBA by interaction with aromatic hydrogen atoms of the benzene ring or the phenyl moiety of the neighboring molecules serving as a HBD.
O group, being unable to participate in efficient intramolecular charge transfer can realize its potential as a HBA by interaction with aromatic hydrogen atoms of the benzene ring or the phenyl moiety of the neighboring molecules serving as a HBD.
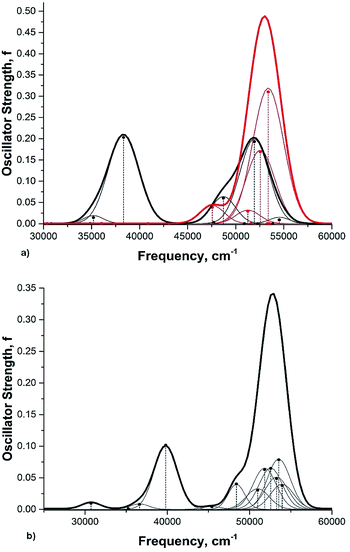
Rotation of the conjugated substituents should be considered also for interpretation of the electronic absorption spectra. For instance, the calculated gas phase absorption spectra of nitrobenzene (6) in the ground and transition states are shown in Fig. 5a. Neither does reproduce the experimental spectrum, whereas the averaged spectra of four rotamers with the nitro group coplanar to the benzene ring (GS), rotated by 30°, 60° and 90° (TS) (structures from the relaxed PES), Fig. 5b, exhibit all features of the experimental spectrum52,53 (Fig. 6). These results deserve a separate discussion owing to its importance for spectra interpretation and will be published elsewhere.
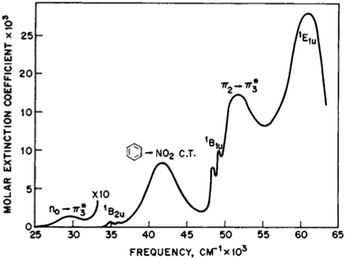 | ||
| Fig. 6 The experimental absorption spectrum of nitrobenzene (6) in the gas phase. From ref. 25, Elsevier LTD. All rights reserved. | ||
Conjugated D–A derivatives involving two rotors
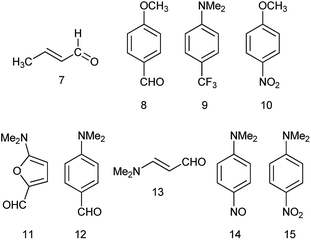
Previously, we demonstrated that the DMs of D-bridge-A type compounds involving the rotating D and A substituents roughly correlate with coefficients δA and (1 − δA) (Chart 3) derived from the three-state approximation and serving as estimates of the contributions of the neutral and polar mesomeric forms of push–pull derivatives.16 This approximate correlation neglects the contribution of the electron donating substituents as coefficient includes also the bridging moiety contribution as shown in Chart 3. The δ coefficients include the temperature effect as they are calculated using ΔG as defined in ref. 16. The three-state approximation (3S) requires calculating not only the ground (equilibrium) state (GS, one-state approximation, 1S) of such molecules, but also the transition states involved in rotation of the electron donating D, accepting A and both substituents (TSD, TSA and TSDA).16 Derivatives 7–15 (Chart 4) involving two rotors were selected for calculations and comparison with the available experimental data. For compound 7 the experimental DM measured in the gas phase is available. The calculated μGS and experimental μexp are compared in Fig. 7. Within the series, the increasing degree of intramolecular charge transfer gives rise to progressively larger overestimation of the calculated μGS values as compared with the experimental DMs. Thus, μGS (μ1S) calculated by B3LYP/aug-cpVTZ model chemistry overestimates the experimental DM of derivatives 7 and 8 by about 1.4 D, by 2.4 D for 12 and by more than 3 D for 14 and 15. Using M062X/aug-cpVTZ produced somewhat smaller, but still large deviations between 1.2 D for 4 and 2.5 D for 14. This trend is very similar to the one observed by us previously when comparing the calculated and experimental barriers to rotation using 1S approximation.16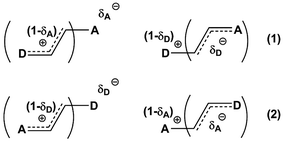 | ||
| Chart 3 Estimating degree of charge transfer within the D–A derivatives involving two rotors. (1) – TSA > TSD; (2) – TSA < TSD. | ||
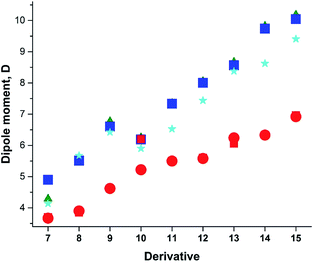 | ||
| Fig. 7 Calculated vs. experimental DMs. Red circles and squares: experimental μexp; μGS: green triangles – B3LYP/aug-cc-pVDZ; blue squares - B3LYP/aug-cc-pVTZ; cyan asterisks – M062X/aug-cc-pVTZ. | ||
Taking into account the results of the previous sections, we calculated the dipole moments of derivatives 7–15 using B3LYP/aug-cc-pVTZ model chemistry and three-state approximation. The DMs were calculated according to: μ3S = μGSδ + μTSDA(1 − δ), where δ = (δA + (1 − δD))/2 and δ = (δD + (1 − δA))/2 for derivative 15. The results presented in Fig. 8 and collated in Table 4 show a very good fit with the experimental.
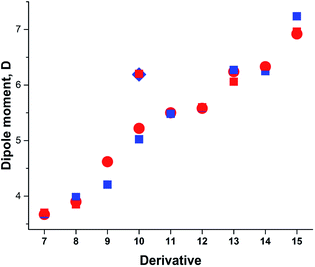 | ||
| Fig. 8 Calculated vs. experimental DMs. Red circles and squares: experimental μexp; blue squares: μ3S (B3LYP/aug-cc-pVTZ). | ||
| Comp. | μGS | μavg | δ | μ3S | μexp |
|---|---|---|---|---|---|
| a In the gas phase.b At 411.8–519.3 K.c The average of DMs of syn- and anti-conformations.d Assuming only C–CO rotation.e Calculated μGS.f In CCl4. | |||||
| 7a | 4.897 | 3.709 | 0.156 | 3.676 | 3.64–3.71b,56 |
| 3.72 ± 0.08 (ref. 57) | |||||
| 3.77 (ref. 58) | |||||
| 8 | 5.511c | 4.332 | 0.311 | 3.982 | 3.85 (ref. 59) |
| 9 | 6.606 | 5.138 | 0.186 | 4.207 | 4.62 (ref. 60) |
| 10a | 6.190 | 5.186 | 0.379 | 5.024 | 5.22 (ref. 55) |
| 6.20e,54 | |||||
| 11 | 7.335 | 5.506 | 0.336 | 5.480 | 5.50 (ref. 63) |
| 12 | 8.003 | 5.267 | 0.469 | 5.594 | 5.58, 5.60 (ref. 1) |
| 13d | 8.565 | 6.414 | 0.548 | 6.271 | 6.24 (ref. 62) |
| 14 | 9.740 | 5.940 | 0.461 | 6.250 | 6.33f,61 |
| 15 | 10.047 | 7.161 | 0.445 | 7.236 | 6.20–6.92 (ref. 1) |
The DM for trans-crotonaldehyde (7) was measured in the gas phase. The structure of 10 was determined from the MW spectra at 1 K, but no experimental DM was provided.54 The calculated using the three-state approach barriers to rotation ΔG≠298 of 10 are 6.94 (–NO2) and 4.18 (CH3O–) kcal mol−1 corresponding roughly to Tc between 100 and 120 K and, therefore, at 1 K the geometry of molecule should be close to the equilibrium. Indeed, the calculated using B3LYP/aug-cc-pVTZ basis set with anharmonic correction(provided Sz for the C–OMe bond 1.356 and for the C–NO2 bond of 1.472 Å in agreement with the experimental rm 1.356(2) and 1.475(3) Å.54 The calculated μzGS was 6.139 D. The experimental DM value of 5.22 D55 was determined at 470 K, far above the Tc. The calculated μavg and μ3S (Table 4) reproduce this value well. It is worth of noting that the calculated μ3S of 10 in benzene is 5.68 D, whereas the reported experimental values are in the range of 4.78–4.86 D,1 resembling the case of nitrobenzene (5) discussed above. Such large difference also may stem from aggregation in solution and the DOSY 1H-NMR spectrum recorded by us (Fig. 2S, ESI†) fully confirms this assumption.
For derivative 13, the barrier to rotation of the C–CO bond in benzene is below RT and that of the C–NMe2 slightly above RT. Assuming that only free rotation over the C–CO bond occurs at RT, we get somewhat exaggerated value of μavg and a better procedure would be to calculate the ZPE corrected DMs at RT using the anharmonic correction to take the Me2N-group rotational vibrations into account and afterwards let the C–CO group rotate freely applying the 3S approximation. Unfortunately, the software does not calculate the rotational contribution in solvents. Assuming free rotation of the both groups, the calculated μavg is 5.381 D that can be verified by measuring the dipole moment of 13 at higher temperatures.
The DM of 14 was calculated in carbon tetrachloride to match the data of,63 as the formation of a solid molecular compound of 14 with benzene was noted in this paper. The formation of the radical species in benzene affecting the experimental value is also possible taking into account the 1H-NMR spectrum of a clean sample (Fig. 4S, ESI†). In the case of derivatives with two rotors, the DMs can also be calculated from 3D surfaces the same way as μmean were calculated for derivatives with one rotor. For instance, in a 3D surface of derivative 15 demonstrating the dependence of DMs on the rotation angle of each substituent from 0° to 90° with the step 10° as shown in the Graphical Abstract, the mean value of the DMs of 100 rotamers μmean = 7.243 D. This value compares well with μavg = 7.161 and μ3S = 7.236 D (Table 4).
The same approach can be used for calculating polarizabilities (α) and hyperpolarizabilities (β): X3S = XGSδ + XTSDA(1 − δ), where δ = (δA + (1 − δD))/2 or δ = (δD + (1 − δA))/2 for the cases when TSA > TSD or TSA < TSD, respectively, and X = α or β. In these cases it should be taken into account that the majority of hyperpolarizability measurements have been made in solvents that exhibit moderate to strong specific interactions with solutes, such as dioxane, chloroform, acetone, etc. Therefore, as already mentioned, the experimental values characterize not so much the electrical properties of the organic derivatives under consideration, but rather the properties of their aggregates with solvents, the quantity of which in solution is strongly concentration-dependent. It is especially true in the case of such compounds as p-nitroaniline (PNA) as was demonstrated recently.64 Moreover, even the gas-phase DMs of PNA used sometimes for comparison with the calculated values are cited in ref. 2 as ‘questionable’. An example based on our calculations is given in Table 5. We did not expect very accurate reproduction of the experimental values considering the solvents used for the experiment, but the differences between μGS, (3S, (GS and (3S are obviously in favor of the 3-state model. A detailed discussion of this issue will be published elsewhere.
Conclusions
We find that the major problem in computationally reproducing the experimental DMs of organic conjugated derivatives is the neglect of experimental methods, conditions under which the measurements were carried out and specifics of each derivative (the ability to form aggregates with solvents or self-aggregates). One of the most important experimental conditions for the gas-phase experiments is the temperature that has a dual effect.On the one hand, we intentionally selected two aromatic heterocycles as examples: pyrrole (1) (π-electron excessive) and pyridine (2) (π-electron deficient) compounds that themselves can be used as D and A components. Whereas for 1 the difference in ZPE corrected DMs at 0 K and RT is quite noticeable, the both values for 2 are almost the same. For flexible formamide (3a) the temperature dependence is much larger than for 1. On the other hand, the calculated DM values provide accurate results for derivatives involving one or more rotors only in the cases when the experiments were done below the temperatures corresponding to their barriers to rotation (slow exchange rate range). Within this range at least ZPE corrected DMs should be calculated. At higher temperatures (fast exchange rate), free (unhindered) fast rotation of substituents requires using another model assuming that all rotamers are present in equal amounts. The temperature correction is not compulsory as the rotation effect on the DM exceeds the effect of the vibration amplitudes.
The majority of experiments on DM determinations in solution are made at RT. Here, the crucial condition for obtaining reasonably accurate DM values is the absence of solute–solute and solute–solvent interactions. The concentration dependence check in wide ranges of concentrations is needed, but not always performed. Derivatives with the D-bridge-A structure possessing large degree of intramolecular charge transfer are usually hygroscopic and the experiments require efficient control of the absence of moisture.
We find that the dipole moments of a series of 15 derivatives can be calculated with the accuracy within the experimental errors wherever they are provided using the B3LYP functional with a moderate basis set, preferably aug-cc-pVTZ. The same model chemistry reproduces the gas phase molecular geometries of derivatives 1–6 reasonably well. Using the aug-cc-pVDZ basis set is also possible as a compromise for large molecules. The APFD functional afforded less accurate results. The M062X functional gave varying results on reproducing the DMs, underestimated the experimental barriers to rotation as shown in ref. 16 and can not be recommended for predicting the dipole moments of yet unknown derivatives. Unexpectedly, HF/aug-cc-pVTZ reproduces the experimental DMs satisfactorily, but fails with the bond lengths. The most unexpected are very poor results of MP2FC with the basis sets usually employed for microwave spectra interpretation. MP2AE performed even worse. The CC methods may produce good results if the anharmonic correction is applied, but it is too expensive to be used for the molecular design purposes.
Although our approach is an approximation, in particular since we neglected the rotation of the Me–N bonds in derivatives 11–15 involving in fact four rotors and the electron donating effect of the Me2N– groups is somewhat overestimated, the reproducibility of the currently available experimental DMs and insufficient control of the specific solute–solvent interactions in polar solvents and the solute–solute interactions in the gas phase and non-polar solvents makes the further refinement at this stage unnecessary.
The validity of our approach is also confirmed by calculations of the DMs of conjugated derivatives involving more than two rotors (μNS) using the N-state approach and the analysis of the influence of free rotation on the UV-vis and IR spectra. The results of this investigation will be published elsewhere.
Conflicts of interest
There are no conflicts to declare.Acknowledgements
We are grateful to Aix-Marseille Université and the CNRS. This work was supported by the computing facilities of CRCMM, ‘Centre Régional de Compétences en Modélisation Moléculaire de Marseille’. The authors are thankful to Dr Y. Khodorkovsky for useful discussions.Notes and references
- A. L. McClellan, Tables of Experimental Dipole Moments, W. H. Freeman and Company, San Francisco, 1963 Search PubMed; O. A. Osipov, V. I. Minkin and A. D. Garnovskii, Handbook of dipole moments, 3rd edn, High School Publ. House, Moscow (in Russian), 1971 Search PubMed.
- R. D. Nelson Jr, D. R. Lide Jr and A. A. Maryott, NSDRS-NBS Monograph 10, National Bureau of Standards, 1967 Search PubMed.
- P. Debye, Polar Molecules, Dover, New York, 1954 Search PubMed; C. J. F. Böttcher, Theory of Electric Polarization, 2nd edn, Elsevier, Amsterdam, 1973 Search PubMed; C. P. Smyth, Determination of dipole moments, in Physical methods of Organic Chemistry, ed. A. Weissberger, vol. I, Part III, Ch. 39, 3rd edition, Interscience, N. Y. 1959 Search PubMed.
- V. I. Minkin, O. A. Osipov and Y. A. Zhdanov, Dipole Moments in Organic Chemistry, in Physical methods in organic chemistry, ed. W. E. Vaughan, Springer US, 1970 Search PubMed.
- Nonlinear Optical Properties of Organic Molecules and Crystals, ed. D. S. Chemla and J. Zyss, Academic Press, N. Y., 1987, vol. 1 and 2 CrossRef CAS; L. T. Cheng, W. Tam, S. H. Stevenson, G. R. Meredith, G. Rikken and S. R. Marder, J. Phys. Chem., 1991, 95, 10631 CrossRef CAS; L. T. Cheng, W. Tam, S. R. Marder, A. E. Stiegman, G. Rikken and C. W. Spangler, J. Phys. Chem., 1991, 95, 10643 CrossRef.
- O. V. Prezhdo, Adv. Mater., 2002, 14, 597 CrossRef CAS.
- A. Capobianco, R. Centore, C. Noce and A. Peluso, Chem. Phys., 2013, 411, 11 CrossRef CAS.
- H. Sun and J. Autschbach, ChemPhysChem, 2013, 14, 2450 CrossRef CAS.
- B. Champagne, E. A. Perpète, D. Jacquemin, S. J. A. van Gisbergen, E.-J. Baerends, C. Soubra-Ghaoui, K. A. Robins and B. Kirtman, J. Phys. Chem. A, 2000, 104, 4755 CrossRef CAS.
- E. Benassi, F. Egidi and V. Barone, J. Phys. Chem. B, 2015, 119, 3155 CrossRef CAS.
- D. Paschoal, M. F. Costa, G. M. A. Junqueira and H. F. Dos Santos, J. Comput. Methods Sci. Eng., 2010, 10, 239 CAS.
- D. Paschoal, M. F. Costa and H. F. Dos Santos, Int. J. Quantum Chem., 2014, 114, 796 CrossRef CAS.
- M. Oki, Applications of Dynamic NMR Spectroscopy to Organic Chemistry Vol. 4 of Methods in Stereochemical Analysis, VCH Verlagsges, Deerfield Beach, Basel, Weinheim, 1985 CrossRef CAS; D. Casarini, L. Lunazzi and A. Mazzanti, Eur. J. Org. Chem., 2010, 2035 CrossRef CAS.
- F. A. L. Anet and M. Ahmad, J. Am. Chem. Soc., 1964, 86, 119 CrossRef CAS.
- L. D. Speakman, B. N. Papas, H. L. Woodcock and H. F. Schaefer, J. Chem. Phys., 2004, 120, 4247 CrossRef CAS; I. A. Godunov, V. A. Bataev, A. V. Abramenkov and V. I. Pupyshev, J. Phys. Chem. A, 2014, 118, 10159 CrossRef.
- M. Sigalov, V. Lokshin, N. Larina and V. Khodorkovsky, Phys. Chem. Chem. Phys., 2020, 22, 1214 RSC.
- N. S. True and R. K. Bohn, Chem. Phys. Lett., 1979, 60, 332 CrossRef CAS; W. E. Steinmetz, J. Am. Chem. Soc., 1974, 96, 685 CrossRef.
- A. N. Taha and N. S. True, J. Phys. Chem. A, 2000, 104, 2985 CrossRef CAS.
- M. J. Frisch, et al., Gaussian 16, Revision A.03, Gaussian, Inc., Wallingford CT, 2016 Search PubMed.
- L. G. Groves and S. Sugden, J. Chem. Soc., 1934, 1094 RSC.
- K. B. McAlpine and C. P. Smyth, J. Chem. Phys., 1935, 3, 55 CrossRef CAS.
- S. Sugden, Nature, 1934, 133, 415 CrossRef CAS.
- P. Jacques, J. Phys. Chem., 1986, 90, 5535 CrossRef CAS.
- U. Bozkaya, E. Soydaş and B. Filiz, J. Comput. Chem., 2020, 41, 769 CrossRef CAS.
- D. Hait and M. Head-Gordon, J. Chem. Theory Comput., 2018, 14, 1969 CrossRef CAS; A. L. Hickey and C. N. Rowley, J. Phys. Chem. A, 2014, 118, 3678 CrossRef.
- D. R. Lide, Molecular Structure and Spectroscopy, Taylor & Francis, New York, 2003 Search PubMed.
- Equilibrium Molecular Structures, ed. J. Demaison, J. E. Boggs and A. G. Császár, CRC Press, 2016 Search PubMed.
- R. K. Bohn, K. W. Hillig and R. L. Kuczkowski, J. Phys. Chem., 1989, 93, 3456 CrossRef CAS.
- A. G. Császár, J. Demaison and H. D. Rudolph, J. Phys. Chem. A, 2015, 119, 1731 CrossRef.
- G. O. Sørensen, L. Mahler and N. Rastrup-Andersen, J. Mol. Struct., 1974, 20, 119 CrossRef.
- C. W. van Dijk, M. Sun and J. van Wijngaarden, J. Mol. Spectrosc., 2012, 280, 34 CrossRef CAS.
- S. Blanco, J. C. López, A. Lesarri and J. L. Alonso, J. Am. Chem. Soc., 2006, 128, 12111 CrossRef CAS.
- S. Blanco, P. Pinacho and J. C. López, Angew. Chem., Int. Ed. Engl., 2016, 55, 9331 CrossRef CAS.
- V. Barone, C. Latouche, D. Skouteris, F. Vazart, N. Balucani, C. Ceccarelli and B. Lefloch, Mon. Not. R. Astron. Soc., 2015, 453, L31 CrossRef CAS.
- S. Alessandrini and C. Puzzarini, J. Phys. Chem. A, 2016, 120, 5257 CrossRef CAS.
- C. T. Zahn, Phys. Z., 1932, 33, 325 Search PubMed.
- R. J. Kurland and E. B. Wilson, J. Chem. Phys., 1957, 27, 585 CrossRef CAS.
- C. C. Costain and J. M. Dowling, J. Chem. Phys., 1960, 32, 158 CrossRef CAS.
- E. Hirota, R. Sugisaki, C. J. Nielsen and G. O. Sørensen, J. Mol. Spectrosc., 1974, 49, 251 CrossRef CAS.
- M. Kitano and K. Kuchitsu, Bull. Chem. Soc. Jpn., 1974, 47, 67 CrossRef CAS.
- G. Fogarasi and P. G. Szalay, J. Phys. Chem. A, 1997, 101, 1400 CrossRef CAS.
- D. McNaughton, C. J. Evans, S. Lane and C. J. Nielsen, J. Mol. Spectrosc., 1999, 193, 104 CrossRef CAS.
- A. V. Kryvda, V. G. Gerasimov, S. F. Dyubko, E. A. Alekseev and R. A. Motiyenko, J. Mol. Spectrosc., 2009, 254, 28 CrossRef CAS.
- J. Demaison, A. G. Császár, I. Kleiner and H. Møllendal, J. Phys. Chem. A, 2007, 111, 2574 CrossRef CAS.
- A. N. Taha, S. M. Neugebauer Crawford and N. S. True, J. Am. Chem. Soc., 1998, 120, 1934 CrossRef CAS.
- B. D. Ross and N. S. True, J. Am. Chem. Soc., 1984, 106, 2451 CrossRef CAS.
- O. Desyatnyk, L. Pszczółkowski, S. Thorwirth, T. M. Krygowski and Z. Kisiel, Phys. Chem. Chem. Phys., 2005, 7, 1708 RSC.
- Y. Kawashima and K. Kozima, Bull. Chem. Soc. Jpn., 1974, 47, 2879 CrossRef CAS.
- K. B. Borisenko, C. W. Bock and I. Hargittai, J. Phys. Chem., 1996, 100, 7426 CrossRef CAS.
- L. S. Khaikin, I. V. Kochikov, O. E. Grikina, D. S. Tikhonov and E. G. Baskir, Struct. Chem., 2015, 26, 1651 CrossRef CAS.
- O. V. Dorofeeva, Y. V. Vishnevskiy, N. Vogt, J. Vogt, L. V. Khristenko, S. V. Krasnoshchekov, I. F. Shishkov, I. Hargittai and L. V. Vilkov, Struct. Chem., 2007, 18, 739 CrossRef CAS.
- S. Nagakura, M. Kojima and Y. Maruyama, J. Mol. Spectrosc., 1964, 13, 174 CrossRef CAS.
- M. B. Robin, Higher Excited States of Polyatomic Molecules, Academic Press, 1975, Vol. 2 Search PubMed.
- J. B. Graneek, C. Pérez and M. Schnell, J. Chem. Phys., 2017, 147, 154306 CrossRef.
- L. G. Groves and S. Sugden, J. Chem. Soc., 1937, 1782 RSC.
- E. C. Hurdis and C. P. Smyth, J. Am. Chem. Soc., 1943, 65, 89 CrossRef CAS.
- M. Suzuki and K. Kozima, Bull. Chem. Soc. Jpn., 1969, 42, 317 Search PubMed.
- R. D. Brown and P. D. Godfrey, Aust. J. Chem., 1984, 37, 1951 CrossRef CAS.
- J. N. Pearce and L. F. Berhenke, J. Phys. Chem., 1935, 39, 1005 CrossRef CAS.
- J. D. Roberts, R. L. Webb and E. A. McElhill, J. Am. Chem. Soc., 1950, 72, 408 CrossRef CAS.
- R. J. W. Le Févre and J. W. Smyth, J. Chem. Soc., 1960, 103 Search PubMed.
- M. H. Hutchinson and L. E. Sutton, J. Chem. Soc., 1958, 4382 RSC.
- M. G. Kogan, V. C. Pustovarov, Yu. V. Kolodyazhnyi, Z. N. Nazarova and O. A. Osipov, Zh. Org. Khim., 1968, 4, 2216 CAS.
- P. K. Malik, M. Tripathy, A. B. Kajjam and S. Patel, Phys. Chem. Chem. Phys., 2020, 22, 3545 RSC.
- M. Stähelin, D. M. Burland and J. E. Rice, Chem. Phys. Lett., 1992, 191, 245 CrossRef.
Footnotes |
| † Electronic supplementary information (ESI) available: Summaries of anharmonic frequencies calculations, full ref. on Gaussian 16 and additional figures. See DOI: 10.1039/d0ra10182f |
‡ Present address: Thales DIS France SA, Avenue du Pic de Bertagne 13![[thin space (1/6-em)]](https://www.rsc.org/images/entities/char_2009.gif) 420, Gémenos, France. 420, Gémenos, France. |
| § The reference to the article36 in paper37 is misspelled. |
| This journal is © The Royal Society of Chemistry 2021 |


