 Open Access Article
Green synthesis of starch-capped Cu2O nanocubes and their application in the direct electrochemical detection of glucose†
Antonio Jiménez-Rodríguez a,
Eduardo Sotelo
 a,
Lidia Martínez
 b,
Yves Huttel
 b,
María Ujué González
 c,
Alvaro Mayoral
 def,
José Miguel García-Martín
 c,
Marcelo Videa
 *a and
Jorge L. Cholula-Díaz
 *a
*a
aSchool of Engineering and Sciences, Tecnologico de Monterrey, Eugenio Garza Sada 2501, Monterrey 64849, NL, Mexico. E-mail: mvidea@tec.mx; jorgeluis.cholula@tec.mx
bMaterials Science Factory, Instituto de Ciencia de Materiales de Madrid, ICMM-CSIC, Sor Juana Inés de la Cruz 3, Madrid 28049, Spain
cInstituto de Micro y Nanotecnología, IMN-CNM, CSIC (CEI UAM+CSIC), Isaac Newton 8, Tres Cantos 28760, Spain
dInstituto de Nanociencia y Materiales de Aragón (INMA), CSIC-Universidad de Zaragoza, Pedro Cerbuna, 50009, Zaragoza, Spain
eCenter for High-Resolution Electron Microscopy (CℏEM), School of Physical Science and Technology (SPST), ShanghaiTech University, 393 Middle Huaxia Road, Pudong, Shanghai, 201210, China
fLaboratorio de Microscopias Avanzadas (LMA), Universidad de Zaragoza, Spain
First published on 13th April 2021
Abstract
Glucose determination is an essential procedure in different fields, used in clinical analysis for the prevention and monitoring of diabetes. In this work, modified carbon paste electrodes with Cu2O nanocubes (Cu2O NCs) were developed to test electrochemical glucose detection. The synthesis of the Cu2O NCs was achieved by a green method using starch as the capping agent, obtaining cubic-like morphologies and particle sizes from 227 to 123 nm with increasing amounts of the capping agent, as corroborated by electron microscopy analysis. Their crystalline structure and purity were determined by X-ray diffraction. The capability of starch as a capping agent was verified by Fourier-transform infrared spectroscopy, in which the presence of functional groups of this biopolymer in the Cu2O NCs were identified. The electrochemical response to glucose oxidation was determined by cyclic voltammetry, obtaining a linear response of the electrical current as a function of glucose concentration in the range 100–700 μM, with sensitivities from 85.6 to 238.8 μA mM−1 cm−2, depending on the amount of starch used in the synthesis of the Cu2O NCs.
1 Introduction
Glucose quantification is required due to its importance in health and food industries, where this monosaccharide serves as an indicator in quality control,1 and for clinical analysis and diagnosis.2 Its quantification in industrial applications is usually carried out by near infrared (NIR) spectroscopy, which is not an adequate technique for clinical routine analysis.3 Hence, ample research has been conducted to find more sensitive and reliable alternative techniques for routine glucose quantification, which can further improve diabetes diagnosis, a disease that could affect 5.9 billion people by 2035.4Glucose monitoring methods are classified according to the type of technology applied to detect the biomarker. In a broad sense, there are optical, thermal, acoustic and electrochemical methods. Although each technology is nowadays commercially available, the electrochemical-based methods are the gold standards for calibration of other glucose meters and at central laboratories.5 Currently, electrochemical techniques for glucose detection implement the glucose oxidase enzyme (GOx), which can selectively oxidize glucose in the presence of molecular oxygen (O2),6 producing gluconolactone and hydrogen peroxide (H2O2).7 The latter is quantified amperometrically, achieving an indirect glucose quantification.3 Nevertheless, the intrinsic nature of enzymes – in particular their structural changes due to physical treatments – the thermal history during the sensor assembly or chemical modifications due to pH variations,8 may alter the reproducibility of the detection method. Furthermore, conventional devices for glucose monitoring are based on invasive methods, which require a certain amount of blood to be drawn out of the body by finger-pricking, making this method painful and uncomfortable for diabetes patients.5,9 Hence, there is great interest in non-enzymatic glucose sensors that are based on the direct glucose oxidation over a working electrode without the participation of an enzyme;10 these novel biosensors should minimize the risks and inconvenience of the invasive methods. For these reasons, noninvasive, accurate, portable and low-cost glucose monitoring devices to control diabetes are highly demanded. In this regard, saliva is very attractive as a biomedium for non-enzymatic electrochemical glucose sensors.11
Nanomaterials of noble metals like Au and Pt, as well as their alloys (PtAu and PtRu), have been investigated for glucose determination due to their catalytic activities in electrochemical processes.4 However, the application of these metals as electrodes in sensors is restrained by their high cost,7 and possible surface poisoning by intermediates such as carbon monoxide (CO) and chloride ions (Cl−) that may be present in the sample.12 These setbacks have prompted the search for substitutes that maintain the same performance and reduce costs.
Nanostructured transition metal oxides are promising materials for the non-enzymatic detection of glucose, due to their chemical stability, catalytic activity, particle size control, and biological compatibility.10 Cuprous oxide (Cu2O) has been investigated for its application as a glucose sensor using direct electrochemical methods because of its catalytic activity, chemical and electrochemical stability, and lower cost than noble metals.6,13–15 Particularly, Cu2O nanocubes (Cu2O NCs) are very attractive due to their higher electrocatalytic activity in electrochemical processes like the oxygen reduction reaction (ORR).16 For these reasons, the implementation of this type of nanostructure as a non-enzymatic glucose sensor may be very advantageous.
In general, Cu2O NCs synthesis has been reported mainly by wet routes that include the control of these main factors: copper precursor, reducing agent and capping agent. The capping agent, such as polyethylene glycol (PEG) and polyvinylpyrrolidone (PVP), modifies the particle size and the morphology of the nanomaterial.16–19 Furthermore, common reducing agents in the synthesis of nanomaterials are hydrazine, sodium borohydride (NaBH4), and dimethylformamide (DMF), which pose environmental and biological risks.20,21 According to Duan et al.,22 a green chemistry approach for a synthesis method should incorporate at least three factors: the use of nontoxic capping agents, less hazardous reducing agents, and the selection of environmentally benign solvents.
Starch is considered one of the most convenient stabilizer agents among the abundant, biocompatible, and renewable biopolymer materials for the synthesis of nanoparticles.23 This biopolymer has been used for the synthesis of diverse nanoparticles such as metal and metal oxides due to its hydroxyl groups (–OH) that interact with the surface atoms of the nanomaterials.24–29 Despite the synthesis of Cu2O nanostructures using starch as both the reducing and dispersing agent having been previously reported,30–32 to the best of our knowledge, the application of starch–Cu2O nanocomposites as electrocatalysts for the direct sensing of glucose are yet to be evaluated.
The present work reports a highly reproducible green synthesis of Cu2O NCs using Benedict’s reagent as the copper precursor, D-(+)-galactose as the reducing agent and starch as the capping agent. The aim of this project was to study the effect of starch as the capping agent on the physical and chemical properties of the Cu2O NCs, i.e., crystalline structure, chemical composition, particle size, and the electrochemical activity of the nanomaterial in the oxidation of glucose. To achieve these goals, the amount of starch used in the synthesis of the Cu2O NCs was varied and the resulting nanomaterials were thoroughly characterized. Finally, the glucose sensing properties of the starch–Cu2O nanocomposites were tested by cyclic voltammetry.
2 Materials and methods
2.1 Materials
The reactants used in the green synthesis of Cu2O nanocubes were copper(II) sulfate pentahydrate (CuSO4·5H2O; ≥98%, Sigma-Aldrich), sodium citrate dihydrate (Na3Cit·2H2O; ≥99%, Sigma-Aldrich), D-(+)-galactose (≥99%, Sigma-Aldrich), sodium carbonate (Na2CO3; ≥99.5%, Sigma-Aldrich), sodium hydroxide (NaOH; 98.4%, CTR Scientific, Monterrey, N.L., Mexico) and starch (Reagent Grade, CTR Scientific, Monterrey, N.L., Mexico). For the electrochemical experiments, the following chemicals were utilized: graphite (<20 micron, reagent grade, Sigma-Aldrich), paraffin wax (Reagent grade, Sigma-Aldrich), D-glucose (≥99.5%, Sigma-Aldrich), and acetone (Reagent Grade, CTR Scientific, Monterrey, N.L., Mexico). Deionized water (ρ = 18 MΩ cm) was used in the synthesis of Cu2O nanocubes, as well as for all the following procedures described below. All the glassware and stirring bars used were kept under an 11.11% v/v HCl solution for 24 hours, followed by immersion in a KOH/EtOH solution for the same amount of time and then rinsed with water prior to use.2.2 Synthesis of Cu2O nanocubes
The methodology for the synthesis of Cu2O NCs is a modification to the method reported by Markina et al.33 First, stock solutions were prepared. The preparation of the modified Benedict’s reagent consists of mixing a solution of 300.0 mg of CuSO4·5H2O in 1 mL of water and a solution of 346.2 mg of Na3Cit·2H2O and 200.2 mg of Na2CO3 in 4 mL of water. A fresh 1% w/v aqueous starch solution was prepared and heated to 70 °C. Finally, a 40% w/v D-(+)-galactose aqueous solution was prepared.The reaction consisted of adding 1 mL of 0.1 M NaOH to a glass vial and enough water to reach a volume of 10 mL. Then 0.2, 1 or 5 mL of the starch solution, 50 μL of 40% w/v galactose solution, and 200 μL of Benedict’s reagent were added with a time lag of 5 min between them. The overall reaction was heated up to 95 °C, stirred at 500 rpm, and left for 15 min after the addition of Benedict’s reagent. The resultant colloid was centrifuged three times for 10 min at 15![[thin space (1/6-em)]](https://www.rsc.org/images/entities/char_2009.gif) 000 rcf. After each centrifugation process, the supernatant was discarded and the remaining pellet was redispersed in 10 mL of water with sonication.
000 rcf. After each centrifugation process, the supernatant was discarded and the remaining pellet was redispersed in 10 mL of water with sonication.
2.3 Characterization of Cu2O nanocubes
3 Results and discussion
3.1 Synthesis of the Cu2O NCs
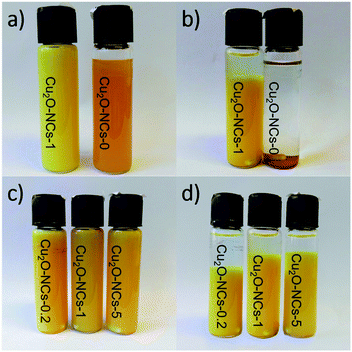
Cuprous oxide nanocubes (Cu2O NCs) were obtained by a green synthesis method using Benedict’s reagent as the copper source, galactose as the reducing agent and starch as the capping agent. During the final part of the reaction, the color of the dispersions changed from orange to a yellow-orange using a 1% w/v starch solution. A similar color was observed by Huang et al. in Cu2O colloids obtained using sodium dodecyl sulfate surfactant.34 Fig. 1a shows the effect of the capping agent on the color of the colloids, and Fig. 1b depicts the stability of the dispersions after 72 h aging at room temperature. A clear visual difference in the stability of the suspensions was observed, wherein the non-capped Cu2O NCs (Cu2O-NCs-0) completely precipitated in less than 30 min, the starch-capped Cu2O NCs (Cu2O-NCs-1) suspension was kept relatively stable after 72 h. These results are comparable with the effect of (3-aminopropyl)trimethoxysilane (APTMS) in the stability of copper nanopowders, conferring stability to the colloid within 72 h in comparison with the sedimentation of the bare nanomaterial.35 In the case of the dispersions with 0.2, 1, and 5 mL of the starch solution (Cu2O-NCs-0.2, Cu2O-NCs-1 and Cu2O-NCs-5, respectively), Fig. 1c, the relative stability increased as the amount of capping agent was increased (Fig. 1d). The same trend was observed in chitosan-capped silver nanoparticles, where the stability was increased by the amount of chitosan used as the capping agent.363.2 Structural characterization using XRD
The X-ray diffraction (XRD) patterns of the synthesized Cu2O NCs are presented in Fig. 2 along with the Cu2O reference diffractogram obtained from Mercury 4.0 Software37 using experimental data from Kirfel and Eichhorn.38 Diffraction peaks observed at 2θ ≈ 29.59, 36.45, 42.34, 61.42, 73.58 and 77.43° were indexed to (110), (111), (200), (220), (311) and (222) crystallographic planes that correspond to the expected diffraction peaks for cubic Cu2O (space group Pn![[3 with combining macron]](https://www.rsc.org/images/entities/char_0033_0304.gif) m).38
m).38
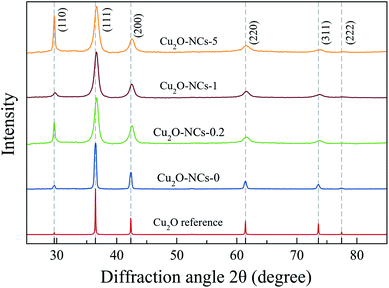 | ||
Fig. 2 XRD patterns of Cu2O nanocubes synthesized without starch (Cu2O-NCs-0) and with different amounts of 1% w/v starch solution (0.2, 1 and 5 mL for Cu2O-NCs-0.2, Cu2O-NCs-1 and Cu2O-NCs-5, respectively). Miller indexes corresponding to cubic Cu2O with space group Pn![[3 with combining macron]](https://www.rsc.org/images/entities/char_0033_0304.gif) m.38 m.38 | ||
Comparing the experimental XRD patterns of Cu2O synthesized with and without starch, the formation of Cu2O without any impurities from the reagents used in the synthesis, can be verified. The main difference in these patterns is the broadening of the peaks, which is related to the size of the crystallite of the sample, as described in Scherrer’s equation:39,40
d = Kλ/β![[thin space (1/6-em)]](https://www.rsc.org/images/entities/char_2009.gif) cos cos![[thin space (1/6-em)]](https://www.rsc.org/images/entities/char_2009.gif) θ θ
| (1) |
As described in eqn (1), the size of the crystallite is inversely proportional to FWHM of the diffraction peak; thus, a large value of FWHM corresponds to a smaller crystallite size. Table 1 provides a summary of the values for the crystallite size and lattice parameter (a). Due to the effect of starch in reducing the size of the Cu2O NCs, the broadening of the diffraction peaks was used as a parameter to study the concentration effect of this biopolymer on the size of the nanomaterials. To analyze this effect, a comparison was drawn from two variations of the 1% w/v starch solution volume (0.2 and 5 mL) and the standard synthesis (1 mL), as shown in Fig. 2. The ratio of the intensity of the (220) peak to that of the (200) peak was in the range of 0.30–0.35, in agreement to the values found in Cu2O NCs.34 However, a significant difference found among these XRD patterns appears in the relative intensity between the (110) and (111) peaks in the samples Cu2O-NCS-0.2 and Cu2O-NCs-5, which may indicate an anomalously crystallographic growth orientation exposing the {110} facets. As mentioned by Tang et al.,41 the intensity of diffraction peaks in XRD patterns may exhibit the intrinsic abundance of crystal planes of the Cu2O structure. Our experimental results need further investigation to clarify this variance in the observed relative intensity of the referred diffraction peaks.
| Sample | Lattice parameter (a) (Å) | Crystallite size (nm) |
|---|---|---|
| Cu2O-NCs-0 | 4.26 ± 0.01 | 22.3 ± 3.5 |
| Cu2O-NCs-0.2 | 4.25 ± 0.01 | 9.2 ± 1.6 |
| Cu2O-NCs-1 | 4.25 ± 0.01 | 8.8 ± 1.6 |
| Cu2O-NCs-5 | 4.25 ± 0.01 | 8.1 ± 1.6 |
To confirm the reproducibility of the proposed synthesis methodology, six replicates (N = 6) of the synthesis of the Cu2O NCs using 1 mL of the starch solution were prepared and analyzed by XRD. In the ESI, Fig. S1† shows the XRD patterns of the replicates, which are similar to each other, proving the reproducibility of the synthetic method.
3.3 Capping ability of starch characterized by FT-IR spectroscopy
Comparing the FT-IR spectra of the Cu2O NCs synthesized with and without starch, to the spectrum of this biopolymer, which was taken as the reference, confirms the adsorption of starch on the surface of the Cu2O nanostructures, as shown in Fig. 3. The spectra of the three different starch-capped Cu2O NCs samples showed the characteristic bands of starch: a broad band around 3300 cm−1 attributed to the O–H stretching mode (remarking that starch presents a more intense band than those in nanocubes, which may be related to the decrease of free hydroxyl groups due to their linkage to the nanocubes).23 A band around 2925 cm−1 corresponding to the C–H stretching;42 1640 cm−1 related to tightly bound water in starch;43 vibrational bands in the region of 1500–1300 cm−1 attributed to C–H bending and deformation;44 1150 cm−1 is related to vibrations of the glucosidic C–O–C bond.45 The bands at 1080 and 1020 cm−1 are characteristic of the anhydroglucose ring O–C stretch.43 The band at 925 cm−1 is assigned to vibrational modes of α 1 → 4 skeletal glycoside bonds45 and bands below 800 cm−1 were related to skeletal mode vibrations of the glucose pyranose ring.44 Thus, the capping capability of starch for Cu2O NCs was proven. Besides the characteristic functional groups of starch, a band at 610 cm−1 relates to the Cu–O bond in Cu2O in all four samples.46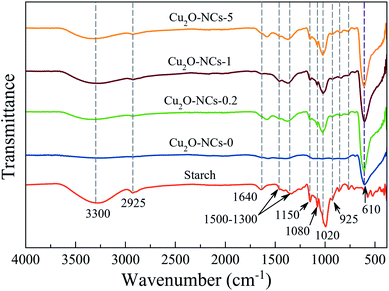 | ||
| Fig. 3 FT-IR spectra of Cu2O nanocubes synthesized using different amounts of starch. Starch powder was measured as the reference. | ||
3.4 Particle size and morphology characterization of Cu2O nanocubes by SEM and TEM
SEM imaging allowed the observation of the cubic morphology of the nanomaterials as well as their particle sizes by measuring the length of the cube edge. For comparison purposes, only cubic morphologies found in the samples were counted to construct the particle size distributions (n = 100).The SEM images and the respective particle size distribution of the four Cu2O NCs samples are shown in Fig. 4 and S2 (ESI†). In Fig. 4a and b, the SEM images of the Cu-based nanomaterial synthesized in the absence of starch (Cu2O-NCs-0) shows relatively smooth facets with different particle shapes, such as well-defined cuboctahedra, truncated cubes, quasi-spherical particles, and cubes with an average particle size of 227 ± 69 nm. The SEM images in Fig. 4c and d show the effect of adding 0.2 mL of 1% w/v starch solution to the reaction (Cu2O-NCs-0.2), observing a cubic-like morphology with rough surfaces. Actually, it was observed that each nanocube is composed of self-assembled Cu2O aggregates forming a highly polycrystalline structure. The average particle size for this sample was 179 ± 21 nm. Fig. 4e and f exhibit the resulting Cu2O nanocubes produced with a higher volume of the starch solution (1 mL, Cu2O-NCs-1), which also presents rough surfaces and smaller nanocubes of 143 ± 20 nm. Finally, Fig. 4g and h correspond to the Cu2O NCs resulting from the addition of 5 mL of the starch solution (Cu2O-NCs-5) with even smaller average particle sizes of 123 ± 20 nm. These results confirmed that the amount of starch in the synthesis determines the average size of Cu2O NCs, i.e., higher amounts of the starch solution prompt smaller NCs. These experimental observations were in disagreement with a similar nanosystem reported by Sun et al., in which the mean particle size of Cu2O octahedral microcrystals increased from 1.60 to 3.85 μm upon addition of starch as the reducing and dispersing agent.32 On the other hand, reduction of the particle size as a function of starch was presented on starch-capped Ag nanoparticles.47 This effect may be attributed to the strong interaction of hydroxyl groups (–OH) of starch that cause effectual passivation of the surfaces and consequent suppression of the growth of the Cu2O NCs. Moreover, it has been reported that structure-directing agents with high molecular weights (Mw), such as polyethylene glycol with Mw = 20![[thin space (1/6-em)]](https://www.rsc.org/images/entities/char_2009.gif) 000 g mol−1 (PEG-20000), yielded hierarchically structured Cu2O NCs with rough surfaces and undefined edges comprising self-assembled 5 nm Cu2O nanocrystallites.48 In contrast, the use of a lower molecular weight, PEG-400 (Mw = 400 g mol−1), resulted in the formation of smooth and regular Cu2O NCs.48 In a similar manner, the use of starch, a biopolymer with a high molecular weight (Mw ∼ 106 g mol−1), could promote the growth of irregular Cu2O NCs that may resemble hierarchical-like nanostructures. In fact, Chen et al. reported the synthesis of nanoparticle-aggregated octahedron-like Cu2O nanostructures with the assistance of starch acting as the reducing agent.30
000 g mol−1 (PEG-20000), yielded hierarchically structured Cu2O NCs with rough surfaces and undefined edges comprising self-assembled 5 nm Cu2O nanocrystallites.48 In contrast, the use of a lower molecular weight, PEG-400 (Mw = 400 g mol−1), resulted in the formation of smooth and regular Cu2O NCs.48 In a similar manner, the use of starch, a biopolymer with a high molecular weight (Mw ∼ 106 g mol−1), could promote the growth of irregular Cu2O NCs that may resemble hierarchical-like nanostructures. In fact, Chen et al. reported the synthesis of nanoparticle-aggregated octahedron-like Cu2O nanostructures with the assistance of starch acting as the reducing agent.30
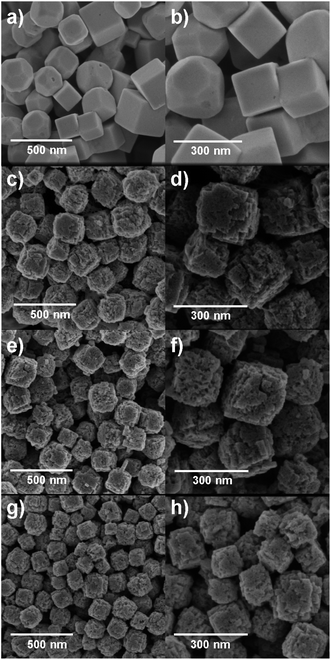 | ||
| Fig. 4 SEM images of Cu2O NCs varying the amount of 1% w/v starch solution in their synthesis. (a and b) without starch; (c and d) 0.2 mL; (e and f) 1 mL; (g and h) 5 mL. | ||
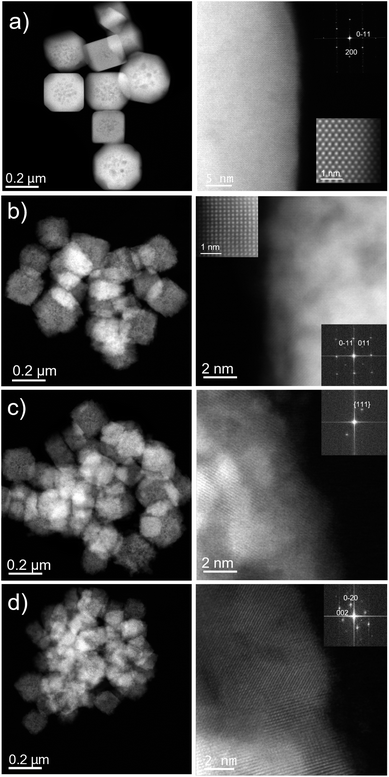
Low-magnification Cs-corrected STEM-HAADF of the nanomaterial synthesized with no starch (Cu2O-NCs-0) is presented in Fig. 5a, left column, where very well faceted particles with sizes in the range 200–300 nm with cubic and cuboctahedral morphologies can be observed. A closer observation of the edge is depicted in Fig. 5a, right column, proving the excellent crystallinity of the Cu2O nanostructures. Here, the atomic distribution is evidenced along the [110] orientation, see the Fourier diffractogram (FD) in the inset, top right of Fig. 5a. The FD could be indexed assuming Pn![[3 with combining macron]](https://www.rsc.org/images/entities/char_0033_0304.gif) m symmetry with a calculated cubic unit cell of a = 4.25 Å, in agreement with the values found by XRD analysis (Table 1) and reported in the literature for Cu2O cubes.41 A magnified image of the atomic configuration is shown in the inset on the bottom right of Fig. 5a, right column.
m symmetry with a calculated cubic unit cell of a = 4.25 Å, in agreement with the values found by XRD analysis (Table 1) and reported in the literature for Cu2O cubes.41 A magnified image of the atomic configuration is shown in the inset on the bottom right of Fig. 5a, right column.
The same analysis was carried out for the Cu2O nanocubes synthesized with starch. Fig. 5b–d (left column) reveals, as already evidenced by SEM analysis, the reduction of the particle size as a function of starch solution used in the synthesis and the formation of less defined nanocubes. Each nanocube is composed of small single crystals (crystallites) giving an overall polycrystalline material. The structure of the three samples was in agreement with the cubic Pn![[3 with combining macron]](https://www.rsc.org/images/entities/char_0033_0304.gif) m Cu2O symmetry38 and the corresponding FDs have been inserted within the high-magnification images (Fig. 5b–d, right columns). A clear atomic observation along the [100] projection is depicted in Fig. 5b (high-resolution inset top left), as a representative example of the crystalline nature of these domains.
m Cu2O symmetry38 and the corresponding FDs have been inserted within the high-magnification images (Fig. 5b–d, right columns). A clear atomic observation along the [100] projection is depicted in Fig. 5b (high-resolution inset top left), as a representative example of the crystalline nature of these domains.
3.5 Characterization of the chemical composition of the Cu2O NCs by EDX and XPS
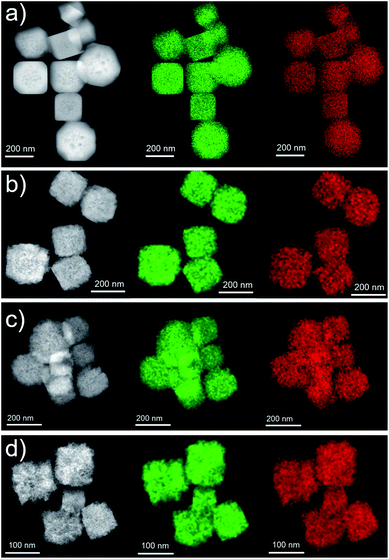
In order to gain information on the chemical composition of the samples, EDX analyses (coupled with SEM imaging) were done (Fig. S3–S6†). As no standard sample of a similar system with known composition to refer to in EDX measurements was available, the obtained atomic contents were semi-quantitative. However, they could provide comparisons and evolution between the different samples. In all the samples Cu, O, and C stand for at least 94% of the composition, and the remaining <4% of the composition found in the EDX spectra is due to Si (from the substrate), as well as minor and trace constituents coming from the reactants in the synthesis. Fig. S7† shows the ratio between the contents of Cu and C as well as the ratio between Cu and O as a function of the amount of starch solution used in the reaction. It can be observed that the ratios decrease as the concentration of starch increases, as expected: Cu and part of the O can be ascribed to the Cu2O nanostructures, whereas C and the rest of the O can be ascribed to starch.A more extensive chemical elemental analysis was completed by means of EDX mapping on individual Cu2O nanostructures. In all cases, chemical maps were obtained for Cu and O, as no other element was identified. For each case, a chemical map is presented proving the homogeneous composition is present in every sample (Fig. 6), and single-nanocube chemical maps (Fig. S8†) display that the composition of the nanostructure was homogeneous along the individual nanostructure. In addition, the spectra, where the chemical maps were extracted from, are depicted in Fig. S8.†
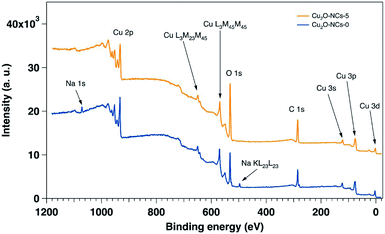
The XPS characterization was performed on the two extremes on the Cu2O NCs set of samples: grown without starch and with 5 mL of the 1% w/v starch solution. Fig. 7 shows the wide energy range scan spectra of both samples, and Table 2 gives the composition of the samples extracted from their analyses. In the two samples Cu, O and C were detectable. In addition, Na was detected in the sample prepared without starch, and traces of N were found in the sample without starch. The main difference in elemental composition between the samples relies on the amount of oxygen, as the sample with starch presents 8% more than the sample without starch. The presence of Na is understandable due to the reactants used for the synthesis of the Cu2O NCs, and the higher content of O in the sample grown with starch is certainly due to starch capping as demonstrated by the FT-IR spectra (Fig. 3). As XPS is a surface sensitive technique, the starch capping induces a lowering of the Cu signal in the sample that is capped with starch (17.7%) as compared to the sample prepared without starch (21.1%), once again in agreement with FT-IR results.
| Composition atomic% | |||||
|---|---|---|---|---|---|
| Cu | C | O | N | Na | |
| Cu2O-NCs-0 | 21.1 | 44.3 | 31.7 | — | 2.9 |
| Cu2O-NCs-5 | 17.7 | 42.1 | 39.8 | 0.4 | — |
Detailed analysis of the Cu 2p core level peak (Fig. S9a†) evidenced a shoulder in the main peak at 934.5 eV, and smaller contributions at 941.3 eV and 943.9 eV that are characteristic of CuO.49,50 In addition, the CuLMM Auger peak (Fig. S9b†) presents the characteristic shape of CuO.50 Therefore, Cu in both samples is oxidized in the form of Cu2+. Hence, XPS, which is a surface analysis technique, only detects CuO. Combining this result with that obtained in the XRD, high-resolution TEM and FD analyses, we can infer that the nanocubes are mainly formed of Cu2O and exhibit an outer thin shell of CuO. The formation of such a shell can be ascribed to natural oxidation in ambient conditions.
Fig. S10† presents the C 1s and O 1s core level peaks of the samples. Significant changes were found on both core level peaks. In the case of the C 1s, the peaks have been fitted using four components, which correspond to C–C/C–H bonds at 285 ± 0.2 eV; C–O/C–N bonds at 286.3 ± 0.2 eV; C![[double bond, length as m-dash]](https://www.rsc.org/images/entities/char_e001.gif) O bonds at 288.1 ± 0.2 eV; and O–C
O bonds at 288.1 ± 0.2 eV; and O–C![[double bond, length as m-dash]](https://www.rsc.org/images/entities/char_e001.gif) O bonds at 289 ± 0.2 eV. These four components are typical of organic compounds.51 The proportion of each component is detailed in Table S1.† As expected, the sample with starch presented a larger proportion of C–O bonds in comparison to the sample without starch, but also two times more C
O bonds at 289 ± 0.2 eV. These four components are typical of organic compounds.51 The proportion of each component is detailed in Table S1.† As expected, the sample with starch presented a larger proportion of C–O bonds in comparison to the sample without starch, but also two times more C![[double bond, length as m-dash]](https://www.rsc.org/images/entities/char_e001.gif) O bonds.
O bonds.
In the case of the O 1s core level peak, two components were used in an attempt to make a fitting with the minimum possible number of components. The first component (O1) is centered at 530.9 ± 0.1 eV and the second (O2) at 532.6 ± 0.2 eV. Both components could be related to the presence of C–O–C and CH2OH residues. The oxygen component related to the presence of CuO should appear at lower binding energy than the O1 component (530.3 eV and the CuOH at 531.8 eV![[thin space (1/6-em)]](https://www.rsc.org/images/entities/char_2009.gif) 50). If the fitting is forced to include these components, keeping the same FWHM in all of them (Fig. S11†), in the case of the sample without starch, 73% of the oxygen could be related to the presence of CuOH, but without any indication of the oxide component. Basically, the sample with starch keeps the same fitting presented in Fig. S10,† as only 0.4% of the oxygen could be related to CuO, and no evidence of CuOH was found. In conclusion, the Cu of both samples is in the form of Cu2+, and probably in the form of hydroxide in the sample with no starch.
50). If the fitting is forced to include these components, keeping the same FWHM in all of them (Fig. S11†), in the case of the sample without starch, 73% of the oxygen could be related to the presence of CuOH, but without any indication of the oxide component. Basically, the sample with starch keeps the same fitting presented in Fig. S10,† as only 0.4% of the oxygen could be related to CuO, and no evidence of CuOH was found. In conclusion, the Cu of both samples is in the form of Cu2+, and probably in the form of hydroxide in the sample with no starch.
3.6 Electrochemical glucose determination by cyclic voltammetry
Electrochemical experiments were performed using a carbon-paste composite working electrode containing graphite and the Cu2O NCs (Cu2O NCs/CPE) to evaluate the specific electrochemical activity of these nanomaterials in glucose oxidation. Fig. 8 shows the cyclic voltammetry responses of Cu2O NCs synthesized with and without starch in the presence (and absence) of 700 μM glucose in a 0.1 M NaOH electrolyte. For the Cu2O NCs synthesized without starch (Cu2O-NCs-0), the oxidation of glucose was observed at an onset voltage of ca. 0.60 V vs. Ag|AgCl as an increment in the current of 20.3 μA when compared to the blank experiment in the absence of glucose. When using the working electrode with the sample Cu2O-NCs-1, a significant increase in current occurs at 0.60 V vs. Ag|AgCl showing a current almost 6 times larger than Cu2O-NCs-0. This behavior was ascribed to the glucose oxidation process, which is similar to the results reported by Felix et al.,13 where the current is related to the oxidation of glucose to gluconolactone occurring at the same moment as the conversion of Cu(II) to Cu(III) that catalyzes the previous reaction. Furthermore, the notorious difference in current at a given applied voltage may imply a higher activity due to the smaller nanocubes in Cu2O-NCs-1 (mean particle size of 143 nm) in comparison with the Cu2O NCs synthesized without starch (mean particle size of 230 nm). Hence, more active sites to carry glucose oxidation are present in Cu2O-NCs-1 with a consequent increment in the obtained current.52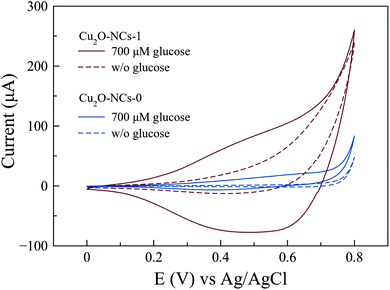 | ||
| Fig. 8 Cyclic voltammograms for the oxidation of 700 μM glucose in 0.1 M NaOH with Cu2O NCs synthesized with 1 mL of 1% w/v starch solution (Cu2O-NCs-1) and without starch (Cu2O-NCs-0). | ||
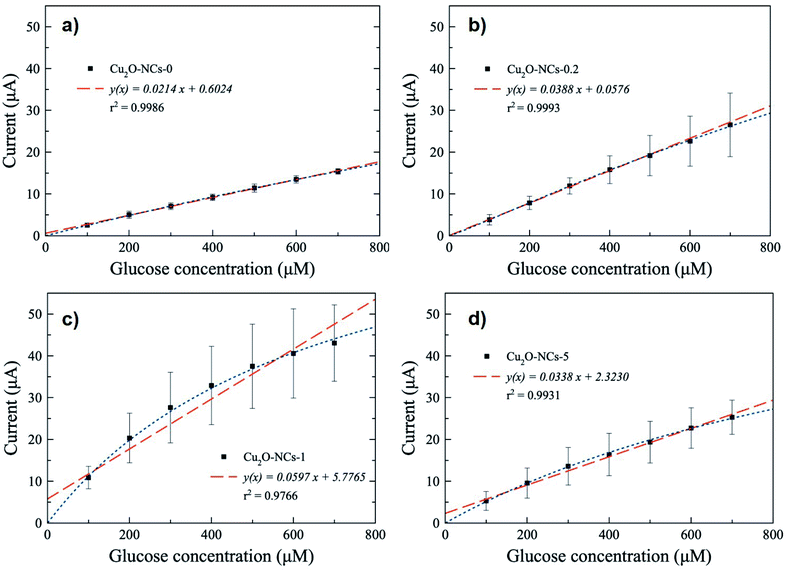
Since a better response for glucose oxidation is expected at a larger surface area, the Cu2O-NCs-1 sample was further analyzed. The cyclic voltammetry obtained at different concentrations of glucose are represented in Fig. 9, where the glucose concentration analyzed ranged from 100 to 700 μM, demonstrating the current dependence on glucose concentration. A correction of the baseline of the oxidation processes (positive currents) was done to obtain anodic currents related to glucose oxidation by the subtraction of the blank from the results of different glucose concentrations. This procedure conferred at the same time the removal of the signal from the Cu2O NCs to observe only glucose oxidation. Current at a potential of 0.60 V vs. Ag|AgCl was chosen, as previously mentioned, due to glucose oxidation processes. These currents were plotted as a function of the glucose concentration from 100 to 700 μM to obtain the calibration curve shown in Fig. 10c, each point on the calibration curve represents the average value for three independent measurements with error bars representing the standard deviation for each set of measurements. The correlation coefficient (R2) for the calibration curve was R2 = 0.9766 with a sensitivity of 59.7 μA mM−1 (238.8 μA mM−1 cm−2, considering the electrode geometrical area) and a limit of detection (LOD) of 70.0 μM. These experimental parameters are relevant for the application of the method for detecting glucose in biological samples, e.g., human salivary glucose (68 ± 29 μM and 234 ± 200 μM for healthy individuals and patients diagnosed with type 2 diabetes mellitus, respectively).53 This electrochemical performance is similar, or even higher in comparison to different reported Cu2O-based nanomaterials for non-enzymatic glucose sensing (Table 3).
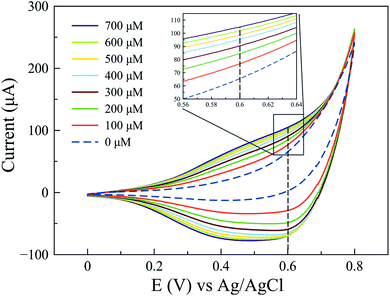 | ||
| Fig. 9 Cyclic voltammograms obtained at different concentrations of glucose from 100 to 700 μM using the Cu2O-NCs-1 sample. | ||
| Electrode matrix | Linear range (mM) | Sensitivity (μA mM−1 cm−2) | LOD (μM) | Ref. |
|---|---|---|---|---|
| a Reported as μA mM−1. | ||||
| Cu2O NCs/GCE/Nafion | 0.00–0.50 | 121.7a | 38.00 | 13 |
| Cu2O nanospheres/RGOs/GCE | 0.01–6.00 | 185a | 0.05 | 14 |
| Cu2O NCs/GN/GCE | 0.30–3.30 | 28.5 | 3.30 | 55 |
| Cu2O NCs/Ti | 0.017–11.65 | 28.4 | 15.60 | 15 |
| Cu2O NCs/Co3O4 NHs/GCE | 0.001–5.33 | 0.28 | 0.63 | 56 |
| Cu2O-NCs-0/CPE | 0.10–0.70 | 85.6 | 18.0 | This work |
| Cu2O-NCs-0.2/CPE | 0.10–0.70 | 155.2 | 12.0 | This work |
| Cu2O-NCs-1/CPE | 0.10–0.70 | 238.8 | 70.0 | This work |
| Cu2O-NCs-5/CPE | 0.10–0.70 | 135.2 | 38.0 | This work |
The remaining Cu2O NCs samples in non-enzymatic glucose sensing were also tested, obtaining the calibration curves depicted in Fig. 10, from which the sensitivity was calculated considering the geometrical areas of the electrodes (Table 3). The Cu2O NCs/CPE based on Cu2O NCs without starch (Cu2O-NCs-0) had a sensitivity of 85.6 μA mM−1 cm−2 with LOD = 18.0 μM (Fig. 10a). Meanwhile, the modified CPE with Cu2O NCs synthesized with starch presented higher sensitivities as 155.2 and 135.2 μA mM−1 cm−2 with a LOD of 12.0 and 38.0 μM for Cu2O-NCs-0.2 and Cu2O-NCs-5, respectively (Fig. 10b and d, and Table 3). In all cases, the experimental data were also adjusted using a non-linear fit related to a Langmuir expression (see Fig. S12 and Table S2 in ESI†).
It is important to notice that the sensitivity of the electrocatalysts based on relatively smaller starch-capped Cu2O NCs was 1.5 to 2.9 times higher than the starch free Cu2O-based working electrode. In general, these results are consistent with the enhanced electrocatalytic activity expected for relatively smaller Cu2O nanostructures.54 However, in particular, the starch–Cu2O nanocomposites did not follow the expected monotonic behavior in terms of their relative particle sizes. A lack of any specific trend was also reported in the degradation of methyl orange (MO) in the presence of starch-stabilized Cu2O microcrystal-based photocatalysts of different particle sizes.32
4 Conclusions
In this work, Cu2O nanocubes (Cu2O NCs) were successfully synthesized by a green method that includes Benedict’s reagent as the copper precursor, D-(+)-galactose as the reducing agent and starch as the capping agent. The synthesized Cu2O NCs showed a cubic crystalline structure and a high crystallographic purity. The mean particle size values were starch concentration dependent, i.e., the values ranged from 227 to 123 nm in the absence of starch and at the highest amount of starch solution in the synthesis, respectively. In consequence, the electrochemical responses of the Cu2O NCs-modified carbon paste electrodes were starch concentration dependent too, i.e., an increment of the current for the electrochemical glucose oxidation process was observed when smaller Cu2O NCs were used. In addition, glucose was quantified by a potentiodynamic method in the range 100–700 μM with a sensitivity from 85.6 to 238.8 μA mM−1 cm−2. Further experimentation to incorporate the presented electrochemical system in a point of care glucose device is taking place in our research group that may enable us to develop a direct non-enzymatic method suitable for glucose detection in real biological specimens.Author contributions
Antonio Jiménez-Rodríguez: investigation, validation, visualization, writing – original draft. Eduardo Sotelo: investigation. Lidia Martínez: investigation, visualization, writing – review and editing. Yves Huttel: investigation, writing – review and editing. Maria Ujué González: investigation, visualization, writing – review and editing. Alvaro Mayoral: investigation, visualization, writing – review and editing. Jose Miguel García-Martín: supervision, writing – review and editing, funding acquisition. Marcelo Videa: conceptualization, methodology, writing – review and editing. Jorge L. Cholula-Díaz: supervision, conceptualization, methodology, writing – review and editing, funding acquisition.Conflicts of interest
There are no conflicts to declare.Acknowledgements
The authors thank the i-Link+2019 program between CSIC and Tecnologico de Monterrey (ref. LINKB20024 “NANOBIO-ROJA”) for financial support. LM acknowledges financial support from EC through ERC-2013-SYG-610256 and “Comunidad de Madrid” and the European Structural Funds (FotoArt-CM project S2018/NMT-4367). The authors also acknowledge the service from the MiNa Laboratory at IMN, which is funded by Comunidad de Madrid (project S2018/NMT-4291TEC2SPACE), MINECO (project CSIC13-4E-1794), and EU (FEDER, FSE). AM acknowledges the Spanish Ministry of Science through the Ramon y Cajal programme (RYC2018-024561-I), the Regional government of Aragon (DGA E13_20R), the National Natural Science Foundation of China (NFSC-21850410448, NSFC-21835002) and the Centre for High-resolution Electron Microscopy (CℏEM), supported by SPST of ShanghaiTech University under contract No. EM02161943. We also thank the School of Engineering and Sciences at Tecnologico de Monterrey for partial funding provided through the Research Chair of Photonics and Quantum Systems and the Department of Science (Chemistry and Nanotechnology) at Tecnologico de Monterrey for access to laboratories and characterization equipment.Notes and references
- L. A. Terry, S. F. White and L. J. Tigwell, J. Agric. Food Chem., 2005, 53, 1309–1316 CrossRef CAS PubMed.
- W. Lu, Y. Sun, H. Dai, P. Ni, S. Jiang, Y. Wang, Z. Li and Z. Li, Sens. Actuators, B, 2016, 231, 860–866 CrossRef CAS.
- K. Ghanbari and Z. Babaei, Anal. Biochem., 2016, 498, 37–46 CrossRef CAS PubMed.
- R.-m. Yuan, H.-j. Li, X.-m. Yin, J.-h. Lu and L.-l. Zhang, Talanta, 2017, 174, 514–520 CrossRef CAS PubMed.
- W. Villena Gonzales, A. Toaha Mobashsher and A. Abbosh, Sensors, 2019, 19, 800 CrossRef PubMed.
- Y. Su, H. Guo, Z. Wang, Y. Long, W. Li and Y. Tu, Sens. Actuators, B, 2018, 255, 2510–2519 CrossRef CAS.
- Y. Zhang, Y. Liu, L. Su, Z. Zhang and D. Huo, Sens. Actuators, B, 2014, 191, 86–93 CrossRef CAS.
- P. Gao and D. Liu, Sens. Actuators, B, 2015, 208, 346–354 CrossRef CAS.
- L. F. de Castro, S. V. de Freitas, L. C. Duarte, J. A. C. de Souza, T. R. L. C. Paixão and W. K. T. Coltro, Anal. Bioanal. Chem., 2019, 411, 4919–4928 CrossRef CAS.
- D. Xu, C. Zhu, X. Meng, Z. Chen, Y. Li, D. Zhang and S. Zhu, Sens. Actuators, B, 2018, 265, 435–442 CrossRef CAS.
- W. Zhang, Y. Du and M. L. Wang, Sens. Biosens. Res., 2015, 4, 23–29 Search PubMed.
- J. Yang, W.-D. Zhang and S. Gunasekaran, Biosens. Bioelectron., 2010, 26, 279–284 CrossRef CAS PubMed.
- S. Felix, P. Kollu and B. P. C. Raghupathy, J. Chem. Sci., 2014, 126, 25–32 CrossRef CAS.
- D.-L. Zhou, J.-J. Feng, L.-Y. Cai, Q.-X. Fang, J.-R. Chen and A.-J. Wang, Electrochim. Acta, 2014, 115, 103–108 CrossRef CAS.
- J. L. K. Jayasingha, M. N. Kaumal, K. M. D. C. Jayathilaka, M. S. Gunewardene, D. P. Dissanayake, J. K. D. S. Jayanetti and I. Cu, Phys. Status Solidi A, 2017, 1700135, 2–8 Search PubMed.
- Q. Li, P. Xu, B. Zhang, H. Tsai, S. Zheng, G. Wu and H.-l. Wang, J. Phys. Chem. C, 2013, 117, 13872–13878 CrossRef CAS.
- K. Kaviyarasan, S. Anandan and R. Viswanathan, Ultrason. Sonochem., 2016, 29, 388–393 CrossRef CAS PubMed.
- H. Liu, Z. Hu, R. Hu, B. Liu, H. Ruan, L. Zhang and W. Xiao, Int. J. Electrochem. Sci., 2016, 11, 2756–2761 CrossRef CAS.
- Y. Cao, Y. Xu, H. Hao and G. Zhang, Mater. Lett., 2014, 114, 88–91 CrossRef CAS.
- P. Raveendran, J. Fu and S. L. Wallen, J. Am. Chem. Soc., 2003, 125, 13940–13941 CrossRef CAS PubMed.
- V. V. Thekkae Padil and M. Černík, Int. J. Nanomed., 2013, 8, 889–898 Search PubMed.
- H. Duan, D. Wang and Y. Li, Chem. Soc. Rev., 2015, 44, 5778–5792 RSC.
- B. Lalithadevi, K. M. Rao and D. Ramananda, Chem. Phys. Lett., 2018, 700, 74–79 CrossRef CAS.
- Z. Sabouri, A. Akbari, H. Ali and M. Darroudi, J. Mol. Struct., 2018, 1173, 931–936 CrossRef CAS.
- O. S. Oluwafemi, N. Vuyelwa, M. Scriba and S. P. Songca, Mater. Lett., 2013, 106, 332–336 CrossRef CAS.
- R. Zamiri, A. Zakaria, H. Abbastabar, M. Darroudi, A. Khorsand and G. P. C. Drummen, J. Alloys Compd., 2012, 516, 41–48 CrossRef CAS.
- A. Hebeish, T. I. Shaheen and M. E. El-Naggar, Int. J. Biol. Macromol., 2016, 87, 70–76 CrossRef CAS PubMed.
- D. Lomelí-Marroquín, D. Medina Cruz, A. Nieto-Argüello, A. Vernet Crua, J. Chen, A. Torres-Castro, T. J. Webster and J. L. Cholula-Díaz, Int. J. Nanomed., 2019, 14, 2171–2190 CrossRef PubMed.
- A. Vernet Crua, D. Medina, B. Zhang, M. Ujué González, Y. Huttel, J. M. García-Martín, J. L. Cholula-Díaz and T. J. Webster, Int. J. Nanomed., 2019, 14, 3155–3176 CrossRef PubMed.
- K. Chen and D. Xue, CrystEngComm, 2012, 14, 8068–8075 RSC.
- D. Sun, Y. Du, X. Tian, Z. Li, Z. Chen and C. Zhu, Mater. Res. Bull., 2014, 60, 704–708 CrossRef CAS.
- D. Sun, Y. Du, Z. Li, Z. Chen and C. Zhu, J. Sol-Gel Sci. Technol., 2016, 10–12 Search PubMed.
- N. E. Markina, M. V. Pozharov and A. V. Markin, J. Chem. Educ., 2016, 93, 704–707 CrossRef CAS.
- W.-c. Huang, L.-m. Lyu, Y.-c. Yang and M. H. Huang, J. Am. Chem. Soc., 2012, 134, 1261–1267 CrossRef CAS PubMed.
- J. Graves, E. Latvytė, A. Greenwood and N. Emekwuru, Ultrason. Sonochem., 2019, 55, 25–31 CrossRef CAS PubMed.
- L. O. Cinteza, C. Scomoroscenco, S. N. Voicu, C. L. Nistor, S. G. Nitu, B. Trica, M. L. Jecu and C. Petcu, Nanomaterials, 2018, 8, 1–16 CrossRef PubMed.
- C. F. MacRae, I. Sovago, S. J. Cottrell, P. T. Galek, P. McCabe, E. Pidcock, M. Platings, G. P. Shields, J. S. Stevens, M. Towler and P. A. Wood, J. Appl. Crystallogr., 2020, 53, 226–235 CrossRef CAS PubMed.
- A. Kirfel and K. Eichhorn, Acta Crystallogr., Sect. A: Found. Crystallogr., 1990, 46, 271–284 CrossRef.
- S. Singh, N. Kumar, M. Kumar, A. Agarwal and B. Mizaikoff, Chem. Eng. J., 2017, 313, 283–292 CrossRef CAS.
- M. I. Nabila and K. Kannabiran, Biocatal. Agric. Biotechnol., 2018, 15, 56–62 CrossRef.
- L. Tang, J. Lv, C. Kong, Z. Yang and J. Li, New J. Chem., 2016, 40, 6573–6576 RSC.
- F. J. Warren, M. J. Gidley and B. M. Flanagan, Carbohydr. Polym., 2016, 139, 35–42 CrossRef CAS PubMed.
- J. M. Fang, P. A. Fowler, J. Tomkinson and C. A. S. Hill, Carbohydr. Polym., 2002, 47, 245–252 CrossRef CAS.
- R. Kizil, J. Irudayaraj and K. Seetharaman, J. Agric. Food Chem., 2002, 50, 3912–3918 CrossRef CAS PubMed.
- I. Dankar, A. Haddarah, F. E. L. Omar and F. Sepulcre, Food Chem., 2018, 260, 7–12 CrossRef CAS PubMed.
- S. Kumar, A. K. Ojha, D. Bhorolua, J. Das and A. Kumar, Phys. B, 2019, 558, 74–81 CrossRef CAS.
- P. N. Sibiya, T. Xaba and M. J. Moloto, Pure Appl. Chem., 2016, 88, 61–69 CAS.
- S. Kumar, C. M. Parlett, M. A. Isaacs, D. V. Jowett, R. E. Douthwaite, M. C. Cockett and A. F. Lee, Appl. Catal., B, 2016, 189, 226–232 CrossRef CAS.
- J. Ghijsen, L. H. Tjeng, J. van Elp, H. Eskes, J. Westerink, G. A. Sawatzky and M. T. Czyzyk, Phys. Rev. B: Condens. Matter Mater. Phys., 1988, 38, 11322–11330 CrossRef CAS PubMed.
- S. Poulston, P. M. Parlett, P. Stone and M. Bowker, Surf. Interface Anal., 1996, 24, 811–820 CrossRef CAS.
- G. Beamson and D. Briggs, High Resolution XPS of Organic Polymers: The Scienta ESCA300 Database, Wiley, 1992 Search PubMed.
- K. Sharma, K. Maiti, N. Hoon, D. Hui and J. Hee, Composites, Part B, 2018, 138, 35–44 CrossRef CAS.
- P. Abikshyeet, V. Ramesh and N. Oza, Diabetes, Metab. Syndr. Obes.: Targets Ther., 2012, 5, 149–154 Search PubMed.
- X. Yan, J. Yang, L. Ma, X. Tong, Y. Wang and G. Jin, J. Solid State Electrochem., 2015, 19, 3195–3199 CrossRef CAS.
- M. Liu, R. Liu and W. Chen, Biosens. Bioelectron., 2013, 45, 206–212 CrossRef CAS PubMed.
- S. Velmurgan, R. Devasenathipathy, S. M. Chen and S. F. Wang, Electroanalysis, 2016, 28, 1547–1552 CrossRef CAS.
Footnote |
| † Electronic supplementary information (ESI) available: XRD patterns of six independent replicates of sample Cu2O-NCs-1. EDX analysis of the four Cu2O NCs samples. XPS analysis of samples Cu2O-NCs-0 and Cu2O-NCs-5. Non-linear fits of the electrochemical glucose determination by CV. See DOI: 10.1039/d0ra10054d |
| This journal is © The Royal Society of Chemistry 2021 |

