 Open Access Article
miRNA-mediated alteration of sulfatase modifying factor 1 expression using self-assembled branched DNA nanostructures†
Kanchan Kumariab,
Avishek Kara,
Ashok K. Nayaka,
Sandip K. Mishrac and
Umakanta Subudhi *ad
*ad
aDNA Nanotechnology & Application Laboratory, CSIR-Institute of Minerals & Materials Technology, Bhubaneswar, 751013, India. E-mail: usubudhi@immt.res.in; subudhisai@gmail.com
bDepartment of Molecular Biology, Umea University, Sweden
cCancer Biology Laboratory, Institute of Life Sciences, Bhubaneswar, 751023, India
dAcademy of Scientific & Innovative Research (AcSIR), Ghaziabad-201002, Uttar Pradesh, India
First published on 11th March 2021
Abstract
Sulfatase enzymes catalyze sulfate ester hydrolysis, thus deficiencies of sulfatases lead to the accumulation of biomolecules resulting in several disorders. One of the important sulfatases is estrone sulfatase that converts inactive estrone sulfate to active estradiol. Posttranslational modification of highly conserved cysteine residue leads to unique formylglycine in the active site of sulfatases being critical for its catalytic activity. The essential factor responsible for this modification of sulfatase is Sulfatase-Modifying Factor 1 (SUMF1). The role of estrone sulfatase is well evident in breast cancer progression. However, the function and regulation of SUMF1 in cancer are not studied. In the present study, for the first time, we have assessed the expression of SUMF1 in breast cancer and report the oncogenic behavior upon overexpression of SUMF1. Although increased expression or activity of SUMF1 is anticipated based on its function, the expression of SUMF1 was found to be reduced in breast cancer cells at both mRNA and protein levels. An estrogen receptor (ER) dependent expression of SUMF1 was observed and higher SUMF1 expression is associated with improved breast cancer patient survival in ER-positive cases. However, high SUMF1 expression leads to reduced median survival in ER-negative breast cancer patients. Putative binding sites for miRNAs-106b-5p, 128-3p and 148b-3p were found at 3′-UTR of SUMF1. Since self-assembled branched DNA (bDNA) structures have emerged as a highly efficient strategy for targeting multiple miRNAs simultaneously, we studied the alteration in SUMF1 expression using bDNA nanostructures with a complementary sequence to miRNAs. The findings suggest the involvement of co-regulators and repressors in miRNA-mediated SUMF1 expression in breast cancer cells and reveal the therapeutic potential of SUMF1 in endocrine-related malignancies.
Introduction
Estrogen is a principal hormone that plays an important role in the development and differentiation of the mammary gland.1 Owing to its function, estrogen is critically involved in hormone-responsive breast cancer progression. The role of estrogen in breast carcinoma suggests the importance of targeting the synthesis and degradation of estrogen in the body. Cholesterol-derived C18 steroids or estrogen is found in three major natural forms namely estrone (E1), estradiol (E2), and estratriol (E3). All the forms of estrogen are present in serum and tissues at different concentrations at different stages of life.2 The most potent estrogen 17β-estradiol (E2) is present as the main circulating hormone in pre-menopausal women and plays an important role during pregnancy.3 However, in post-menopausal women and during the menstrual cycle, E1 is present five to ten times more than E2 or E3.4,5 Estrone sulfates act as a precursor of estrogen and thus sulfates of estrone and estradiol have been found to present in huge quantities in breast cancer tissues.6 Metabolic responses of estrone sulfate are different in hormone-independent and dependent breast cancer cells.7 Estrone sulfates are hydrolyzed into estrone and finally into potent estradiol with the help of enzyme steroid sulfatases (STS). The activity of STS was found intense in hormone-dependent cell lines in comparison to hormone-independent.8 Breast carcinoma patients harbor significantly increased expression of STS suggesting its important role in the intratumoral synthesis of estrogen in post-menopausal women. Like other sulfatases, STS is activated when either cysteine or serine is post-translationally oxidized into formylglycine (fGly) in the active site of STS.9 This post-translational modification is specifically performed by the enzyme known as formylglycine generating enzyme (FGE) which is encoded by the gene sulfatase modifying factor 1 (SUMF1).SUMF1 gene is located in human chromosome 3, and plays a critical role in sulfatase enzyme activation, which is required for hydrolysis of sulfate esters. Mutation in SUMF1 gene is known to affect several diseases including multiple sulfatase deficiency (MSD), chronic obstructive pulmonary disease etc.10–12 Nevertheless, the direct regulation of estrogen synthesis by SUMF1 has been a contributing factor for the initiation of cancer in several tissues. For instance, estrone sulfate is proposed to be a prognostic marker for aggressive prostate cancer.13 Similarly, higher activity of estrogen sulfatase is evidenced in ovarian cancer14,15 and endometrium cancer.16 The role of estrone sulfatase is also well evident in breast cancer progression, however the direct role of SUMF1 in breast carcinoma remains elusive. Although recent study reports SUMF1 as a direct target of epigenetic molecule EZH2 in breast cancer,17 no study has been done to understand the function and regulation of SUMF1 in breast cancer. Keeping this as background, the present study explores the expression of SUMF1 in breast cancer cell lines along with the effect of its overexpression on cancer cell proliferation. Overall, the study highlights the significance of SUMF1 in estrogen synthesis and thus in endocrine-related carcinomas and proposes that targeting SUMF1 may be of therapeutic potential.
Recently, non-coding RNAs including microRNAs are reported to play important role in gene expression. Since regulation of SUMF1 by miRNAs is unexplored, the second objective of the present investigation is to identify and examine miRNA-mediated alteration in the expression of SUMF1. Nevertheless, the function and regulation of miRNAs have emerged as a new class of biomarkers for several diseases including cancer, and a potential tool for therapy.18–20 It is interesting to note that one miRNA can regulate the expression of multiple genes and on the other hand, the expression of an individual gene is controlled by multiple miRNAs. Thus, a suitable method of delivering multiple miRNAs is a prerequisite to understanding the function of any gene. In the last two decades, self-assembled branched DNA (bDNA) nanostructures have evolved as powerful nanoscale engineered molecules for materials and biomedical applications.21–25 Moreover, bDNA nanostructures have been proved to be an efficient strategy for microRNAs-based cancer therapy.26–28 Recently, our group has shown the efficacy of antimiR-bDNA nanostructures in regulating the expression of tumor suppressor FOXO1 in breast cancer by synergistic down-regulation of three oncogenic miRNAs.29 Biocompatible self-assembled bDNA nanostructures increase the efficiency and bioavailability of therapeutics like miRNA or antimiRNA by protecting from nuclease degradation and enhancing the half-life of oligonucleotides bound to the bDNA nanostructures.30–33 Thus, in the current communication, we studied miRNA-mediated modification of SUMF1 expression in breast cancer using bDNA nanostructures. Particularly, the expression of miRNAs-106b-5p, 128-3p, and 148b-3p were thoroughly examined since the putative binding sites of these miRNAs were found at the 3′-UTR of SUMF1. An altered expression of SUMF1 was noticed while modifying the expression of miRNAs using bDNA structures, but at the same time suggested an indirect method of regulation of miRNA-mediated expression of SUMF1. Nevertheless, the data suggested the participation of other molecular players in regulating SUMF1 expression in breast cancer.
Methods
Cell culture
The human cell lines HEK293, MCF-7, MDA-MB-231, T47D, BT474, and SKBR3 were obtained from the National Repository of Animal Cell Culture (NCCS Pune, Maharashtra, India). HEK293, MCF-7, and BT474 cells were maintained in DMEM containing 10% fetal bovine serum supplemented with penicillin–streptomycin at 37 °C, 5% CO2, and 95% humidity. Similarly, MDA-MB-231, T47D and SKBR3 cells were maintained in RPMI having 10% fetal bovine serum supplemented with penicillin–streptomycin at 37 °C, 5% CO2, and 95% humidity. Normal breast epithelial cells MCF-10A was a kind gift of Prof. Annapoorni Rangarajan (IISc Bangalore). MCF10A was maintained as previously described17 to extract whole cell lysate.Western blot
The cells were lysed in RIPA lysis buffer, electrophoresed on 10% SDS-polyacrylamide gel and the proteins were transferred onto polyvinylidene difluoride (PVDF) membrane. After blocking with 5% skimmed milk, the membrane was incubated with SUMF1 (PAC879Hu01, Cloud-Clone Corp.) or α-tubulin (T5168, Sigma) primary antibody for overnight at 4 °C. The next day, the membrane was washed with TBS-T and incubated with HRP-conjugated anti-rabbit mouse secondary antibody for 1 h. The immunoblot was washed with TBS-T five times at 5 min intervals and developed using luminol (sc-2048, Santacruz) in a Chemidoc imaging system (Bio-Rad).Self-assembled bDNA nanostructures carrying antimiR sequences
To study the effects of miRNA-106, 128, and 148 on the expression of SUMF1, single-stranded oligonucleotides for miRNA or antimiR sequences (Table S1†) were transfected with transfection reagent (INTERFERin®, Polyplus). All the oligonucleotides used in the study were procured from Integrated DNA Technology, USA, and were directly used in the study without further purification or modification (Table S1†). Self-assembled bDNA structures targeting miR-106, 128, and 148 were designed by replacing the four overhangs of the previously designed structure by our group29,30 with complementary sequences of miR-106, 128, and 148. The oligonucleotides scramble A, oligo B, oligo C, scramble D, antimiR-106A, antimiR-106D, antimiR-128A, antimiR-128D, antimiR-148A, antimiR-148D and antimiR-106-128A were designed specifically and used in an appropriate ratio to form five different bDNA structures such as bDNA-scramble, antimiR-bDNA-106, antimiR-bDNA-128, antimiR-bDNA-148 and antimiR-bDNA-mix (Fig. S1†). Appropriate proportions of oligonucleotides were allowed to self-assemble in TAE/Mg2+ buffer at 95 °C for 10 min and then slowly cool down to 4 °C using thermal cycler (Bio-Rad) facilitating the formation of bDNA scaffold.30,32 The bDNA structures were checked for their integrity on 10% native polyacrylamide gel that was electrophoresed at 150 V for 1.5 h in TAE buffer. The gels were stained with ethidium bromide and imaged using the FluroChem E system (Cell Biosciences). 1 μM of oligonucleotides were used to prepare the bDNA structures from a stock of 100 μM. 50 μl of self-assembled bDNA structures was used to transfect the cells in 6-well tissue culture plates (final volume 2 ml) using lipofectamine 3000 according to the manufacturer's protocol. Fluorescein labeled oligo B was used in bDNA structures to check the transfection of bDNA structures (Fig. S1f†). The pictures for fluorescence were captured at excitation 460 nm and emission 515 nm using Leica microscope (Leica DM3000).RNA extraction, reverse transcriptase PCR and quantitative real time PCR
Total RNA was extracted from cells using the Trizol method. 1 μg of RNA was used to synthesize cDNA using a cDNA synthesis kit (18080051, Invitrogen). Reverse transcriptase PCR and qRT-PCR (Roche) was performed using gene-specific primers (Table S1†) and SYBR green (04707516001, Roche Diagnostics). The RT images were quantified using ImageJ software. qRT-PCR data were used to calculate the relative fold change for each gene compared to control using the value of cycle threshold (CT value). 18S rRNA amplification was used for the normalization of the data.Correlation study and KM plotter analysis
Correlation values indicate the strength of association between two genes in terms of correlation coefficient (r) values that can be exit between +1 and −1. Negative and positive value indicates nature of association between genes. The value of +1 and −1 for correlation indicates a perfect linear relationship. To study the correlation for expression of SUMF1 and ERα in cancerous as well as non-cancerous breast cell lines and normal as well as primary breast tissues, the expression of SUMF1 and ERα was studied in the MERAV database that allows comparing the expression of multiple genes simultaneously in a large number of normalized microarray datasets.34 The association of SUMF1 in estrogen receptor-positive and negative breast cancer cells was analyzed using Kaplan Meier plotter database that includes 3951 breast cancer patient samples from GEO datasets.35Crystal violet assay
For crystal violet assay, 5 × 10⁴ cells were seeded in 6-well tissue culture plates and transfected with either empty vector pcDNA3.1 or pcDNA3.1 Neo(+) hSUMF1 (Addgene) using lipofectamine 3000 as per manufacturer's instructions (Invitrogen) after 24 h of attachment. After 72 h of transfection, the cells were fixed using 10% formalin at shaking condition for 20 min. The cells were washed with phosphate buffer saline (PBS) and stained with 0.1% crystal violet in water for 30 min. The cells were washed with PBS to remove the excess stain. The fixed and stained cells were air-dried, photographed, and dissolved in 10% acetic acid to quantify the stain. The absorbance was read at 570 nm in a plate reader (Varioskan™ Flash Multimode Reader, Thermo Scientific). Percentage of viable cells = absorbance at 570 nm (pcDNA3.1 Neo(+) hSUMF1 transfected cells)/absorbance at 570 nm (pcDNA3.1 transfected cells) × 100.Cell viability assay
For MTT assay, 3 × 10³ cells were seeded in 96 well plates. After 24 h, the cells were transfected with either empty vector pcDNA3.1 or pcDNA3.1 Neo(+) hSUMF1 (Addgene) using lipofectamine 3000 as per manufacturer's instructions (Invitrogen). After stipulated time intervals, cell viability was determined by performing MTT assay. The MTT reagent was directly added to the growth medium containing cells at a concentration of 5 mg ml−1 and incubated for 4 h at 37 °C in the incubator. The medium containing MTT was carefully taken out and the formazan crystals thus formed were dissolved in 100% DMSO. The absorbance was read at 570 nm in a plate reader and the percentage of cell viability was calculated as described above.Softwares used in the study
To examine the 3′-UTR of SUMF1 for putative miRNA binding sites, online tool Atlas of UTR Regulatory Activity (http://aura.science.unitn.it.)36 was used. The binding sites were further studied for binding scores using miRNA target prediction online tool TargetScan (http://www.targetscan.org/vert_72/).37 The primers used for real-time PCR for specific microRNAs were designed using the online tool sRNAPrimerDB (http://www.srnaprimerdb.com/).38Statistical analyses
The experiments were performed in three different breast cancer cell lines in two biological repeats. Throughout the study, two-tailed paired Student's T-test, one-way and two-way ANOVA was performed to test the statistical significance using the software GraphPad Prism v5.01. With p values *P < 0.05, **P < 0.005 and ***P < 0.001 were considered statistically significant.Results and discussions
ERα-dependent expression and function of SUMF1
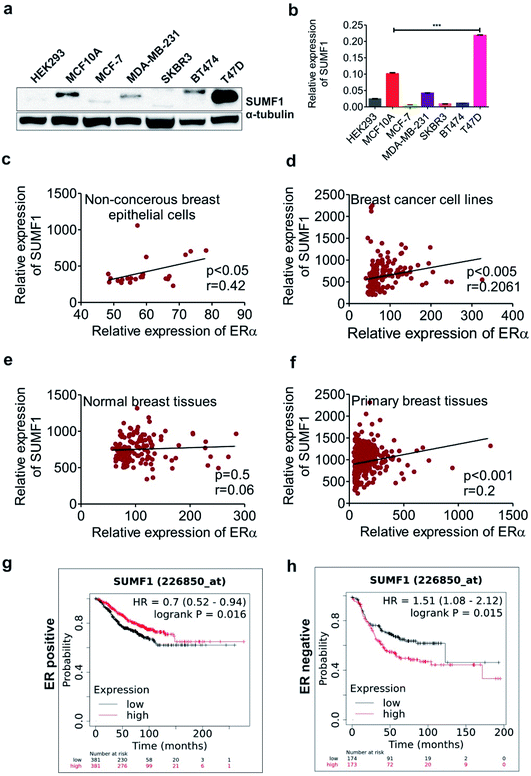
SUMF1 expression in breast cancer cell lines was analyzed using real-time PCR and western blot techniques. Reduced expression of SUMF1 was observed in breast cancer cell lines when compared to normal breast epithelial MCF10A cells at both protein and mRNA levels (Fig. 1a and b). Critical role in estrone sulfate hydrolysis suggests an ERα-dependent expression of SUMF1. To understand the correlation of SUMF1 expression with ERα, we analyzed the MERAV dataset in breast cancerous and non-cancerous cells as well as normal breast tissues and primary breast tumor tissues. Except for normal breast tissues, where a non-significant correlation was noticed (r = 0.06), a significant positive correlation was detected between SUMF1 and ERα expression in non-cancerous (r = 0.42) and cancerous breast cell lines (r = 0.21) as well as in primary breast tumor tissues (r = 0.2) (Fig. 1c–f). The positive correlation between ERα and SUMF1 suggests increased expression of ERα in presence of increased SUMF1 in cancer. Further, to study the relevance of SUMF1 in breast cancer patient survival, KM plotter analysis was done. Interestingly, higher SUMF1 expression was found to be associated with improved breast cancer patient survival in ER-positive cases. However, in ER-negative breast cancer patients, high SUMF1 expression leads to significantly reduced median survival (Fig. 1g and h). The opposite relation of high SUMF1 expression with patient survival in ERα positive and negative breast cancer indicates its critical role in estrogen level and its pathological consequences. In terms of receptor status, MCF-7, MDA-MB-231, SKBR3, BT474 are ER+/PR+/HER2+, ER−/PR−/HER−/+, ER−/PR−/HER2+, ER−PR+/HER2+ respectively.39Overexpression of SUMF1 leads to increased breast cancer cell proliferation
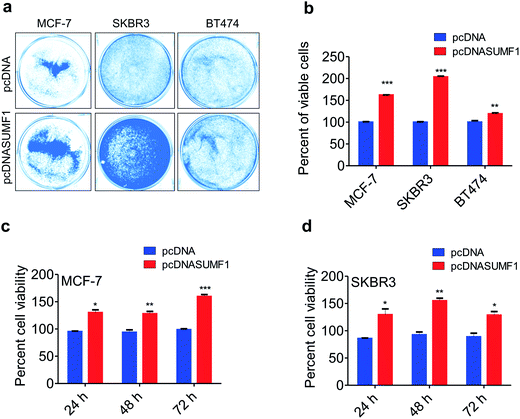
To access the role of SUMF1 in breast cancer, SUMF1 was overexpressed using pcDNASUMF1 in breast cancer cells and performed proliferation assays. Cancer cells with overexpressed SUMF1 showed increased cell proliferation. Crystal violet assay displayed an increased number of viable cells in MCF-7, SKBR3, and BT474 breast cancer cells upon SUMF1 overexpression (Fig. 2a and b). Similar to MDA-MB-231, both SKBR3 and BT474 are ER negative breast cancer cell lines. A similar kind of results was obtained in MTT assay performed in MCF-7 and SKBR3 at three different time points. Percentage of viable cells were significantly increased after 24 h, 48 h, and 72 h of incubation in cells provided with exogenous SUMF1 (Fig. 2c and d). Irrespective of the receptor status of the cell lines, exogenous expression of SUMF1 leads to increased proliferation. Since cell proliferation is directly correlated with the overexpression of SUMF1, we are excited to check the possible regulation of SUMF1 by miRNA.3′-UTR of SUMF1 contains binding sites for miRNAs 106, 128 and 148 which are differentially expressed in breast cancer cell lines
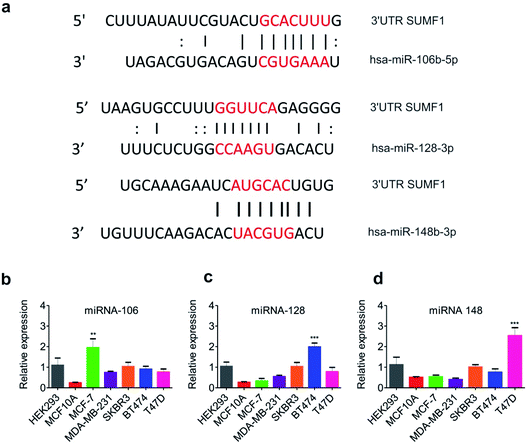
Expression of SUMF1 in breast cancer cell lines was found to be reduced in comparison to normal breast epithelial cells, however, its overexpression leads to increased cancer cell proliferation. At the same time, increased expression of SUMF1 in ER-positive breast cancer patients is significantly associated with improved patient survival opposite to ER-negative patients. To understand the reason behind the reduced expression of SUMF1 in ER-positive breast cancer cells, we were interested to know if any miRNA is known to regulate their expression. miRNAs are widely known to repress its target mRNA by binding to its 3′-UTR leading to mRNA degradation and translation repression.40 With no previous reports, we went on to analyze the 3′-UTR of SUMF1 using the online tool Atlas of UTR Regulatory Activity that predicts putative miRNA binding sites at UTRs (Fig. S2†). Binding sites for miR-106, 128, and 148 was found on 3′-UTR of SUMF1 (Fig. 3a). Using miRDB, the target scores for miR-106 and 148 was found to be 77, and 59 respectively. However, miRDB showed no binding of miR-128 on SUMF1. Therefore, to study the miRNA-mediated SUMF1 regulation, we first examined the expression of the miRNA-106, 128, and 148 in different breast cancer cell lines. On one hand, miRNA-106a-5p displayed an oncogenic role in breast cancer cells by regulating PTEN (phosphatase and tensin homolog),41 AKT, p53, and BCL2.42 Similarly, by regulating another tumor suppressor gene hypermethylated in cancer 1 (HIC1), miRNA-128 is found to accelerate the breast tumor growth in xenograft mice.43 On the other hand, miRNA-148 play important role in chemoresistance by regulating ERα,44 BCL2,45 Wnt-1 (ref. 46) leading to reduced breast cancer cell migration, inhibition, and increased apoptosis. Importantly, we observed a differential expression of miRNA-106, 128, and 148 in breast cancer cells compared to normal breast epithelial cells (Fig. 3b–d). Compared to normal breast epithelial MCF10A cells, the expression level of miR-106 was found significantly high in MCF-7 breast cancer cells. Similarly, BT474 and T47D breast cancer cells were found to harbor an increased level of miR-128 and miR-148 respectively. Thus it is clear that the differential expression of miRNAs in each breast cancer cell lines has a unique way of regulating SUMF1. To understand further agonist and antagonist of miRNAs were transfected and the expression of SUMF1 was observed.Transfection of antimiR or miR sequences modifies the expression of SUMF1 in breast cancer cells
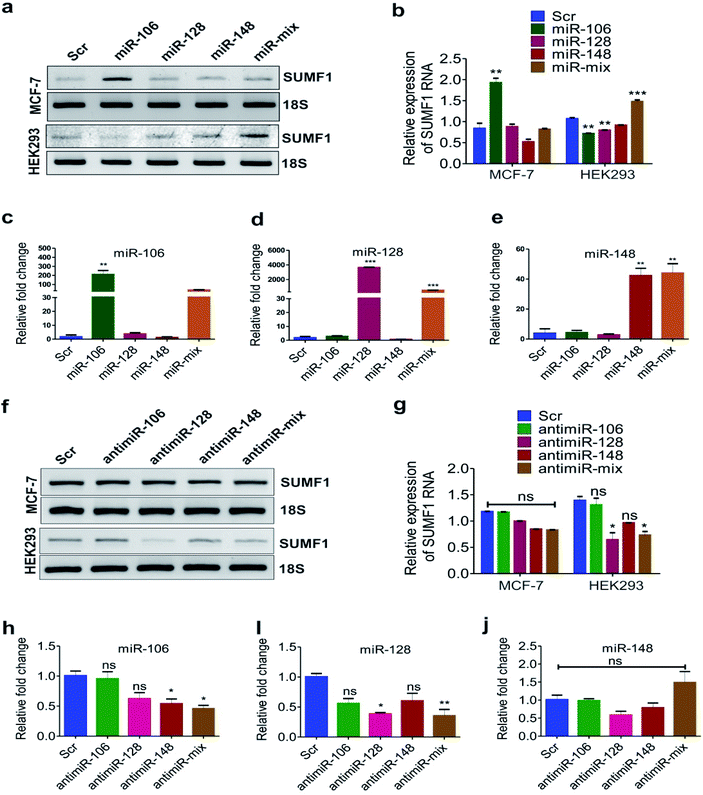
To investigate if these miRNAs target SUMF1, we transfected the cells with oligonucleotides of miRNA-106, 128, and 148 and checked the mRNA expression of SUMF1 by reverse transcriptase PCR. An increased expression of SUMF1 was observed in miR-106 transfected MCF-7 and BT474 cell lines (Fig. 4a, b, S3a and b†). Nevertheless, an upregulation of SUMF1 was also noticed in BT474 transfected with miR-128 and 148 (Fig. S3a and b†). On the other hand, a significant downregulation of SUMF1 was observed when BT474 is cotransfected with all the three miRNA (miRNA-mix). Thus, these three miRNAs are unable to show a synergistic effect on SUMF1 expression in BT474. In contrast, expression of SUMF1 was upregulated in HEK293 cells only when all three miRNA mimics were transfected. Hence, the expression of SUMF1 with respect to the transfection of miRNA-106, 128, and 148 are opposite for HEK-293 and BT474. To check the expression status of miRNAs in MCF-7 transfected cells, we performed quantitative real-time PCR (qRT-PCR). As shown in Fig. 4c–e expression of all three miRNAs were significantly upregulated in respective transfected samples and in the combination which suggested that the expression level of SUMF1 as observed in Fig. 4a is due to the altered level of miRNAs. Further to validate the miRNA-mediated above observation, we transfected antimiR oligonucleotides and checked the expression of SUMF1 and miRNAs. Interestingly, a non-significant but reduced trend of SUMF1 expression was observed in both MCF-7 as well as HEK293 cells (Fig. 4f and g). A non-significant reduction in the expression of miRNAs was also detected in antimiR oligonucleotides transfected samples. Expression of both miRNA-128 and 148 was down-regulated after transfection with antimiR oligonucleotides, whereas no significant change was observed in the expression of miRNA-106 (Fig. 4h–j). The use of antisense oligonucleotides complementary to miRNA sequence has been widely used to target miRNAs. As per expectation, antisense oligonucleotides (ASO) must bind to the target miRNA and stimulate RNase dependent degradation of target RNA. Moreover, modified ASO which is preferred over unmodified ASO may show different adverse effects on miRNA activity such as sterically blocking the target miRNA leading to reduced accessibility of antimiR-miRNA duplex to RNase H.47,48 Recently, bDNA nanostructures have been proved to provide a stable and efficient approach to targeting miRNA. Upon analyzing the miRNA database miRDB, we hypothesized that possibly an expression of SUMF1 is regulated by hsa-miR-106b-5p, has-miR-128-3p, and hsa-miR-148b-3p. Therefore, self-assembled bDNA nanostructures containing antimiR sequences for miR-106, 128, and 148 were used to study the expression of SUMF1.bDNA nanostructures containing antimiRs significantly reduced the expression of miRNAs
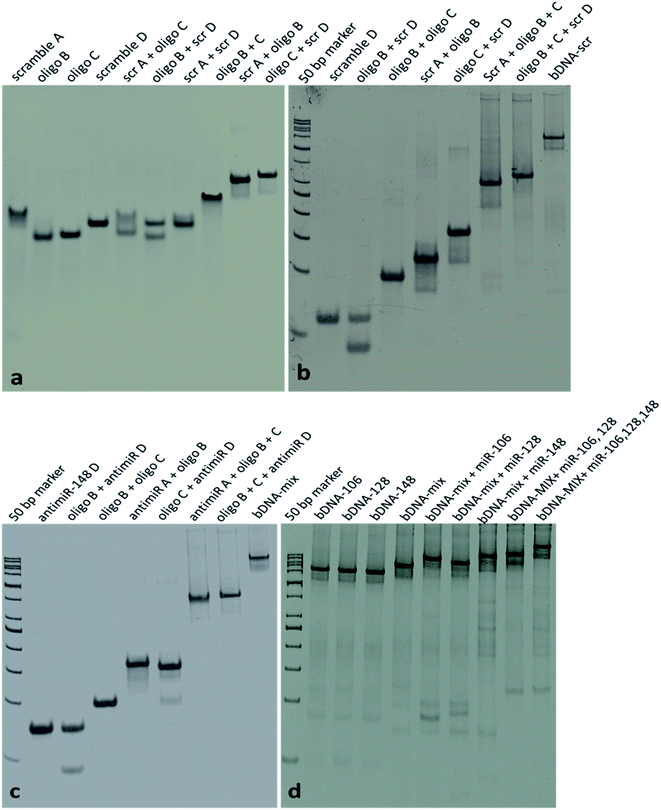
We have designed bDNA structures containing antimiR sequences for miRNA-106, 128, and 148 as previously described by our group.29 The integrity of the structure was checked using native polyacrylamide gel. Individual oligonucleotides showed a band with good intensity and the oligo bound to complementary sequences (AB and CD di-oligo complex) exhibited retarded migration in nPAGE (Fig. 5a). As expected, oligonucleotides like A, C, or B, D or A, D were unable to form di-oligo complex unlike oligos A, B or C, D. Then bDNA-scr, antimiR-bDNA-106, bDNA-128, bDNA-148, and bDNA-mix were self-assembled and a clear intense band was observed near the loading wells which suggest the formation of stable self-assembled bDNA structure (Fig. 5). Before transfection, we are excited to examine the specific binding of miRNA sequences to the antimiR-bDNA structures. Interestingly, a notable shift in the band was observed that indicated the successful binding of miR sequences to the respective antimiR binding sites in bDNA structures (Fig. 5d). Nevertheless, with an increase in miRNA numbers the bound product to the antimiR-bDNA-mix were also more retarded which ensures the efficient binding of multiple miRNAs. To study the efficiency of self-assembled bDNA upon single oligonucleotides, antimiRNA oligonucleotides and antimiR-bDNA structures were transfected with equal concentrations into the MCF-7 and HEK-293 cells, and the expression of miRNAs and SUMF1 was studied by qRT-PCR.SUMF1 expression is reduced upon transfection with antimiR-bDNA structures
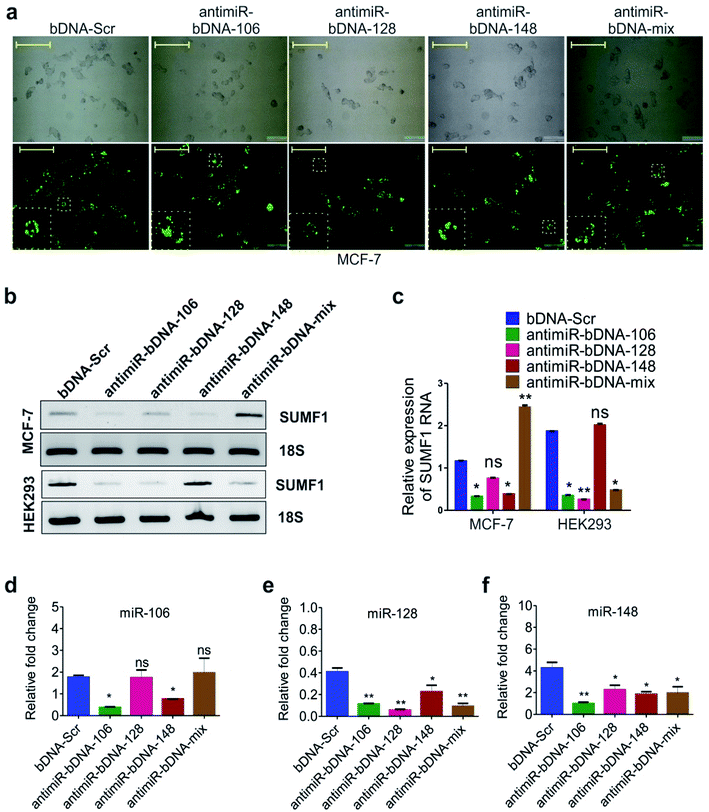
Self-assembled antimiR-bDNA structures which contain antimiR sequences for miR-106, 128, 148 in overhangs were used to study the expression of SUMF1 (Fig. S1†). Fig. 6a shows the brightfield images of fluorescein labeled bDNA transfected MCF-7 cells. Reduced expression of SUMF1 was evidenced in MCF-7 cells transfected with antimiR-bDNA-106, 128, and 148 but not with antimiR-bDNA-mix (Fig. 6b and c). Significant reduction in the expression of miRNA-106, 128, and 148 was also detected in MCF-7 cells transfected with respective antimiR-bDNA nanostructures (Fig. 6d–f). It was interesting to see that the expression of other miRNA was also affected along with the bDNA transfected for specific miRNA. For instance, expression of miRNA-128 and 148 was significantly reduced in cells transfected with antimiR-bDNA-128 and antimiR-bDNA-mix (Fig. 6e and f). Similarly, expression of all three miRNAs was reduced in MCF-7 cells transfected with antimiR-bDNA-106 and 148. These results suggest that the expression of miRNA-106 and 148 have a positive correlation with the expression of SUMF1 in MCF-7 cells. When a decline in expression of miRNA-106 and 148 was observed, the expression of SUMF-1 also decreases concomitantly. Possibly miRNA-106 and miRNA-148 block the expression of a repressor protein that plays an important role in SUMF-1 expression. Thus, when antimiR-bDNA-106 and 148 transfected the level of miRNA-106 and 148 decreases in MCF-7 and in turn the expression of repressor protein increases which result into down-regulation of SUMF-1. Similarly, the expression of SUMF-1 is significantly down-regulated in HEK-293 and BT474 transfected with antimiR-bDNA-106, 128 and mix nanostructures (Fig. 6b, c, S3c and d†). The results suggest that expression of miRNAs is different in different cell lines and they differentially regulate the target gene. In this study for the first time, we demonstrate that antimiR-bDNA-106, 128 and 148 down-regulate the expression of SUMF-1 by releasing the SUMF-1 repressor. Interestingly, other important targets of hsa-miR-106, 128, and 148 can be examined to understand the regulation of SUMF1 through miRNA.45Regulation of gene expression in cancer is an intricate process that involves genetic, epigenetic as well as environmental factors. Action of estrogen hormone is one of the metabolic factors that critically involved in the breast cancer development and progression. Synthesis and degradation of hormone estrone is regulated by large number of molecular players that are in turn regulated at both transcriptional and post-transcriptional level. Sulfate esters of estrogen act as reservoir of estrogen and are hydrolyzed by the enzyme estrogen sulfatases or steroid sulfatases that are elevated in breast carcinoma cases. Role of SUMF1 in activation of sulfatases is well evident in cases of multiple sulfatase deficiency where SUMF1 is mutated.49,50 If we analyze the SUMF1 promoter (3 kb upstream), binding sites of several important transcription factors is comprehended (Table S2†). The list includes critical transcription regulators such as ERα, ERβ, p53, Nrf2, AP-1, Sp-1, p300, E2F, NF-AT1, FOXO3a, GATA3, NF-Y and cMyc. Regulation of SUMF1 by these transcription factors will be interesting to study in future. Overall, miRNA-106, 128 and 148 regulates SUMF1 expression indirectly and further research in this area will identify the direct regulators of SUMF1 in cancer.
Conclusions
Here in this study, for the first time we show the differential expression of SUMF1 in breast cancer cell lines and its association with overall breast cancer patient survival which was found to be dependent on estrogen receptor alpha. Moreover, its ectopic expression was found to have stimulatory role on breast cancer cell proliferation. SUMF1 expression was found to be increased with transfection of oligonucleotides of miRNA-106, 128 and 148. Moreover, a reduced expression of SUMF1 was noticed upon transfection with bDNA nanostructures containing antimiR sequences of the miRNAs. This indicated the participation of other molecular players similar to estrogen receptor alpha that determines the association of SUMF1 expression with patient survival and that anticipates further research in this area.Author contributions
K. K. and U. S. designed the project. K. K., A. K., and A. K. N. performed the experiments and acquired the data. K. K., S. K. M. and U. S. drafted and critically reviewed the manuscript. All the authors read and approved the manuscript submission.Conflicts of interest
The authors declare no potential conflicts of interest.Acknowledgements
Authors are thankful to the Council of Scientific & Industrial Research (CSIR) and Department of Biotechnology (DBT), Government of India, New Delhi for supporting the work.References
- C. Brisken and B. O'Malley, Cold Spring Harbor Perspect. Biol., 2010, 2, a003178 CrossRef CAS PubMed.
- C. J. Gruber, W. Tschugguel, C. Schneeberger and J. C. Huber, N. Engl. J. Med., 2002, 346, 340–352 CrossRef CAS PubMed.
- D. L. Loriaux, H. J. Ruder, D. R. Knab and M. B. Lipsett, J. Clin. Endocrinol. Metab., 1972, 35, 887–891 CrossRef CAS PubMed.
- J. R. Pasqualini, C. Gelly, B. L. Nguyen and C. Vella, J. Steroid Biochem., 1989, 34, 155–163 CrossRef CAS.
- E. Samojlik, R. J. Santen and T. J. Worgul, Steroids, 1982, 39, 497–507 CrossRef CAS PubMed.
- S. J. Santner, D. Leszczynski, C. Wright, A. Manni, P. D. Feil and R. J. Santen, Breast Cancer Res. Treat., 1986, 7, 35–44 CrossRef CAS PubMed.
- J. R. Pasqualini, C. Gelly and F. Lecerf, Eur. J. Cancer Clin. Oncol., 1986, 22, 1495–1501 CrossRef CAS PubMed.
- J. R. Pasqualini, B. Schatz, C. Varin and B. L. Nguyen, J. Steroid Biochem. Mol. Biol., 1992, 41, 323–329 CrossRef CAS.
- Y. Tsunoda, Y. Shimizu, A. Tsunoda, M. Takimoto, M. A. Sakamoto and M. Kusano, Acta Oncol., 2006, 45, 584–589 CrossRef CAS.
- L. Schlotawa, E. C. Ennemann, K. Radhakrishnan, B. Schmidt, A. Chakrapani, H. J. Christen, H. Moser, B. Steinmann, T. Dierks and J. Gartner, Eur. J. Hum. Genet., 2011, 19, 253–261 CAS.
- J. Weidner, L. Jarenback, K. de Jong, J. M. Vonk, M. van den Berge, C. A. Brandsma, H. M. Boezen, D. Sin, Y. Bosse, D. Nickle, J. Ankerst, L. Bjermer, D. S. Postma, A. Faiz and E. Tufvesson, Respir. Res., 2017, 18, 77 CrossRef.
- G. Diez-Roux and A. Ballabio, Annu. Rev. Genomics Hum. Genet., 2005, 6, 355–379 CrossRef CAS PubMed.
- F. Giton, A. de la Taille, Y. Allory, H. Galons, F. Vacherot, P. Soyeux, C. C. Abbou, S. Loric, O. Cussenot, J. P. Raynaud and J. Fiet, J. Steroid Biochem. Mol. Biol., 2008, 109, 158–167 CrossRef CAS PubMed.
- D. Kirilovas, K. Schedvins, T. Naessen, B. Von Schoultz and K. Carlstrom, Gynecol. Endocrinol., 2007, 23, 25–28 CrossRef CAS PubMed.
- J. C. Chura, C. H. Blomquist, H. S. Ryu and P. A. Argenta, Gynecol. Oncol., 2009, 112, 205–209 CrossRef CAS PubMed.
- L. A. Brinton, B. Trabert, G. L. Anderson, R. T. Falk, A. S. Felix, B. J. Fuhrman, M. L. Gass, L. H. Kuller, R. M. Pfeiffer, T. E. Rohan, H. D. Strickler, X. Xu and N. Wentzensen, Cancer Epidemiol., Biomarkers Prev., 2016, 25, 1081–1089 CrossRef CAS PubMed.
- K. Kumari, B. Das, A. K. Adhya, A. K. Rath and S. K. Mishra, Sci. Rep., 2019, 9, 1974 CrossRef PubMed.
- C. N. Watson, A. Belli and V. Di Pietro, Front. Genet., 2019, 10, 364 CrossRef CAS PubMed.
- M. Ratti, A. Lampis, M. Ghidini, M. Salati, M. B. Mirchev, N. Valeri and J. C. Hahne, Targeted Oncol., 2020, 15, 261–278 CrossRef PubMed.
- A. Finotti, E. Fabbri, I. Lampronti, J. Gasparello, M. Borgatti and R. Gambari, Mol. Diagn. Ther., 2019, 23, 155–171 CrossRef CAS PubMed.
- S. Saha, V. Prakash, S. Halder, K. Chakraborty and Y. Krishnan, Nat. Nanotechnol., 2015, 10, 645–651 CrossRef CAS PubMed.
- L. He, D. Q. Lu, H. Liang, S. Xie, C. Luo, M. Hu, L. Xu, X. Zhang and W. Tan, ACS Nano, 2017, 11, 4060–4066 CrossRef CAS PubMed.
- M. M. Bhanjadeo, A. K. Nayak and U. Subudhi, Biochem. Biophys. Res. Commun., 2017, 485, 492–498 CrossRef CAS PubMed.
- M. M. Bhanjadeo, B. Baral and U. Subudhi, Int. J. Biol. Macromol., 2019, 137, 337–345 CrossRef CAS PubMed.
- J. Koch, S. Gantenbein, K. Masania, W. J. Stark, Y. Erlich and R. N. Grass, Nat. Biotechnol., 2020, 38, 39–43 CrossRef CAS PubMed.
- Q. Liu, D. Wang, M. Yuan, B. F. He, J. Li, C. Mao, G. S. Wang and H. Qian, Chem. Sci., 2018, 9, 7562–7568 RSC.
- A. R. Chandrasekaran, J. A. Punnoose, L. Zhou, P. Dey, B. K. Dey and K. Halvorsen, Nucleic Acids Res., 2019, 47, 10489–10505 CrossRef CAS PubMed.
- R. Jahanban-Esfahlan, K. Seidi, A. Jahanban-Esfahlan, M. Jaymand, E. Alizadeh, H. Majdi, R. Najjar, T. Javaheri and P. Zare, Nanotechnol., Sci. Appl., 2019, 12, 25–46 CrossRef CAS PubMed.
- S. Nahar, A. K. Nayak, A. Ghosh, U. Subudhi and S. Maiti, Nanoscale, 2018, 10, 195–202 RSC.
- A. K. Nayak and U. Subudhi, RSC Adv., 2014, 4, 54506–54511 RSC.
- H. Qian, C. Y. Tay, M. I. Setyawati, S. L. Chia, D. S. Lee and D. T. Leong, Chem. Sci., 2017, 8, 1062–1067 RSC.
- A. K. Nayak, S. K. Rath and U. Subudhi, J. Phys. Chem. B, 2019, 123, 3591–3597 CrossRef CAS PubMed.
- B. Baral, J. Dutta and U. Subudhi, Int. J. Biol. Macromol., 2021, 177, 119–128 CrossRef CAS PubMed.
- Y. D. Shaul, B. Yuan, P. Thiru, A. Nutter-Upham, S. McCallum, C. Lanzkron, G. W. Bell and D. M. Sabatini, Nucleic Acids Res., 2016, 44, D560–D566 CrossRef CAS PubMed.
- B. Gyorffy, A. Lanczky, A. C. Eklund, C. Denkert, J. Budczies, Q. Li and Z. Szallasi, Breast Cancer Res. Treat., 2010, 123, 725–731 CrossRef PubMed.
- E. Dassi, A. Re, S. Leo, T. Tebaldi, L. Pasini, D. Peroni and A. Quattrone, Translation, 2014, 2, e27738 CrossRef PubMed.
- V. Agarwal, G. W. Bell, J. W. Nam and D. P. Bartel, eLife, 2015, 4, e05005 CrossRef PubMed.
- S. Xie, Q. Zhu, W. Qu, Z. Xu, X. Liu, X. Li, S. Li, W. Ma, Y. Miao, L. Zhang, X. Du, W. Dong, H. Li, C. Zhao, Y. Wang, Y. Fang and S. Zhao, Bioinformatics, 2019, 35, 1566–1572 CrossRef CAS PubMed.
- K. Subik, J. F. Lee, L. Baxter, T. Strzepek, D. Costello, P. Crowley, L. Xing, M. C. Hung, T. Bonfiglio, D. G. Hicks and P. Tang, Breast Cancer: Basic Clin. Res., 2010, 4, 35–41 Search PubMed.
- J. O'Brien, H. Hayder, Y. Zayed and C. Peng, Front. Endocrinol., 2018, 9, 402 CrossRef PubMed.
- M. Chen, M. Zang and X. Guo, Int. J. Clin. Exp. Med., 2019, 12, 8044–8056 CAS.
- F. You, H. Luan, D. Sun, T. Cui, P. Ding, H. Tang and D. Sun, DNA Cell Biol., 2019, 38, 198–207 CrossRef CAS PubMed.
- Y. Li, Y. Wang, X. Shen and X. Han, Front. Pharmacol., 2019, 10, 1202 CrossRef CAS PubMed.
- Y. Xu, L. Chao, J. Wang and Y. Sun, Oncol. Lett., 2017, 14, 4736–4740 CrossRef.
- Q. Li, P. Ren, P. Shi, Y. Chen, F. Xiang, L. Zhang, J. Wang, Q. Lv and M. Xie, Anti-Cancer Drugs, 2017, 28, 588–595 CrossRef CAS PubMed.
- Q. Jiang, M. He, M. T. Ma, H. Z. Wu, Z. J. Yu, S. Guan, L. Y. Jiang, Y. Wang, D. D. Zheng, F. Jin and M. J. Wei, Oncol. Rep., 2016, 35, 1425–1432 CrossRef CAS PubMed.
- J. F. Lima, L. Cerqueira, C. Figueiredo, C. Oliveira and N. F. Azevedo, RNA Biol., 2018, 15, 338–352 CrossRef PubMed.
- S. Davis, B. Lollo, S. Freier and C. Esau, Nucleic Acids Res., 2006, 34, 2294–2304 CrossRef CAS PubMed.
- F. Sabourdy, L. Mourey, E. Le Trionnaire, N. Bednarek, C. Caillaud, Y. Chaix, M. A. Delrue, A. Dusser, R. Froissart, R. Garnotel, N. Guffon, A. Megarbane, H. Ogier de Baulny, J. M. Pedespan, S. Pichard, V. Valayannopoulos, A. Verloes and T. Levade, Orphanet J. Rare Dis., 2015, 10, 31 CrossRef PubMed.
- L. Schlotawa, L. A. Adang, K. Radhakrishnan and R. C. Ahrens-Nicklas, Int. J. Mol. Sci., 2020, 21, 3448 CrossRef CAS PubMed.
Footnote |
| † Electronic supplementary information (ESI) available. See DOI: 10.1039/d0ra10733f |
| This journal is © The Royal Society of Chemistry 2021 |

