 Open Access Article
Vibrational energy redistribution in crystalline nitromethane simulated by ab initio molecular dynamics†
Meilin Luab,
Zhaoyang Zheng *b,
Gangbei Zhub,
Yuxiao Wanga and
Yanqiang Yang
 *ab
*ab
aSchool of Physics, Harbin Institute of Technology, Harbin 150001, China. E-mail: yqyang@hit.edu.cn
bNational Key Laboratory of Shock Wave and Detonation Physics, Institute of Fluid Physics, China Academy of Engineering Physics, Mianyang 621900, China. E-mail: zhengzy@yinhe596.cn
First published on 3rd March 2021
Abstract
Ab initio molecular dynamics simulations (AIMD) are systematically performed to study the Vibrational Energy Redistribution (VER) in solid nitromethane (NM) by combining normal mode decomposition and short-time Fourier transform technique. After the selective excitations of all fourteen intramolecular vibrational modes above 400 cm−1, four three-dimensional (3D) excitation and detected vibrational spectra are obtained. The evolution of the kinetic energy proportion of all vibrations are also given and discussed quantitatively. These results show that, as the daughter modes, NO2 symmetric stretches, CH3 stretches and bends are usually excited quickly and relatively conspicuously compared with the other vibrations. Interestingly, we found that, although the stretching vibration of the CN bond which is a bridge between the methyl and nitro group can not respond immediately to the selective excitations, it always accumulates the vibrational energy slowly and steadily. Then, the underlying mechanisms are discussed based on the response of vibrational modes in both the time and frequency domain. As a result, we found that anharmonic transfers following symmetry rules which involve the couplings assisted by the overtones and rotations, as well as the transfers among the adjacent modes, play important roles in the VER of solid NM.
Introduction
Vibrational energy redistribution (VER) or vibrational energy transfer (VET) has a significant impact on the physicochemical dynamics of energetic materials (EMs), such as their initiation to detonation and impact sensitivities.1–5 To elucide the VET paths and the underlying mechanisms, nitromethane (NM) as the simplest one of the nitro EMs has been of great interest for many decades.Experimentally, the vibrational properties of nitromethane have been characterized by IR and Raman technology6–11 and its VET paths could be traced by ultrafast time-resolved pump-probe spectroscopy.12–16 For example, Cavagnat has observed the CH stretching overtone spectra using standard Fourier transform infrared (FTIR) absorption spectroscopy and analyzed the possible couplings by a theoretical model.7 The results showed that the spectra exhibit a profile containing vibration–rotation interaction under the low-lying vibrational excitation (Δν = 1 and 2). Dlott and his co-workers have performed long-term studies on the VER in liquid NM using ultrafast IR-Raman technique.14–16 Recently, they have also observed the VER processes after selective excitations of CH3 stretching vibrations using the improved 3D IR-Raman spectroscopy and showed how daughter modes are generated successively by the parent excitations.16
Theoretically, there have been plenty of studies on the physical and chemical processes of NM, which focus on the early physical events and reaction chemistry under thermal or shock loading.5,17–21 For example, Kabadi and Rice studied the VER in liquid NM after exciting CH3 stretching vibrations by nonequilibrium molecular dynamics (NEMD) based on classical force field.17 The results show the multistage VER processes at different rates agree qualitatively with the earlier measurement by Dlott's group.14 Similarly, Islam and Strachan have simulated the time-resolved spectroscopic response after shock loading in liquid NM using the reactive molecular dynamics and correlated the spectral features with its reaction mechanisms compared with laser-driven shock experiments.21 However, due to the limitations of the research methods used in these studies, there is still a lack of deep insight in the physical mechanisms of theses VER processes. On the one hand, the statistical methods are inapplicable to small molecule NM because of its relatively sparse density of vibrational states,2,18 on the other hand, the cubic or quartic anharmonic force constants of NM can not be obtained easily for analysis of multi-phonon interactions. Moreover, the inner rotation of methyl group always complicates the coupling and energy transfer between the vibrational modes.7,22–25
In our recent work, ab initio molecular dynamics (AIMD) simulations were performed and reproduced the VER processes after the selective excitation of CH3 stretching vibrations. It showed that AIMD simulation is a powerful tool to reveal the corresponding coupling mechanisms in solid NM.26 The spectral energy of density (SED) of vibrational modes are obtained by combining the normal modes decomposition and the short-time Fourier transform (STFT), which show that the anharmonic vibrational couplings are related to the symmetries of the normal modes. The AIMD simulation is also appropriate to single molecule. For example, the rapid intramolecular VER processes under low-lying excitation from the ground states in gaseous NM was investigated by the similar method. And three symmetry-dependent coupling mechanisms are concluded: direct symmetric coupling, overtone-assisted coupling and rotation-assisted coupling.27
To date, most of the existing VER studies of NM focus on the response of vibrations after selectively exciting high-frequency CH stretching vibrations. Further studies are required to better understand the vibrational dynamics and vibrational energy transfer efficiency after the selective excitation of low- and middle-frequency vibrational modes. Though these works have been performed in gaseous NM, the dynamical response of vibrational modes in solid NM should be more complicated due to the intermolecular interactions.
In this study, we use ab initio nonequilibrium molecular dynamics to simulate the VER processes in solid NM after the selective excitations of all intramolecular vibrational modes except CH3 torsion. Note that the CH3 torsion vibration (∼60 cm−1) is indistinguishable from the intermolecular vibrations (lattice modes). This method allows us to obtain the dynamic response of every vibrational mode by monitoring the evolution of its kinetic energy. Combined with the analysis of frequency-domain spectrum derived from Fourier transform, the vibrational energy transfer efficiency and the symmetry-dependent coupling mechanisms are discussed.
Computational methods
Complete details of AIMD, normal modes decomposition and drawing of 3D excitation and detected vibrational spectra can be found in our prior work,26 here only a brief description will be given. All the calculations were conducted in Vienna Ab initio Simulation Package (VASP) with PBE functional, PAW potential and Grimme's D3 correction.28–31 The electronic wave functions were expanded by plane wave basis with a kinetic energy cutoff of 800 eV and all atoms were relaxed until atomic forces were less than 0.01 eV Å−1. In the structural optimization, the Brillouin zone is sampled by 6 × 5 × 3 grids and the lattice constants are evaluated as a = 5.178 Å, b = 6.377 Å, and c = 8.524 Å. Then Γ-point in the Brillouin zone was used for both phonon calculation and molecular dynamic simulation. The normal modes, whose eigenvectors are required for normal modes decomposition, were first determined by finite displacement method in phonopy.32 The assignment of the vibrational modes8,33–35 and the corresponding harmonic frequencies are shown in Table 1. Though our calculation overestimate the frequencies of the three CH stretching vibrations, vibrational frequencies calculated in this work are generally in better agreement with the experimental values33 than those in the previous work.35 A 2 × 2 × 1 NM supercell containing 112 atoms was used for the AIMD calculation and VER analysis. All AIMD simulations were performed with a time step of 0.4 fs at 20 K. The momentum of vibrational modes was obtained by projecting the atomic velocities from the MD trajectories and used for the observation of the evolution of the normal modes' kinetic energy. Then the squared modulus of STFT of the momentum for every normal mode was made to calculate the time-dependent SED which can further provide the coupling information between normal modes. For time-dependent SED spectra in this work, the time interval sampled by STFT was set at 1 ps, leading to its spectral resolution of ∼33.3 cm−1. The frequencies taken directly from these spectra were also listed in Table 1 for the direct assignment of vibrations in the following 3D spectrum. Here for each normal mode, five simulations were separately performed from different initial configurations to reduce the impact of inadequate sampling. Finally, 3D excitation and detected vibrational spectrum was merged by normalizing the sum of all vibrational modes' SED spectrum during every time period, which could be directly compared with the 3D IR-Raman measurement. It's important to note that our calculation here ignores the nuclear quantum effect (NQE) which would not have a significant influence on the coupling mechanism and transfer process according to our simulations at 300 K (400 K) for solid (gaseous) NM.26,27| Mode | Assignment | Symmetry | Frequency (cm−1) | |||
|---|---|---|---|---|---|---|
| Exp.33 | PBE-D2 (ref. 35) | PBE-D3 | SEDb | |||
| a In the assignments, the symbol of ν represents stretching, δ represents bending, ρ represents rocking; the subscript of as and s represents antisymmetric and symmetric vibrations respectively.b Anharmonic frequency from SED. | ||||||
| M1 | νas(CH3) | B1 | 3082 | 3127 | 3153 | 3166 |
| M2 | νas(CH3) | B2 | 3050 | 3082 | 3104 | 3100 |
| M3 | νs(CH3) | A1 | 2971 | 2982 | 3005 | 3000 |
| M4 | νas(NO2) | B1 | 1566 | 1475 | 1552 | 1566 |
| M5 | δas(CH3) | B2 | 1430 | 1425 | 1423 | 1433 |
| M6 | δas(CH3) | B1 | 1413 | 1392 | 1400 | 1400 |
| M7 | νs(NO2) | A1 | 1409 | 1364 | 1388 | 1400 |
| M8 | δs(CH3) | A1 | 1377 | 1309 | 1341 | 1333 |
| M9 | ρ(CH3) | B2 | 1122 | 1091 | 1088 | 1100 |
| M10 | ρ(CH3) | B1 | 1107 | 1074 | 1080 | 1066 |
| M11 | ν(CN) | A1 | 923 | 890 | 910 | 900 |
| M12 | δs(NO2) | A1 | 661 | 640 | 650 | 666 |
| M13 | ρ(NO2) | B2 | 609 | 589 | 592 | 600 |
| M14 | ρ(NO2) | B1 | 484 | 471 | 479 | 466 |
For the purpose of visualization and comparison, fourteen vibrational modes were divided into four groups in terms of their frequencies: M1–M3 (2950–3200 cm−1), M4–M8 (1250–1600 cm−1), M9–M11 (850–1150 cm−1), and M12–M14 (400–700 cm−1). In one selective excitation, the four-fold degenerate lattice modes corresponding to one molecular vibration were excited simultaneously. Instead of the treatments for selective excitation in the previous work,26 the positions of all atoms were kept unchanged during the excitation in order to be more consistent with the case of actual optical excitations. According to the Parseval's theorem,36 the integration of one mode's SED in frequency domain equals the integration of its energy in time domain. Thus, we divided the integration of each vibration's SED in every picosecond by the sum of their integrations in the first picosecond to get their energy proportions changing over time, which are used to evaluate the vibrational energy transfer efficiency. All the energy discussed here refers to the vibrational kinetic energy. Some computational details are given in the ESI.†
Results
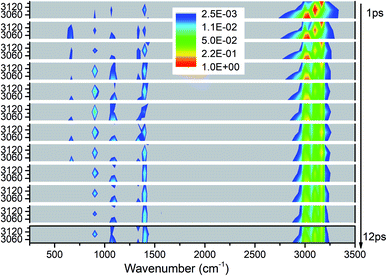
We apply the above methods to draw four 3D excitation and detected vibrational spectra that demonstrate the process of energy redistribution briefly and intuitively. Every 3D spectrum consists of 12 panels and every panel describe the evolution of all vibrations during one time interval of 1 picosecond (ps). For every panel, the x-axis from 250 to 3500 cm−1 represents the wavenumber range for vibrational detection and y-axis indicates the corresponding frequency region for selective excitation. Meanwhile, the vibrational energy transfer efficiencies evaluated by the aforementioned methods for every selective excitation are given for quantitative and explicit analysis. For convenience of discussion, the observed vibrational modes are divided into two groups as the ones whose frequencies are close to that of the parent mode (PM) and the other ones after considering the efficiencies and the VER processes: (1) the ones with close frequencies to the parent mode (PM) usually have higher efficiencies than the others, (2) this classification is helpful to explain the VER processes as shown in 3D excitation and detected vibrational spectrum.Selective excitation of M1–M3 between 2950–3200 cm−1
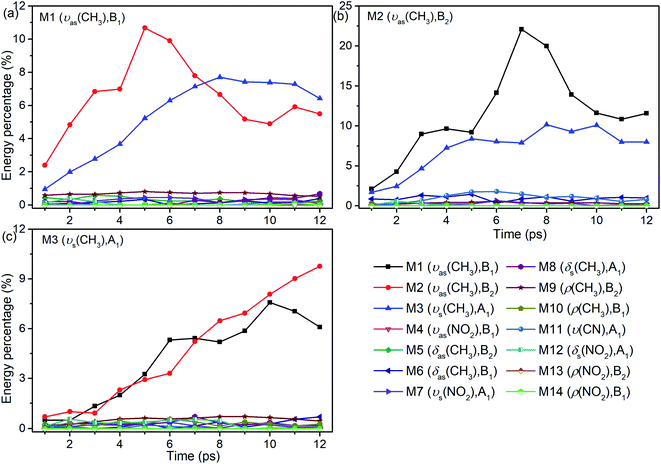
As seen in Fig. 1, the appearance of other vibrations except these selective excited PMs of M1–M3 (CH3 stretching vibrations) indicates the existence of VER between different vibrational modes. In each panel, different vibrational modes are excited by different PM. For example, in the first 1 ps, the vibrational modes (M5–M8) with frequency of 1400 cm−1 appear under the excitation of M2, but they can not be found under the excitation of M1 and M3. From the temporal perspective, the intensities of these excited parent modes (M1–M3) decrease promptly, but the energies of other vibrational modes excited by the PM evolve differently. For example, the intensity of the vibrational mode M11 (ν(CN)) at 900 cm−1 increases till 5–6 ps then decreases gradually, while the intensities of the vibrational modes M5–M8 at near 1400 cm−1 keep increasing slowly during the whole simulation period. Moreover, vibration of M12 (δs(NO2)) at 633 cm−1 mainly appears under the excitation of M3 and disappears at 8 ps. And the vibrational modes (M9–M10) at 1000 cm−1 appear at the beginning but their intensities remain weak. The general evolutionary trends are consistent with those in our previous work26 and are also in qualitative agreement with the experimental results by Dlott's group.16Although 3D excitation and detected vibrational spectrum shown in Fig. 1 provides us with an intuitive and overall description for the VER processes, there is still a lack of quantitative description for them. And it can be achieved by the evolution of their vibrational energy percentage. Fig. 2 depicts the evolution of vibrational energy percentage for the other vibrations except the PMs after exciting M1–M3 respectively. Note that the evolution for the excited PM itself is listed separately in Fig. S2† because its energy percentage is much larger than these of the other modes.
Fig. 2 shows that the vibrational energy transfers between the PM and the other two CH3 stretching modes are always so prominent, indicating that there are strong couplings among the three CH3 stretching vibrations. In particular, the energy redistribution between the two antisymmetric CH3 stretching modes (M1 and M2) is even more remarkable, which is reflected by their significant peaks at 5 ps (M1 to M2) and 7 ps (M2 to M1) respectively. In addition, it is worth noting that the y-axis scale of Fig. 2(b) is larger than those of Fig. 2(a) and (c), which means that the energy loss of the PM M2 is greater than the other two cases.
For the other modes (M4–M14), however, the energy percentage of each vibrational mode is always less than 2% during the simulations and its evolution over time is also different. For example, after the selective excitation of M1 in Fig. 2(a), the CH3 rocking mode M9 obtains more energy than the other lower-frequency modes; the CH3 asymmetric bending mode M5 appears promptly and then its energy quickly declines. Daughter modes M6–M8 (δ(CH3) and νs(NO2)) appear after that. For the excitation of M2 in Fig. 2(b), the CH3 asymmetric bending mode M6 is excited promptly and then its vibrational energy fluctuates slightly, while the vibrational intensity of the CN stretching mode M11 increases gradually until 6 ps and then decreases. When M3 is selectively excited (Fig. 2(c)), a small amount of energy is transferred to M8–M10 (δs(CH3) and ρ(CH3)) and M12 (δs(NO2)); M6 (δas(CH3)) appears after 9 ps.
In short, for the selective excitation of M1–M3, most of the vibrational energy transferred from the PM is to the other two modes except the PM. Secondly, there is a relatively considerable amount of vibrational energy flowing into the daughter modes (DMs) (M5–M8) at ∼1400 cm−1. And at the same time, a small amount of vibrational energy flows into the modes M9–M14 with the lower frequency. The amount of vibrational energy transferred out depends on which of the PMs is selectively excited.
Selective excitation of M4–M8 between 1250–1600 cm−1
Fig. 3 exhibits the 3D excitation and detected vibrational spectrum after selectively exciting M4–M8. From the horizontal point of view, the vibrational energy also transfers undoubtedly to the vibrations outside the selective excitation region. And it is also exciting to observe the prompt and transient emergence of vibrations in the frequency region between 2500 and 3000 cm−1. This suggests the excitation of the PM′ overtone, especially the mode at ∼2600 cm−1 corresponding exactly to the overtone of M8. From the temporal perspective, we can see that the CH3 stretching modes (M1–M3) above 3000 cm−1 are excited promptly after the selective excitation. Then the other vibrational modes are excited successively: M9 and M10 at the frequencies near 1100 cm−1 from 2 ps, M11 at 900 cm−1 and M12–M13 at ∼600 cm−1 from 3 ps, M14 at 466 cm−1 from 10 ps. Moreover, the overtones of the PMs disappear after 2 ps which indicates that the lifetimes of the PMs' overtones are very short. Finally, the PMs M6 and M7 at 1400 cm−1 seem to have longer relaxation times than the other three PMs and it also can be reflected by the evolution of their vibrational energy shown in Fig. S2.†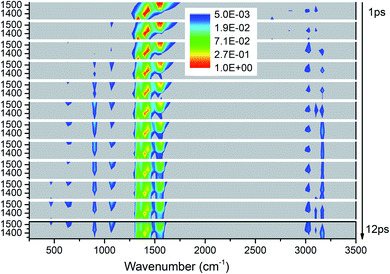 | ||
| Fig. 3 3D excitation and detected vibrational spectrum in solid NM for the selective excitations of M4–M8. | ||
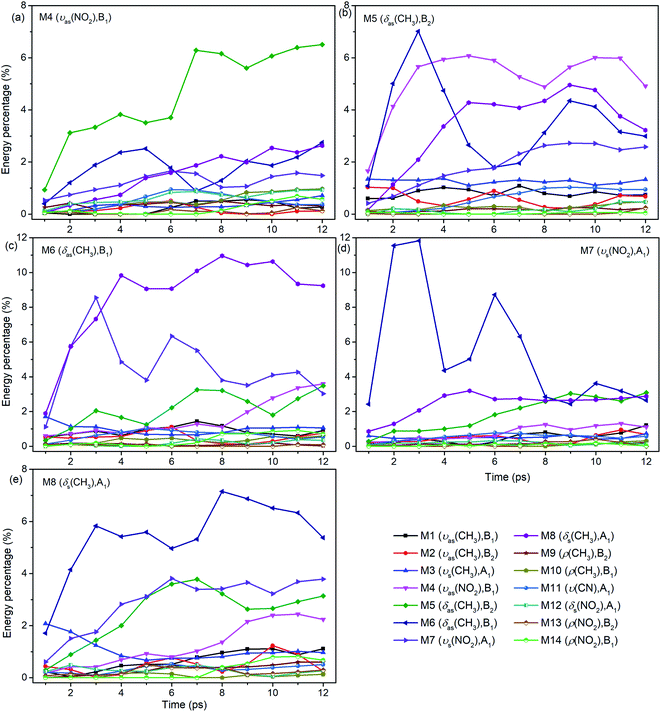
For the excitation of any mode among M4–M8, the vibrational energy transfers to the other four modes in abundance, meaning that there are strong couplings between these neighboring vibrational modes (Fig. 4). Therein, the maximum vibrational energy is transferred to M5 (δas(CH3)) for the PM M4 (νas(NO2)), M4 (νas(NO2)) and M6 (δas(CH3)) for the PM M5 (δas(CH3)), M8 (δs(CH3)) and M7 (νs(NO2)) for the PM M6 (δas(CH3)), and M6 (δas(CH3)) for the PMs M7 (νs(NO2)) and M8 (δs(CH3)). It is interesting that the evolution of the vibrational energy transferred from A to B usually has a similar trend with its inverse process from B to A due to the strong coupling between these modes. For example, the vibrational energy transfer from M4 (νas(NO2)) to M5 (δas(CH3)) and from M5 (δas(CH3)) to M4 (νas(NO2)) both have the stable tendency of rising, resembling the case between M6 (δas(CH3)) and M8 (δs(CH3)). The vibrational energy of M6 (M7) for the PM M7 (M6) reaches a maximum in the first 3 ps, then falls and rises again to a peak at 6 ps. The oscillation corresponds to the beat of the difference frequency between these two modes. This phenomena has also been observed in the vibrational energy transfer among M1–M3 in Fig. 2.
In addition to the vibrational energy transfer among M4–M8, there are also other modes excited by the PMs. Specifically, for the excitation of M4 (Fig. 4(a)), vibrational energies of M11 (ν(CN)) and M12 (δs(NO2)) gradually increase until 6 ps then decrease gently. After M5 is excited (Fig. 4(b)), the vibrational energy transfers to M1–M3 (ν(CH3)) are rather prominent, especially to M3 (νs(CH3)). And the vibrational energy of M11 (ν(CN)) increases slowly after 4 ps. After the excitation of M6 (Fig. 4(c)), vibrational energies of M1–M3 (ν(CH3)) increase significantly since the very beginning and then fluctuate within a small range, while that of M11 (ν(CN)) increases slowly until 5 ps before the gradual diminish. For the PM M7 (Fig. 4(d)), the vibrational energy of M11 (ν(CN)) increases gradually until 6 ps then decreases slowly. For the excitation of M8 (Fig. 4(e)), M3 (νs(CH3)) is excited promptly in the first 1 ps, and then disappears gradually together with the slow increase of the vibrational energy of M1 (νas(CH3)).
In view of the 3D excitation and detected vibrational spectrum, after the selective excitation of M5–M8 near 1400 cm−1, M1–M3 above 3000 cm−1 could always be excited, especially M3 usually from the beginning. And the PM M4 (νas(NO2)) at 1566 cm−1 also excites some other lower-frequency vibrational modes besides M11 (ν(CN)), such as M12 (δs(NO2)) at 650 cm−1. In addition, the vibrational energy of the DM M11(ν(CN)) at 910 cm−1 usually increases slowly and stably for the PMs M4–M8.
Selective excitation of M9–M11 between 850–1150 cm−1
As shown in Fig. 5, the excitations of the DMs in the whole frequency range reconfirm VET from PM between 850–1150 cm−1. The modes at 2200 cm−1 represent the overtones of CH3 rocking modes (M9 and M10) which quickly disappear after 2 ps. As to the time evolution of the energy of daughter modes, the modes near the parent modes at 600 cm−1 (M12) and 1400 cm−1 (M5–M8) are excited firstly at 2 ps, then the DMs of the high frequency CH3 stretching vibrations (M1–M3) arise from 3 ps, and finally vibrations at 466 cm−1 (M14) and 1500 cm−1 (M4) are excited after 7 ps. Looking at the whole-time spectrum, the vibrational energies of these PMs M9–M11 decay relatively slowly which are also reflected in Fig. S2.†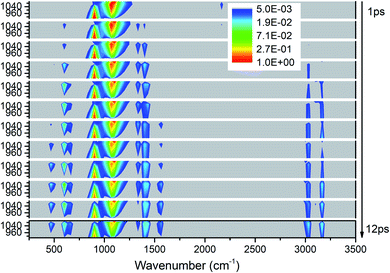 | ||
| Fig. 5 3D excitation and detected vibrational spectrum in solid NM for the selective excitations of M9–M11. | ||
Firstly, Fig. 6 shows the inapparent VET among the adjacent vibrational modes M9–M11 suggesting that only weak coupling exists among them although their frequencies are quite close. Among them, the vibrational energy of the PM M9 (ρ(CH3)) transfers slowly to M10 (ρ(CH3)) after 4 ps. Correspondingly, the VET from the PM M10 (ρ(CH3)) to M9 (ρ(CH3)) is also slow but more obvious. The energy transfer from M10 (ρ(CH3)) to M11 (ν(CN)) starts at 4 ps, later than that from M9 (ρ(CH3)) to M11 (ν(CN)) at 2 ps. For the PM M11 (ν(CN)), only a little amount of vibrational energy is transferred to M10 (ρ(CH3)), and almost no vibrational energy flows into M9 (ρ(CH3)).
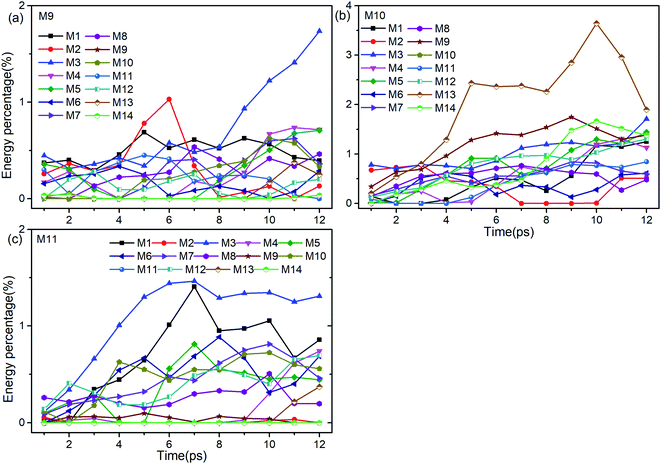 | ||
| Fig. 6 Energy percentage change of the other vibrations after selectively exciting M9–M11 ((a)–(c)). | ||
After the excitation of M9 (Fig. 6(a)), vibrational energies of M1–M3 (ν(CH3)) increase relatively prominently. Among them, the vibrational energy of M1 (νas(CH3)) changes gently, that of M2 (νas(CH3)) increases before 6 ps and then drops sharply till 8 ps, while that of M3 (νs(CH3)) increases significantly after 8 ps. When M10 is selectively excited (Fig. 6(b)), the VETs to lower-frequency vibrations of M12–M14 (δs(NO2) and ρ(NO2)) are slow but obvious, especially to M13 (ρ(NO2)). The vibrational energy of M3 (νs(CH3)) varies smoothly, that of M2 (νas(CH3)) vanishes between 7–10 ps and that of M1 (νas(CH3)) rises slowly after 4 ps. For the excitation of M11 (Fig. 6(c)), the energy percentages of M1 (νas(CH3)) and M3 (νs(CH3)) increase prominently until 7 ps, and then drop slowly with a little fluctuation. The vibrational energies of M5 (δas(CH3)) and M6 (δas(CH3)) reach their maximum at 7 ps and 8 ps respectively after some undulations. For the DMs M7 (νs(NO2)) and M8 (δs(CH3)), their vibrational energies increase smoothly from the beginning till 10 ps and then go down.
To sum up, only a small amount of the vibrational energies for the PMs M9–M11 are transferred out. The most apparent transfer is the one from M10 at 1100 cm−1 to M13 at 600 cm−1, whose efficiency approaches 4%. Additionally, vibrations of M5–M8 (∼1400 cm−1) and M1–M3 (>3000 cm−1) gain larger proportion of energy during the whole process, especially M1 and M3.
Selective excitation of M12–M14 between 400–700 cm−1
As shown in Fig. 7, the vibrational energies are transferred from these lower-wavenumber PMs to all the higher-wavenumber vibrations. Looking horizontally, VETs to the DMs near 1400 cm−1 (M5–M8) and 3000 cm−1 (M1–M3) are rather significant. From the view of time evolution, we can see that the DM M8 at 1333 cm−1 is excited by the PM M12 at 633 cm−1 since the very beginning. The DMs M9 and M10 at 1100 cm−1 and M4 at 1566 cm−1 appear from 2 ps, and the DM M11 at 900 cm−1 and M1–M3 above 3000 cm−1 arise after 3 ps.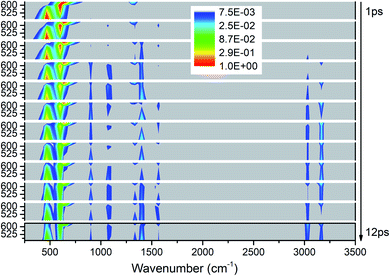 | ||
| Fig. 7 3D excitation and detected vibrational spectrum in solid NM for the selective excitations of M12–M14. | ||
The energy evolutions of the PMs M12–M14 in Fig. 8 show that the significant VETs among them are revealed by their high energy percentage firstly. When M12 (δs(NO2)) or M14 (ρ(NO2)) is selectively excited, the vibrational energy transferred primarily to M13 (ρ(NO2)) is the most. As for the excitation of M13 (ρ(NO2)), a great deal of vibrational energy flows into M14 (ρ(NO2)) and some is also transferred to M12 (δs(NO2)).
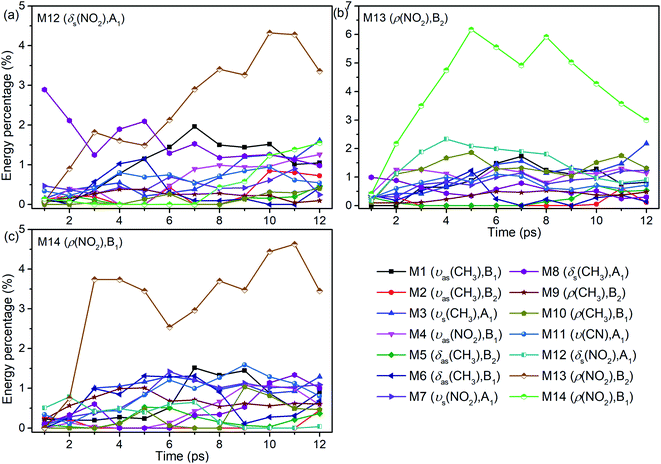 | ||
| Fig. 8 Energy percentage change of the other vibrations after selectively exciting M12–M14 ((a)–(c)). | ||
For the excitation of M12 (Fig. 8(a)), M8 (δs(CH3)) is excited promptly, following by the gradual diminish of its energy percentage. The vibrational energy of M6 (δas(CH3)) undergoes a rise and fall from 2 to 8 ps, and that of M1 (νas(CH3)) increases from 2 to 7 ps and then decreases slowly. When M13 is excited (Fig. 8(b)), plenty of energy is transferred to M10 (ρ(CH3)) which is the inverse process of VET from M10 to M13 (Fig. 6(b)). The vibrational energies of M1 (νas(CH3)) and M3 (νs(CH3)) gradually increase until 7 ps then fluctuate within a small range, that of M8 (δs(CH3)) decreases slightly since the beginning, and that of M4 (νas(NO2)) begins decreasing from 2 ps. As M14 is excited (Fig. 8(c)), the vibrational energies of M3 (νs(CH3)) and M1 (νas(CH3)) increase from 2 ps and 5 ps respectively. And that of M11 (ν(CN)) increases gently until 9 ps and then gradually diminishes. Besides, VETs to M6 (δas(CH3)), M7 (νs(NO2)) and M8 (δs(CH3)) start from 2, 4 and 6 ps, respectively.
Overall, the vibrational energies of all the three PMs transfer steadily to the higher-wavenumber DMs. Therein, the proportions of vibrational energy transferred to the DMs M6–M8 near 1400 cm−1 and M1 and M3 above 3000 cm−1 are higher than to the other DMs.
In summary, it could be concluded from the above four 3D excitation and detected vibrational spectra that the DMs M5–M7 near 1400 cm−1, and M1–M3 above 3000 cm−1 are usually excited in the early stage and obtain more vibrational energy from the PMs in the whole process, while M4 (νas(NO2)) at 1533 cm−1 and M14 (ρ(NO2)) at 466 cm−1 get a small amount of vibrational energy even at a later stage. Though M11 (ν(CN)) at 900 cm−1 can not response immediately after the selective excitations, it always accumulates the vibrational energy slowly and steadily. M9 (ρ(CH3)) and M10 (ρ(CH3)) at 1100 cm−1 are excited quickly by the PMs, however, their energy percentages are always low. From the perspective of the PMs, the vibrational energy of M9–M11 (ρ(CH3) and ν(CN)) near 1000 cm−1 decay more slowly than those of the others due to the absence of large amounts of VETs among the adjacent vibrations, which also means that these modes have longer vibrational lifetimes. The 3D spectra and the evolution diagrams of the vibrational energy show the VET in solid NM is quite complicated due to the diversity of vibrations and complex interactions. Thus, the coupling mechanisms underlying the VER processes are tend to be discussed in the next section.
Discussion
According to our previous work,26,27 anharmonic couplings in nitromethane, which dominate these VER processes, are strongly associated with the vibrational symmetry. Hence the coupling mechanisms especially the role of symmetry-dependent couplings in the VER processes were mainly discussed as below.The energy redistribution processes within 1 ps after excitation especially the prompt and prominent responses are analyzed firstly, since these modes can be identified directly as the daughter modes of the parent mode, so as to avoid the difficulty of distinguishing these couplings from the complicated multistep transfer processes. Typically, Fig. 9 shows the evolution of the kinetic energy of the DMs in the first 1 ps after exciting the PMs M6 and M11. The kinetic energy changes of the DMs for the excitation of the PMs M1–M14 are also shown in Fig. S3 and S4.† Those daughter modes whose energy rise rapidly and prominently are depicted with solid lines as the ones excited directly by the PMs. They are M2 (νas(CH3), B2), M3 (νs(CH3), A1), M7 (νs(NO2), A1) and M8 (δs(CH3), A1) for the PM M6 (δas(CH3), B1); M8 (δs(CH3), A1) and M10 (ρ(CH3), B1) for the PM M11 (ν(CN), A1), respectively.
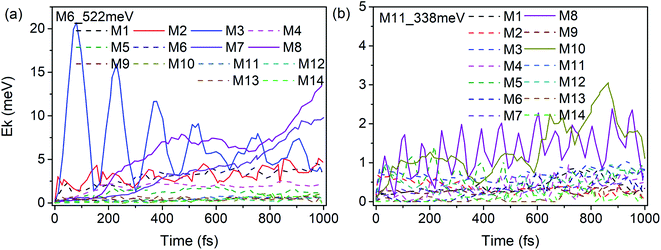 | ||
| Fig. 9 Time history of the kinetic energy of the DMs in the first 1 ps after exciting M6 (a) and M11 (b). | ||
The previous research of IVR in a single NM molecule27 suggests that a mode with B1 symmetry could couple with modes with B2 symmetry with the assistance of rotations (including CH3 torsion), and couple with those with A1 symmetry through its overtone which also has A1 symmetry. And these mechanisms can be applied to solid NM. For example for the PM M6 (δas(CH3), B1) in Fig. 9(a), the SED spectra of its DMs M2 (νas(CH3), B2) and M3 (νs(CH3), A1) are given in Fig. 10(a) and (b) to discuss the coupling mechanisms. In Fig. 10(a), there are two obvious satellite peaks around the wavenumber of M6 at 1400 ± 66 cm−1, which suggests the possible role of low-frequency vibrations including CH3 internal rotation in the coupling between M2 and M6. Fig. 10(b) shows that an obvious peak of M6's overtone appears therein. Meanwhile, the oscillation of the vibrational energy of M3 in Fig. 9(a) with a period near 160 fs comes right from the beat of the difference frequency (200 cm−1) between M3 and the overtone of M6. They both indicate that the coupling between M3 and M6 occurs through M6's overtone. Some components of 2M6 occur in the M2′ SED spectrum of Fig. 10(a) too. This relaxation of symmetry constraint possibly derive from the symmetry breaking brought by the complex intermolecular interactions.
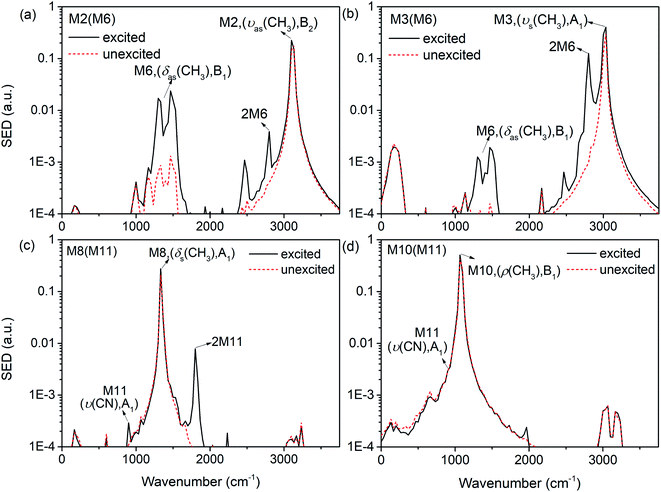 | ||
| Fig. 10 SED spectrum of M2 (a) and M3 (b) under the excitation of M6; SED spectrum of M8 (c) and M10 (d) under the excitation of M10. | ||
The symmetry-dependent coupling rules also suggest that a PM of A1 symmetry couples with the modes of A1 symmetry through both direct coupling and the assistance of its overtone. For the PM M11 (ν(CN), A1) in Fig. 9(b), the SED spectrum of its DMs M8 (δs(CH3), A1) is shown in Fig. 10(c) where a considerable amount of M11's overtone exists. The difference frequency between M8 and 2M11 is at 460 cm−1 which corresponds to the oscillational period of M8's vibrational energy near 74 fs. Under simulated excitation condition, the efficiency of frequency doubling for many PMs are considerable,27 which can be used to explain the immediate excitations of overtone components in 3D spectra, as well as the prompt appearance of the DMs of A1 symmetry such as M3 (νs(CH3), A1) after selectively exciting M8 (δs(CH3), A1) in Fig. 3 and M8 (δs(CH3), A1) for the selective excitation of M12 (δs(NO2), A1) in Fig. 7. These couplings are consistent with the symmetry-dependent couplings channels concluded in single molecule.
Besides the mechanisms above, there is another case for the vibrational energy to transfer from M11 (ν(CN), A1) to M10 (ρ(CH3), B1) in Fig. 9(b). From the SED spectra of M10 (ρ(CH3), B1) under the excitation of M11 (ν(CN), A1) shown in Fig. 10(d), it can be seen that there is no apparent coupling component and the VET seems to comes from the spectral overlap.
For all the vibrations (Fig. S3 and S4†), the symmetry-dependent mechanisms are generally appliable in solid NM (Fig. S5†). Moreover, there are VETs between the adjacent vibrations such as those from M2 to M3 (ν(CH3)) and M5 to M6 (δas(CH3)), while it's difficult to distinguish them in both 3D spectra and SED spectra owing to their spectral overlap.
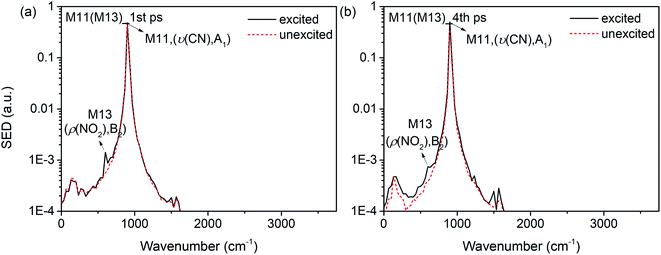
Interestingly, it is found that the VET of CN stretch (M11) is unique compared with these of other vibrations. Fig. 8(b) shows the vibrational energy of M11 increases stably from 1 ps to 4 ps under the excitation of M13, and Fig. 11 exhibits the SED spectra of M11 in the first (a) and forth (b) picosecond after exciting M13. The former suggests that M11 barely couples directly with the PM M13, and the latter indicates that no other vibrations couple with M11 in the later transfer process. This steady accumulation of vibrational energy for M11 is a common phenomenon after exciting many PMs (see Fig. 2, 4 and 8), and it's consistent with our previous investigations which point out that there is little anharmonic couplings between M11 and other modes. Additionally, it is found that the VET between M11 and its adjacent modes M9/M10 is inefficient, too. The ability of accumulating energy for M11 can be attributed to the special position of CN bond which is the linkage of methyl and nitro group. As a bridge of various VER processes, energy flows slowly into CN bond, more than those coming out and giving rise to the gradual accumulation of vibrational energy. This can be the reason why the CN cleavage in solid NM initializes the chemical reaction.37
Conclusion
In this work we have carried out ab initio non-equilibrium molecular dynamics to study vibrational energy redistribution in crystalline nitromethane under 20 K. 3D excitation and detected vibrational spectra after exciting all the molecular vibrations except CH3 torsion at 56 cm−1 were systematically simulated and compared with the previous 3D infrared-Raman spectroscopic measurements.16 What's more, the specific VER pathways were characterized based on the analysis of the daughter modes' responses in both time and frequency domain. The underlying coupling mechanisms of VER were mainly discussed and found to be related to the symmetry of vibrations. The results indicate the anharmonic couplings between the parent mode and daughter modes could be realized by the assist of the rotations and overtones. What's more, the VET could occur between the adjacent modes, such as M2 (νas(CH3), B2) and M3 (νs(CH3), A1), M5 (δas(CH3), B2) and M6 (δas(CH3), B1). While their spectra overlap so much that they are undistinguishable in both 3D spectra and SED spectra. It's also interesting that the vibrational energy of CN stretch accumulates slowly owing to its role as a bridge between methyl and nitro group. It may lead to the breakage of CN bond and cause the initial reaction of the decomposition of nitromethane. These observations open up new opportunities to understand the localization of vibrational energy and the initial reactive bond for energetic materials.Conflicts of interest
There are no conflicts to declare.Acknowledgements
This study was supported by the National Natural Science Foundation of China (Grant Numbers 11702274 and 21673211), the Science Challenging Program (Grant Number TZ2016001), and the Foundation of National Key Laboratory of Shock Wave and Detonation Physics of China (Grant Number 6142A03192012 and 6142A03192014).References
- A. Tokmakoff, M. D. Fayer and D. D. Dlott, J. Phys. Chem., 1993, 97, 1901–1913 CrossRef CAS.
- S. J. Ye and M. Koshi, J. Phys. Chem. B, 2006, 110, 18515–18520 CrossRef CAS PubMed.
- S. McGrane, P. Bowlan, M. Powell, K. Brown and C. Bolme, AIP Conf. Proc., 2018, 1979, 130004 CrossRef.
- D. B. Moss, K. A. Trentelman and P. L. Houston, J. Chem. Phys., 1992, 96, 237 CrossRef CAS.
- N. C. C. Filipiak, R. Knepper, M. Wood and K. Ramasesha, J. Phys. Chem. Lett., 2020, 11, 6664–6669 CrossRef PubMed.
- J. R. Hill, D. S. Moore, S. C. Schmidt and C. B. Storm, J. Phys. Chem., 1991, 95, 3037 CrossRef CAS.
- D. Cavagnat and L. Lespade, J. Chem. Phys., 1997, 106, 7946 CrossRef CAS.
- S. Courtecuisse, F. Cansell, D. Fabre and J. P. Petitet, J. Chem. Phys., 1998, 108, 7350 CrossRef CAS.
- M. Halonen, L. Halonen, A. Callegari and K. K. Lehmann, J. Phys. Chem. A, 1998, 102, 9124–9128 CrossRef CAS.
- R. Ouillon, J. P. Pinan-Lucarre, B. Canny, P. Pruzan and P. Ranson, J. Raman Spectrosc., 2008, 39, 354–362 CrossRef CAS.
- C. L. Adams, H. Schneider and J. M. Weber, J. Phys. Chem. A, 2010, 114, 4017–4030 CrossRef CAS PubMed.
- M. G. Giorgini, L. Mariani, A. Morresi, G. Paliani and R. S. Cataliotti, Mol. Phys., 1992, 75, 1089–1097 CrossRef CAS.
- G. I. Pangilinan and Y. M. Gupta, J. Phys. Chem., 1994, 98, 4522–4529 CrossRef CAS.
- J. C. Deak, L. K. Iwaki and D. D. Dlott, J. Phys. Chem. A, 1999, 103, 971 CrossRef CAS.
- S. Shigeto, Y. Pang, Y. Fang and D. D. Dlott, J. Phys. Chem. B, 2008, 112, 232–241 CrossRef CAS PubMed.
- Y. X. Sun, B. C. Pein and D. D. Dlott, J. Phys. Chem. B, 2013, 117, 15444–15451 CrossRef CAS PubMed.
- V. N. Kabadi and B. M. Rice, J. Phys. Chem. A, 2004, 108, 532–540 CrossRef CAS.
- J. Hooper, J. Chem. Phys., 2010, 132, 014507 CrossRef PubMed.
- M. R. Manaa, E. J. Reed, L. E. Fried, G. Galli and F. Gygi, J. Chem. Phys., 2004, 120, 10146 CrossRef PubMed.
- R. Dawes, A. S. Haghighi, T. D. Sewell and D. L. Thompson, J. Chem. Phys., 2009, 131, 224513 CrossRef PubMed.
- M. M. Islam and A. Strachan, J. Phys. Chem. C, 2019, 123, 2613–2626 CrossRef CAS.
- J. R. Hill, E. L. Chronister, T. C. Chang, H. Kim, J. C. Postlewaite and D. D. Dlott, J. Chem. Phys., 1988, 88, 949 CrossRef CAS.
- S. F. Trevino and W. H. Rymes, J. Chem. Phys., 1980, 73, 3001 CrossRef CAS.
- D. Cavagnat, J. Lascombe, J. C. Lassegues, A. J. Horsewill, A. Heidemann and J. B. Suck, J. Phys., 1984, 45, 97–105 CrossRef CAS.
- M. E. Tuckerman and M. L. Klein, Chem. Phys. Lett., 1998, 283, 147–151 CrossRef CAS.
- M. L. Lu, Z. Y. Zheng, G. B. Zhu, G. Y. Yu, Y. F. Song and Y. Q. Yang, Phys. Chem. Chem. Phys., 2019, 21, 20822 RSC.
- M. L. Lu, Z. Y. Zheng, G. B. Zhu, Y. X. Wang and Y. Q. Yang, J. Phys. Chem. A, 2020, 124, 8184–8191 CrossRef CAS PubMed.
- J. P. Perdew, K. Burke and M. Ernzerhof, Phys. Rev. Lett., 1996, 77, 3865–3868 CrossRef CAS PubMed.
- P. E. Blöchl, Phys. Rev. B: Condens. Matter Mater. Phys., 1994, 50, 17953–17979 CrossRef PubMed.
- G. Kresse and J. Furthmüller, Phys. Rev. B: Condens. Matter Mater. Phys., 1996, 54, 11169–11186 CrossRef CAS PubMed.
- S. Grimme, J. Antony, S. Ehrlich and H. Krieg, J. Chem. Phys., 2010, 132, 154104 CrossRef PubMed.
- A. Togo and I. Tanaka, First principles phonon calculations in materials science, Scr. Mater., 2018, 108, 1–5 CrossRef.
- R. Ouillon, J. P. Pinan-Lucarré, P. Ranson and G. Baranovic, J. Chem. Phys., 2002, 116, 4611 CrossRef CAS.
- H. Liu, J. J. Zhao, D. Q. Wei and Z. Z. Gong, J. Chem. Phys., 2006, 124, 124501 CrossRef PubMed.
- S. Appalakondaiah, G. Vaitheeswaran and S. Lebègue, J. Chem. Phys., 2013, 138, 184705 CrossRef CAS PubMed.
- J. A. Thomas, J. E. Turney, R. M. Iutzi, C. H. Amon and A. J. H. McGaughey, Phys. Rev. B: Condens. Matter Mater. Phys., 2010, 81, 081411(R) CrossRef.
- J. Chang, P. Lian, D. Q. Wei, X. R. Chen, Q. M. Zhang and Z. Z. Gong, Phys. Rev. Lett., 2010, 105, 188302 CrossRef PubMed.
Footnote |
| † Electronic supplementary information (ESI) available. See DOI: 10.1039/d0ra10776j |
| This journal is © The Royal Society of Chemistry 2021 |

