 Open Access Article
One-step synthesis of fluorescent graphene quantum dots as an effective fluorescence probe for vanillin detection
Sujuan
Zhu
 *ab,
Xuexue
Bai
a,
Ting
Wang
a,
Qiang
Shi
a,
Jing
Zhu
a and
Bing
Wang
*c
aCollege of Bioscience and Biotechnology, Yangzhou University, Yangzhou, Jiangsu 225009, P. R. China. E-mail: sjzhu@yzu.edu.cn
bJoint International Research Laboratory of Agriculture and Agri-Product Safety, The Ministry of Education of China, Yangzhou University, Yangzhou, Jiangsu 225009, China
cCenter for Disease Control and Prevention, Yangzhou, Jiangsu 225009, P. R. China. E-mail: 376610964@qq.com
First published on 1st March 2021
Abstract
This study proposes an easy bottom-up method for the synthesis of photoluminescent (PL) graphene quantum dots (GQDs) using citric acid as the carbon source. The obtained GQDs were characterized by high-resolution transmission electron microscopy (HRTEM), UV-vis absorption spectroscopy, fluorescence spectroscopy, and Fourier transform infrared spectroscopy (FT-IR). The synthesised GQDs have an average diameter of 4.76 ± 0.96 nm, with a lattice spacing of 0.24 nm. The GQDs exhibit excitation-independent PL emission. The surface of the GQDs has a variety of functional groups (hydroxyl, carboxyl, and ether groups etc.) to enhance its stability and water solubility. In this study, a fluorescent “on–off” sensor is developed for the selective detection of vanillin in chocolates using GQDs as a fluorescent probe. Under optimal conditions, fluorescence intensity of the GQDs has a good linear relationship with the vanillin concentration (0.0–2.1 × 10⁻⁵ mol L−1), with a limit of detection of 2.5 × 10⁻⁸ mol L−1. For detection in real samples, the percent recovery of vanillin and the relative standard deviation were 88.0–108.9% and 0.90–5.4%, respectively. Thus, this GQDs-based method has good accuracy and precision and can be used for vanillin detection in practical applications.
Introduction
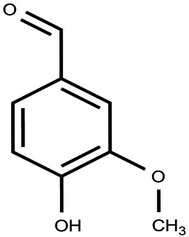
Graphene quantum dots (GQDs) are a zero-dimensional and photoluminescent carbon-based nanomaterial consisting of very thin (typically 3–20 nm) graphene sheets.1,2 GQDs are a new member of the graphene family and have attracted tremendous research interest.3 In addition, the quantum confinement effect and the edge (armchair or zigzag) effect impart GQDs with special properties such as low toxicity, high biocompatibility, high fluorescent activity, robust chemical inertness, and excellent photostability.4–6 Owing to these properties, GQDs have immense potential applications in photovoltaic devices,7 bioimaging instruments,8 sensors and biosensors,9,10etc. Until now, GQDs have been used as a fluorescent probe for the detection of a broad range of analytes such as metal ions,11–15 organic matter,16,17 proteins,18 and other biomolecules.19,20Vanillin (Fig. 1) is the major component of natural vanilla and one of the most widely used flavouring materials worldwide.21 Due to its unique aromatic properties, it is widely used as a flavour enhancer in candies, ice creams, wine, and other food products and is also used as an aromatic additive in candles, incense, potpourri, fragrances, perfumes, and air fresheners.22,23 In addition, vanillin exhibits probiotic activities such as antibacterial24 and antioxidant activities.25 However, excessive ingestion of vanillin can cause headache, nausea, and vomiting and can affect the liver and kidney functioning.26 Therefore, it is essential to manage its usage in the products. Various analytical methods have been developed for vanillin detection; these include UV-vis spectrophotometry,27 electrochemical methods,28,29 high-performance liquid chromatography,30 and gas chromatography-mass spectrometry.31,32 However, most of these methods are complex and time consuming and require expensive instruments and complex operational procedures. Moreover, some of these methods have low sensitivity, thereby limiting their practical applications for routine analysis.33 Thus, in the present work, GQDs were prepared as a novel carbon material using the one-pot bottom-up high temperature-pyrolysis method by employing citric acid as the carbon source. Using these GQDs, a new, low-cost, convenient, highly efficient, rapid, sensitive, and selective method allowing on-site operation was developed for vanillin detection.
Experimental
Materials
Citric acid, NaOH, vanillin, D-(−)-salicin and glutathione were purchased from Sangon Biotech (Shanghai, China) Co., Ltd. Glucose and glycine were obtained from Sinopharm Group Chemical Reagent Co., Ltd (Shanghai, China). Sucrose was purchased from Shanghai Chemical Reagents Co., Ltd (Shanghai, China). Sodium dihydrogen phosphate dihydrate (NaH2PO4·2H2O), disodium hydrogen phosphate dodecahydrate (Na2HPO4·12H2O) and potassium hydrogen phosphate (K2HPO4·3H2O) were bought from Tianjin Kemeiou Chemical Reagent Co., Ltd (Tianjin, China). Ascorbic acid was obtained from Shanghai Tri-Four Hewei Chemical Co., Ltd (Shanghai, China). Quinine sulfate was obtained from Tianjin Heowns Biochem Co., Ltd (Tianjin, China). All chemicals were of analytical grade and the water was distilled and passed through a Millipore Q purification system (Millipore Corporation).Instrumentation
The GQDs fluorescence spectra were obtained on a Cary Eclipse fluorescence spectrophotometer (Varian Co., USA). The absorption spectra of GQDs measured on the Ultrospec 6300 pro UV-vis spectrophotometer (Amersham Biosciences Co., USA) in a 1 cm quartz cells. A Fourier transform infrared (FT-IR) spectrophotometer (Thermo Scientific Nicolet iS5, USA) was used to collect the Fourier transform infrared spectra of GQDs. The morphology and size of GQDs were collected by transmission electron microscope (TEM) (JEM-2100, Japan), using an acceleration voltage of 200 kV.Synthesis of GQDs
The GQDs were synthesised according to a previously reported method, with some modifications.34 Briefly, 2.0 g of citric acid was taken into a 250 mL three-necked flask and heated at 150 °C using an electric heating mantle for about 12 min, till the colour of the pyrolysis solution changed to orange-red. The orange-red liquid was quickly added dropwise to 30 mL of 10 mg mL−1 NaOH, followed by ultrasonication for 2 min and stirring on a magnetic agitator for 30 min. Finally, pH of the obtained yellow-green GQDs solution was adjusted to 7.0 with NaOH. The GQDs solution was diluted to 100 mL and stored at 4 °C.Measurement of quantum yield
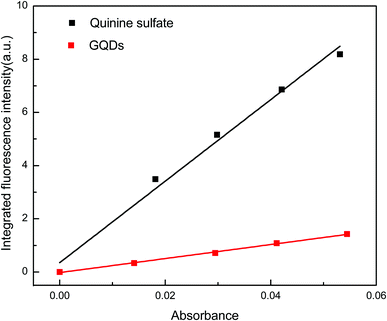
The most reliable method for determining the quantum yield (QY) is the “comparative method”.35 In this method, a series of diluted samples of the standard substances and test substances are prepared so that their UV-vis absorbance at a certain wavelength λ follows a gradient. The fluorescence emission peak upon excitation at λ is examined, and the peak area is integrated. The integrated area is used to linearly fit the absorbance to obtain two straight lines passing through the origin, and the QY is calculated according to eqn (1).| Mx = Ms(kx/ks)(ηx/ηs) | (1) |
Specific steps adopted in this study: quinine sulfate was used as a control to determine the fluorescence QY of the prepared GQDs. The quinine sulfate solution was prepared in 0.1 mol L−1 H2SO4. It was ensured that the absorbances of the quinine sulfate solution and GQDs solutions at a wavelength of 355 nm were less than 0.1. Following this, fluorescence emission spectra of the quinine sulfate solution and carbon point solution were acquired on a fluorescence spectrophotometer, and the respective peak areas were calculated.
Detection of vanillin
A fixed concentration of GQDs (2.0 mg mL−1) was mixed with increasing concentration (ranging from 0.0 to 2.1 × 10⁻⁵ mol L−1) of the vanillin standard solution. PBS (pH = 8.0) was used as the reference solution. The mixture was incubated for ∼10 min at different temperatures so that the equilibrium is attained. The excitation and emission slits were 5 and 10 nm, respectively. Fluorescence spectra were acquired from 400 to 600 nm by exciting the GQDs solutions at 365 nm.Preparation of real samples
Phosphate buffer saline (PBS) with different pH values was prepared by mixing stock solutions of 0.05 mol L−1 Na2HPO4 and NaH2PO4. The standard stock solution of vanillin (4.5 × 10⁻⁵ mol L−1) was prepared in deionised water and stored at 4 °C.To establish the practical application of this method, chocolates purchased from a local supermarket were used as the real sample. Five different varieties of chocolates were accurately weighed (0.50 g) and placed in a beaker. Then, 20 mL of distilled water was added to it, and the beaker was placed in a water bath at 50 °C for 10 min. After cooling to room temperature, the sample was centrifuged at low speed (2000 rpm) for 5 min. The supernatant was withdrawn and filtered using a 0.22 μm micro filter membrane. Finally, the sample was stored at 4 °C for later use.
Results and discussion
Optimisation of synthesis conditions
In order to obtain GQDs with excellent optical properties, we used the controlled variable method to investigate the influence of heating temperature and heating time on the synthesis. The results are depicted in the fluorescence spectra and UV-vis absorption spectra (Fig. 2). The optimal temperature was 150 °C (Fig. 2A and B), while the optimal heating time was 12 min (Fig. 2C and D).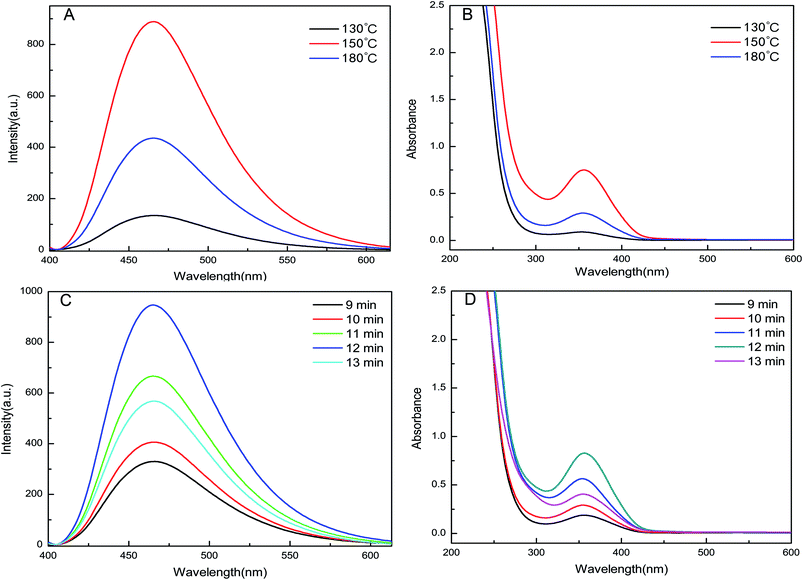 | ||
| Fig. 2 The influence of different reaction temperature and different reaction time on GQDs. Here (A) and (C) are the fluorescence spectroscopy, and the UV-vis absorption spectroscopy are (B) and (D). | ||
Characterisation of GQDs
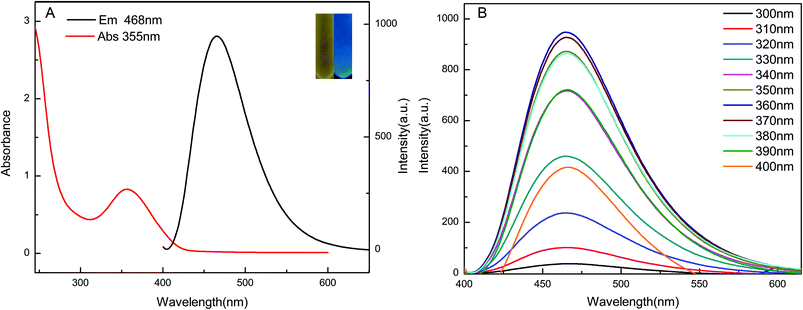
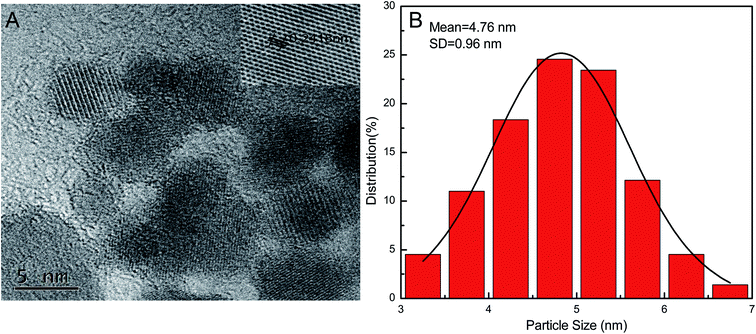
Optical properties of the GQDs were determined from the fluorescence and UV-vis absorption spectra. The prepared GQDs showed a strong absorption peak at ∼355 nm and an emission maximum at ∼468 nm (Fig. 3A). The GQDs solutions were light yellow in day light and exhibited strong, bright blue luminescence upon UV irradiation of 365 nm (inset, Fig. 3A). To further study the optical properties of GQDs, we excited the GQDs solutions at different wavelengths. When the excitation wavelength was increased from 300 to 400 nm, the fluorescence intensity of GQDs first increased and then decreased gradually (Fig. 3B). The fluorescence intensity was the highest at an excitation wavelength of 360 nm. The emission maximum was around 468 nm even when the sample was excited at different wavelengths. This suggested that the GQDs has no emission wavelength dependence.The morphology and size distribution of the GQDs were obtained by high-resolution transmission electron microscopy (HRTEM). The HRTEM image (Fig. 4A) suggests that the GQDs were well dispersed spherical dots with a lattice spacing of ∼0.241 nm (inset of Fig. 4A). This is in agreement with the 1120 plane of graphitic carbon and indicates high crystallinity of the GQDs.36 The GQDs have a uniform size with an average diameter of 4.76 ± 0.96 nm (Fig. 4B).
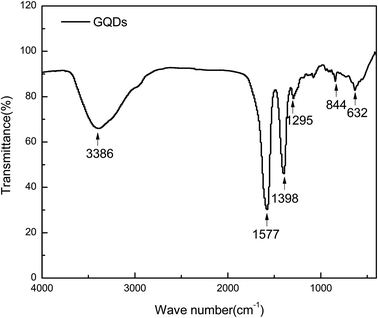
The functional groups of the GQDs were examined by FT-IR spectroscopy (Fig. 5). The broad peak at 3386 cm−1 is ascribed to the –NH and –OH stretching vibrations.33 The strong absorption peaks at 1398 and 1577 cm−1 correspond to the symmetric and anti-symmetric stretching vibrations of –COOH, respectively. The typical peak at 1295 cm−1 is attributed to the anti-symmetric and symmetric stretching vibrations of the aromatic –COC bond. The out-of-plane –OH bending vibration is also detected at 632 cm−1 in the FT-IR spectrum.
Stability of GQDs
Stability of the synthesised GQDs was examined at room temperature. Required amount of the GQDs solution was added to PBS with different pH values (3.0, 4.0, 5.0, 6.0, 7.0, 8.0, 9.0, 10.0, 11.0). The fluorescence intensity of the GQDs in acidic pH was lower than those in neutral and alkaline pH (Fig. 6A). It is evident from Fig. 6B that the fluorescence intensity of the GQDs did not change significantly upon continuous UV irradiation (using UV lamp) for 2 h at 365 nm, indicating that the GQDs had good photostability and anti-bleaching ability. The influence of ionic strength on the fluorescence intensity of GQDs was investigated by adding different concentrations of NaCl solution. Fig. 6C clearly shows that the ionic strength has a minor effect on the fluorescence intensity of GQDs. | ||
| Fig. 6 The influence of different acidity (A), UV lamp irradiation (B) and different ion intensity (C) on GQDs. | ||
Calculation of the fluorescence quantum yield
The QY of the synthesised GQDs was determined using a quinine sulfate solution prepared in 0.1 mol L−1 H2SO4 (QY, 54%) as the fluorescence standard. The results are shown in Fig. 7. Slopes corresponding to quinine sulfate and GQDs are 153.22 and 26.44, respectively, and the calculated fluorescence yield of the GQDs is 9.3%.Optimisation for vanillin detection
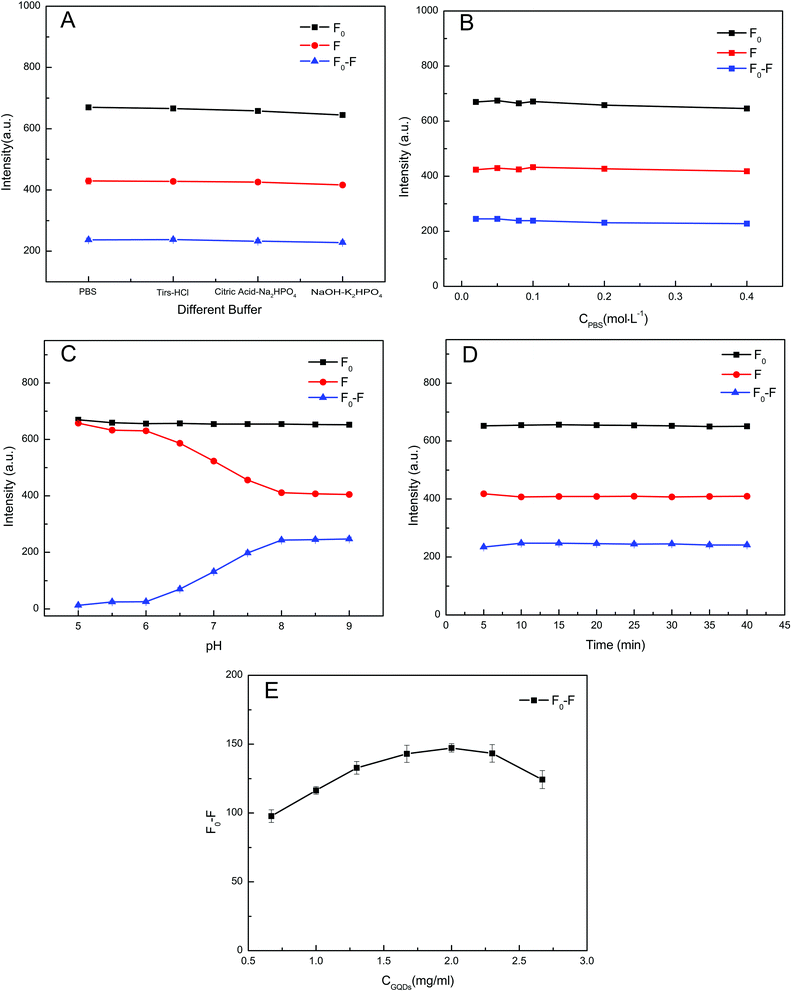
In order to obtain a high quenching efficiency and good sensitivity, several crucial factors, including buffer, concentration of buffer, pH, reaction time, and dosage of GQDs, were investigated. For the optimisation experiment, the concentration of vanillin chosen was 2.0 × 10⁻⁵ mol L−1. The values of (F0 − F) (here, F0 and F are the fluorescence intensities of GQDs before and after adding vanillin, respectively) were obtained to determine the optimal conditions.The degree of quenching of the GQDs fluorescence by vanillin was studied in four different buffers (PBS, Tris–HCl, citric acid–Na2HPO4, NaOH–K2HPO4). The (F0 − F) values in different buffers were almost unchanged, and thus, PBS was selected as the buffer for the reaction system (Fig. 8A). Subsequently, the GQDs were incubated with vanillin at different concentrations of PBS (0.02–0.40 mol L−1) for 10 min. Fig. 8B shows that the concentration of PBS does not affect the detection. Thus, 0.05 mol L−1 PBS was selected for the overall detection system. The effect of pH (5.0–9.0) on the (F0 − F) values was studied (Fig. 8C). It was found that the (F0 − F) value of the system reached its maximum and was stabilised when the pH was 8.0. Hence, the optimal pH of the PBS was determined to be 8.0. Next, the optimal reaction time was determined. Reaction times ranging from 5 to 40 min were examined. Fig. 8D suggests that there is no obvious change in (F0 − F) after 10 min. Thus, an optimal incubation time of 10 min was selected for the entire reaction system. Finally, the effect of GQDs concentrations on the detection system was examined by adding vanillin to different concentrations of GQDs. The fluorescence quenching of seven different concentrations of GQDs (0.67, 1.0, 1.33, 1.67, 2.0, 2.33, 2.67 mg mL−1) induced by vanillin is shown in Fig. 8E. When the concentration of GQDs was increased from 0.67 to 2.0 mg mL−1, the (F0 − F) value first increased gradually and later decreased when the concentration was higher than 2.0 mg mL−1. Thus, the concentration of GQDs was fixed at 2.0 mg mL−1.
Detection of vanillin
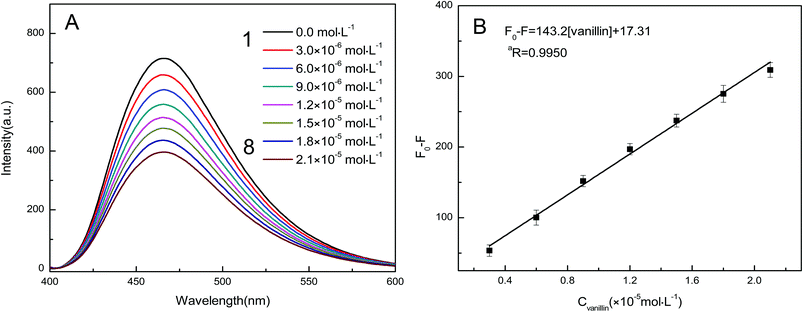
The analytical performance of the developed GQDs–vanillin system was studied under the optimum experimental conditions. Fig. 9A shows the effect of increasing concentrations of vanillin on the fluorescence emission spectrum of GQDs. Increasing the concentration of vanillin leads to a uniform decrease in the fluorescence emission intensity of the GQDs. Hence, vanillin can strongly quench the GQDs fluorescence. Meanwhile, the (F0 − F) value corresponding to the quenching shows a good linear relationship with the vanillin concentrations in the range 0.0–2.1 × 10⁻⁵ mol L−1 (Fig. 9B). The regression equation can be expressed as (F0 − F) = 143.2[vanillin] + 17.31, and the corresponding regression coefficient (aR) was 0.9950. In the limit of detection (LOD) formula, LOD = 3σ/k, σ is the standard deviation of the blank sample of the detection system and k is the slope of the standard curve. Based on this, the LOD of vanillin was calculated to be 2.5 × 10⁻⁸ mol L−1 by measuring the blank sample 10 times. This value suggests that the developed method can be used for the sensitive detection of vanillin. The methods reported in literature for vanillin detection were compared with this method, and the observations are listed in Table 1. All the methods have their own advantages; however, the method developed in this study is less time-consuming, simpler, and more sensitive than the previously reported methods.| Methods | Linear range (10−5 mol L−1) | LOD (10−8 mol L−1) | Response time | References |
|---|---|---|---|---|
| Differential pulse voltammetry (DPV) | 4.80–600 | 5.60 | 3 min | 21 |
| UV-vis spectrophotometry | 6.57–131.4 | 300 | — | 27 |
| Electrochemical method | 0.250–75.0 | 103 | 8 min | 29 |
| Fluorescence detection | 0.043–26.4 | 10.0 | 9 h | 37 |
| Fluorescence detection | 0.300–2.10 | 2.50 | 10 min | This work |
Interference study
To verify the selectivity of this method, we tested samples in which common ions, biomolecules, amino acids, and potential components in real samples coexisted. The concentration of vanillin was fixed at 9.0 × 10⁻⁶ mol L−1, and the concentrations of the other interfering substances were higher than the concentration of vanillin. Table 2 suggests that none of these substances interfered in the detection of vanillin. Thus, this method exhibits good selectivity and anti-interference ability and has potential scope of development in practical applications.| Coexisting substances | Concentrations (10−5 mol L−1) | Interference level (%) | Coexisting substances | Concentrations (10−5 mol L−1) | Interference level (%) |
|---|---|---|---|---|---|
| Pb2+ | 3.0 | −0.66 | Glutathione | 1.5 | −1.60 |
| Cd2+ | 3.0 | −2.17 | Glucose | 1.5 | −1.77 |
| Ni2+ | 1.5 | −3.06 | Citric acid | 1.5 | +0.82 |
| Cu2+ | 1.5 | +1.60 | Vitamin C | 3.0 | −0.96 |
| As3+ | 3.0 | +0.09 | Sucrose | 1.5 | −1.81 |
| Zn2+ | 3.0 | +0.56 | NaOH | 20 | −1.54 |
| Ca2+ | 3.0 | −0.46 | HCl | 17 | +1.38 |
| K+ | 1.5 | +0.17 | D(−)-Salicin | 3.0 | +0.13 |
| Na+ | 4.5 | +1.60 | 5-Sulfosalicylic acid dihydrate | 1.5 | −1.35 |
| KCl | 50 | −1.60 |
Detection of vanillin in real samples
In order to prove the practicality of the proposed method for vanillin detection, we used the standard addition method to determine the vanillin content in chocolate samples. The results show (Table 3) that the recoveries of vanillin are in the range 88.0–108.9%, and the relative standard deviation is between 0.90% and 5.4%. This indicates that GQDs are a feasible fluorescent probe with potential applications for vanillin detection.| Samples | Found (10−6 mol L−1) | Added (10−6 mol L−1) | Found (10−6 mol L−1) | Recovery (%) | RSD (%, n = 6) |
|---|---|---|---|---|---|
| Sample1 | 3.7 | 4.5 | 8.3 | 102.2 | 2.8 |
| 7.5 | 11.8 | 108.0 | 3.0 | ||
| Sample2 | 12.0 | 4.5 | 16.3 | 95.6 | 1.2 |
| 7.5 | 19.4 | 98.7 | 0.9 | ||
| Sample3 | 10.6 | 4.5 | 14.7 | 91.1 | 3.2 |
| 7.5 | 17.5 | 92.0 | 5.4 | ||
| Sample4 | 15.5 | 4.5 | 19.6 | 91.1 | 2.6 |
| 7.5 | 22.1 | 88.0 | 2.8 | ||
| Sample5 | 9.9 | 4.5 | 14.8 | 108.9 | 3.3 |
| 7.5 | 17.3 | 98.7 | 1.8 |
Conclusions
In the study, GQDs were successfully synthesized using anhydrous citric acid as a carbon source. They were characterized by various spectroscopic techniques and HRTEM. The GQDs were used as a fluorescent probe to develop a rapid, simple, sensitive, and efficient method for vanillin detection. Vanillin concentrations in the range 0.0–2.1 × 10⁻⁵ mol L−1 showed a good linear relationship with the fluorescence intensity of GQDs, with a detection limit of 2.5 × 10⁻⁸ mol L−1. At the same time, the common substances found in real samples did not interfere with the detection system. Additionally, the probe could be successfully employed for vanillin detection in chocolate.Funding
This work was supported by the Yangzhou University Cooperation Foundation under grant no. 204021035. Supported by the Open Project Program of Joint International Research Laboratory of Agriculture and Agri-Product Safety, the Ministry of Education of China, Yangzhou University (JILAR-KF202011).Author contributions
S. Z.: supervision, funding acquisition, project administration, writing-review & editing. X. B.: design, investigation, formal analysis, software, results, writing-original draft. T. W.: collected field data, methodology, formal analysis. Q. S. & J. Z.: methodology. B. W.: projected administration, formal analysis. All authors gave final approval for publication.Conflicts of interest
The authors declare no competing financial interest.Acknowledgements
The authors acknowledge the Yangzhou University Cooperation Foundation support for our research. We are grateful to the Interaction of Biological molecules Laboratory of College of Bioscience and Biotechnology and the Testing Center of Yangzhou University for helping in UV visible, and acknowledge the Guangzhou Micromon Technology Services CO., Ltd for helping FT-IR and HRTEM observation.References
- H. L. Tran and R. Doong, Anal. Methods, 2019, 11(35), 4421–4430, 10.1039/C9AY01138B.
- S. Benítez-Martínez and M. Valcárcel, Trends Anal. Chem., 2015, 72, 93–113, DOI:10.1016/j.trac.2015.03.020.
- F. X. Wang, Z. Y. Gu, W. Lei, W. J. Wang, X. F. Xia and Q. L. Hao, Sens. Actuators, B, 2014, 190, 516–522, DOI:10.1016/j.snb.2013.09.009.
- H. J. Sun, L. Wu, W. L. Wei and X. G. Qu, Mater. Today, 2013, 16(11), 433–442, DOI:10.1016/j.mattod.2013.10.020.
- M. R. Farmani, H. Peyman and H. Roshanfekr, Spectrochim. Acta, Part A, 2019, 229, 117960, DOI:10.1016/j.saa.2019.117960.
- Q. N. Zhao, W. Song, B. Zhao and B. Yang, Mater. Chem. Front., 2020, 4, 472–488, 10.1039/c9qm00592g.
- J. H. Shen, Y. H. Zhu, X. L. Yang, C. Z. Li, J. H. Shen, Y. H. Zhu, X. L. Yang and C. Z. Li, Cheminform, 2012, 48(31), 3686–3699, 10.1039/c2cc00110a.
- Q. F. Zhuang, Y. Wang and Y. N. Ni, Luminescence, 2015, 31(3), 746–753, DOI:10.1002/bio.3019.
- S. Y. Ge, J. B. He, C. X. Ma, J. Y. Liu, F. N. Xi and X. P. Dong, Talanta, 2019, 199, 581–589, DOI:10.1016/j.talanta.2019.02.098.
- Y. Fu, G. Y. Gao and J. F. Zhi, J. Mater. Chem. B, 2019, 7(9), 1494–1502, 10.1039/c8tb03103g.
- P. K. Dewangan, F. Khan, V. Sahu, K. Kashyap and K. Patel, Mater. Sci. Eng., 2020, 798, 012030, DOI:10.1088/1757-899X/798/1/012030.
- S. Sharma, A. Umar, S. K. Mehta and S. K. Kansal, Ceram. Int., 2017, 43(9), 7011–7019, DOI:10.1016/j.ceramint.2017.02.127.
- Q. Ge, W. H. Kong, X. Q. Liu, Y. M. Wang, L. F. Wang, N. Ma and Y. Li, Int. J. Miner., Metall. Mater., 2020, 01, 91–99, DOI:10.1007/s12613-019-1908-4.
- L. H. Ding, Z. Y. Zhao, D. J. Li, X. Wang and J. L. Chen, Spectrochim. Acta, Part A, 2019, 214, 320–325, DOI:10.1016/j.saa.2019.02.048.
- X. Y. Zhou, Z. Y. Li and Z. J. Li, Spectrochim. Acta, Part A, 2017, 171, 415–424, DOI:10.1016/j.saa.2016.08.037.
- H. Huang, Z. Q. Feng, Y. X. Li, Z. N. Liu, L. Zhang, Y. H. Ma and J. Tong, Anal. Methods, 2015, 7(7), 2928–2935, 10.1039/c4ay03080j.
- J. P. Zhang, L. H. Na, Y. X. Jiang, D. W. Lou and L. Jin, Anal. Methods, 2016, 8, 7242, 10.1039/c6ay02203k.
- Y. J. Yan, X. W. He, W. Y. Li and Y. K. Zhang, Biosens. Bioelectron., 2017, 91, 253–261, DOI:10.1016/j.bios.2016.12.040.
- X. Zhou, P. P. Ma, A. Q. Wang, C. F. Yu, T. Qian, S. S. Wu and J. Shen, Biosens. Bioelectron., 2015, 64, 404–410, DOI:10.1016/j.bios.2014.09.038.
- Y. H. Li, L. Zhang, J. Huang, R. P. Liang and J. D. Qiu, Chem. Commun., 2013, 49(45), 5180–5182, 10.1039/C3CC40652K.
- J. Y. Peng, C. T. Hou and X. Y. Hu, Int. J. Electrochem. Sci., 2012, 7(2), 1724–1733, DOI:10.3103/S1068375512010036.
- V. Veeramani, R. Madhu, S. M. Chen, P. Veerakumar, J. J. Syu and S. B. Liu, New J. Chem., 2015, 39, 9109, 10.1039/c5nj01634g.
- J. Y. Peng, L. Y. Wei, Y. X. Liu, W. F. Zhuge, Q. Huang, W. Huang, G. Xiang and C. Z. Zhang, RSC Adv., 2020, 10, 36828, 10.1039/d0ra06783k.
- K. D. Moon, P. Delaquis, P. Toivonen, S. Bach, K. Stanich and L. Harris, J. Food Prot., 2006, 69(3), 542–547, DOI:10.1016/j.fm.2005.02.005.
- A. Tai, T. Sawano, F. Yazama and H. Ito, Biochim. Biophys. Acta, 2011, 1810(2), 170–177, DOI:10.1016/j.bbagen.2010.11.004.
- L. Shang, F. Q. Zhao and B. Z. Zeng, Food Chem., 2014, 151, 53–57, DOI:10.1016/j.foodchem.2013.11.044.
- Y. N. Ni, G. W. Zhang and S. Kokot, Food Chem., 2005, 89(3), 465–473, DOI:10.1016/j.foodchem.2004.05.037.
- Y. L. Tian, P. H. Deng, Y. Y. Wu, J. Liu, J. H. Li, G. G. Li and Q. G. He, Microchem. J., 2020, 157, 104885, DOI:10.1016/j.microc.2020.104885.
- L. F. Chen, K. Chaisiwamongkhol, Y. Q. Chen and R. G. Compton, Rapid Electrochemical Detection of Vanillin in Natural Vanilla, Electroanalysis, 2019, 31, 1067–1074, DOI:10.1002/elan.201900037.
- S. Kahan and D. A. Krueger, J. AOAC Int., 1997, 80(3), 564–570 CrossRef CAS.
- J. F. Peng, M. L. Wei, Y. W. Hu, Y. Yang, Y. H. Guo and F. Zhang, Food Anal. Methods, 2019, 12(8), 1725–1735, DOI:10.1007/s12161-019-01518-3.
- J. D. Li, X. J. Liu, X. Liang, M. M. Zhang, L. Han and J. Y. Song, Sci. Rep., 2019, 9(1), 12085, DOI:10.1038/s41598-019-48522-5.
- L. Z. Liu, Z. Mi, Q. Hu, C. Q. Li, X. H. Li and F. Feng, Anal. Methods, 2019, 11(3), 353–358, 10.1039/c8ay02361a.
- Y. Q. Dong, J. W. Shao, C. Q. Chen, H. Li, R. X. Wang, Y. W. Chi, X. M. Lin and C. N. Chen, Carbon, 2012, 50(12), 4738–4743, DOI:10.1016/j.carbon.2012.06.002.
- A. T. R. Williams, S. A. Winfield and J. N. Miller, Analyst, 1983, 108(1290), 1067–1071, 10.1039/an9830801067.
- X. T. Zheng, A. Than, A. Ananthanaraya, D. H. Kim and P. Chen, ACS Nano, 2013, 7(7), 6278–6286, DOI:10.1021/nn4023137.
- Y. P. Wang, Q. L. Yue, Y. Y. Hu, C. Lin, L. X. Tao and C. Zhang, RSC Adv., 2019, 9, 40222–40227, 10.1039/c9ra08352a.
| This journal is © The Royal Society of Chemistry 2021 |

