 Open Access Article
Highly sensitive naphthalimide based Schiff base for the fluorimetric detection of Fe3+†
Dhanapal Jothia,
Sathishkumar Munusamyb,
Sathish Sawminathana and
Sathiyanarayanan Kulathu Iyer *a
*a
aDepartment of Chemistry, School of Advanced Sciences and Vellore Institute of Technology, Vellore-632014, India. E-mail: sathiya_kuna@hotmail.com
bInstitute of Chemical Biology and Nanomedicine, State Key Laboratory of Chemo/Bio-sensing and Chemometrics, College of Chemistry and Chemical Engineering, Hunan University, Changsha 410082, P. R. China. E-mail: pra3sat@gmail.com
First published on 17th March 2021
Abstract
A simple 1,8-naphthalimide based Schiff base probe (E)-6-((4-(diethylamino)-2-hydroxybenzylidene)amino)-2-(2-morpholinoethyl)-1H-benzo[de]isoquinoline-1,3(2H)-dione (NDSM) has been designed and synthesized for the specific detection of Fe3+ based on a fluorimetric mode. The absorbance of NDSM at 360 nm increased significantly in acetonitrile![[thin space (1/6-em)]](https://www.rsc.org/images/entities/char_2009.gif) :
:![[thin space (1/6-em)]](https://www.rsc.org/images/entities/char_2009.gif) water (7
water (7![[thin space (1/6-em)]](https://www.rsc.org/images/entities/char_2009.gif) :
:![[thin space (1/6-em)]](https://www.rsc.org/images/entities/char_2009.gif) 3, v/v) medium only in the presence of Fe3+ ions with a visible colour change from yellow to golden yellow. Likewise, fluorescence emission intensity at 531 nm was almost wholly quenched in the presence of Fe3+. However, other competitive ions influenced insignificantly or did not affect the optical properties of NDSM. Lysosome targetability was expected from NDSM due to the installation of a basic morpholine unit. The LOD was found to be 0.8 μM with a response time of seconds. The fluorescence reversibility of NDSM + Fe3+ was established with complexing agent EDTA. Fe3+ influences the optical properties of NDSM by complexing with it, which blocks C
3, v/v) medium only in the presence of Fe3+ ions with a visible colour change from yellow to golden yellow. Likewise, fluorescence emission intensity at 531 nm was almost wholly quenched in the presence of Fe3+. However, other competitive ions influenced insignificantly or did not affect the optical properties of NDSM. Lysosome targetability was expected from NDSM due to the installation of a basic morpholine unit. The LOD was found to be 0.8 μM with a response time of seconds. The fluorescence reversibility of NDSM + Fe3+ was established with complexing agent EDTA. Fe3+ influences the optical properties of NDSM by complexing with it, which blocks C![[double bond, length as m-dash]](https://www.rsc.org/images/entities/char_e001.gif) N isomerization in addition to the ICT mechanism. The real-time application of Fe3+ was demonstrated in test paper-based detection, by the construction of a molecular logic gate, quantification of Fe3+ in water samples and fluorescence imaging of Fe3+.
N isomerization in addition to the ICT mechanism. The real-time application of Fe3+ was demonstrated in test paper-based detection, by the construction of a molecular logic gate, quantification of Fe3+ in water samples and fluorescence imaging of Fe3+.
Introduction
The intrinsic properties of transition metal ions play an inevitable role in biology and the environment.1–3 As the most basic and abundant metallic element in the biological system, Fe3+ plays a substantial role as an oxygen carrier and aids in the process of electron transfer for the synthesis of ribonucleic acid (RNA) and deoxyribonucleic acid (DNA). In contrast, chronically elevated levels of Fe3+ have been associated with fatal diseases including, but not limited to hepatitis, hemochromatosis, various cancers, and possible dysfunction of vital organs, such as the liver, heart, and pancreas.4–6 Therefore, it is pertinent to develop a highly sensitive and selective probe for the detection of Fe3+ ions, which could be pivotal for the early diagnosis of diseases.Recently optical detection of analytes, especially cations, has attracted significant attention of researchers due to the confluence of advantages such as low detection limit, simplicity of the analytical procedure, high sensitivity and selectivity, and possible naked-eye detection.7–24 In particular, an arduous effort has been dedicated to manoeuvring fluorescent probes to detect vital analytes. With hindsight, several fluorescent probes have been developed and studied for the detection of Fe3+ ion.25–38 Among them, Schiff bases are generally used motifs.39–44 In general, Schiff base fluorophores exhibit excited state intramolecular charge transfer (ESIPT) process. ESIPT probes are known for their environment-sensitive emission properties and massive Stokes shift. Coordination with metal ions will inhibit the ESIPT process, and the emission from the keto (K*) tautomer will disappear or get shifted to lower wavelengths. Meanwhile, the stabilized enol form (E*) would show substantial excitation peak.45–53 Patil et al. have developed a colorimetric probe based on 2-aminoquinolin-3-yl phenyl hydrazone Schiff base for Fe3+ chemosensor.54 Recently, a new Schiff-based macrocyclic host has been reported for the sensing and removal of Fe3+.55 Finelli et al. reported salen-type anthracene-based probe for the selective fluoro-colourimetric detection of Fe3+.56 Phenol-based Schiff base, 4-pyridine-2-ylmethyleneaminophenol (PYAP) was found to be highly sensitive towards Fe3+ low-level detection with the naked eye.57,58 Most of these ligands suffer from low sensitivity, irreversible sensing and poor subcellular selectivity.
The photophysical properties and diagnostic application of 4-aminonaphthalimide scaffolds have been ardently studied.59–61 The integral property of photostability and unhindered cell permeability makes 4-aminonaphthalimide derivative an immediate candidate for fluorescence bioimaging. Furthermore, these compounds display a fervent intramolecular charge (ICT) transfer from electron-donating amine to imide. Due to ICT, most of these compounds are sensitive to the polarity of the solvent medium. Besides, the spectroscopic and binding profile of these compounds can be fine-tuned by incorporating an appropriate functional group on C-4 position. Further, the imide group can be installed with subcellular targetable moiety. As garbage disposing cellular organelle, liposomes host iron storing macromolecules, ferritin and electron transport proteins which enhance the accumulation of iron in liposomes.62,63 With these compounding facts, we envisage that lysosome specific sensitive and selective fluorescent detection of Fe3+ will be an immense stride towards the understanding of Fe3+ metabolism.
With these insights in view, herein, we report naphthalimide – Schiff based hybrid fluorescence ‘On–Off–On’ type fluorescent probe NDSM. This can act as a fluorometric/colorimetric detection probe for Fe3+ with high selectivity and sensitivity. The obtained experimental results revealed NDSM with a remarkable low limit of detection (LOD), anti-interference from other metal ions, reasonably quick response and reversibility of the fluorescence. The fluorescence quenching commenced from the complexation between NDSM and Fe3+. The complexed Fe3+ can be successfully retrieved using EDTA. Real-time analysis in various water bodies revealed that NDSM could be successfully implemented in pollution inspection of Fe3+ and bioimaging studies, which confirmed NDSM as a vital imaging probe for Fe3+.
Experimental section
All common reagents and solvents were purchased as AR grade from commercial sources, blood sample to prepare deproteinized human serum was received from health center of Vellore Institute of Technology, Vellore campus. E. coli strains were purchased from Sigma Aldrich. 1H and 13C NMR spectra of compounds were recorded using Bruker 400 MHz instrument. UV-visible absorption spectra were taken using a Hitachi U-2910 spectrophotometer. Fluorescence spectra were recorded using a Hitachi F-7000 fluorescence spectrometer. Biological images were recorded on WEXWOX fluorescence research microscope 3000. Quantum yields were calculated using quinine sulfate (Φfl = 0.54 in 0.5 M H2SO4 solution) as a reference standard. FTIR spectrum was performed on a Jasco-4100 instrument. LC-MS was recorded using Agilent 6495 LCMSMS instrument.Synthesis of compound-1
4-Bromo-1,8 naphthalic anhydride (1 g, 0.003 mmol) and 2-morpholinoethan-1-amine (0.564 g, 0.004 mmol) were dissolved in 25 mL of anhydrous ethanol solvent. This reaction mixture was refluxed for 10 h and the completion of the reaction was monitored by TLC. After the completion of the reaction, the reaction mixture was allowed to cool to room temperature, filtered and washed with diethylether to give pure yellow color solid. Yield 80%; 1H NMR (400 MHz, DMSO-d6): δ 2.5834–2.595 (t, 4H, 2× CH2, J = 4.64 Hz), 2.685–2.702 (t, 2H, CH2, J = 6.8 Hz), 3.665–3.676 (t, 4H, 2× CH2, J = 4.4 Hz), 4.307–4.324 (t, 2H, CH2, J = 6.8 Hz), 7798–7.810 (t, 1H, ArCH, J = 4.8), 7.984–7.994 (t, 1H, ArCH, J = 4 Hz), 8.340–8.351 (t, 1H, ArCH, J = 4.4 Hz), 8.503–8.524 (d, 1H, ArCH, J = 8.4 Hz), 8.591–8.599 (d, 1H, ArCH, J = 3.2 Hz). 13C NMR (DMSO-d6, 100 MHz): δ 37.32, 53.81, 56.08, 67.03, 122.11, 122.98, 128.92, 130.27, 130.54, 131.07, 131.17, 131.99, 133.23, 163.51, 163.54.Synthesis of compound-2
Compound-1 (500 mg, 0.00128 mmol) and sodium azide (215 mg, 0.00385 mmol) were mixed in 20 mL of HPLC-DMSO solvent medium under nitrogen atmosphere. The reaction mixture was allowed to react at 100 °C for 5 hours. After the completion of the reaction, the reaction mixture was allowed to cool at room temperature, and NaSH (271 mg, 0.0032 mmol) was added. The mixture was vigorously stirred for about 3 hours. After the completion of the reaction (monitored on TLC), cold water was added to the reaction mixture and the resulting yellow color precipitate was filtered and washed with 10 mL of diethyl ether and dried. Yield 90%; 1H NMR (400 MHz, DMSO-d6): δ 2.451–2.507 (t, 6H, 3× CH2, J = 22.4 Hz), 3.5254–3.5349 (t, 4H, 2× CH2, J = 3.8 Hz), 4.117–4.134 (t, 2H, CH2, J = 6.8 Hz), 6.827–6.848 (d, 1H, ArCH, J = 8.4 Hz), 7.450 (s, 2H, NH2), 7.622–7.641 (t, 1H, ArCH, J = 7.6 Hz), 8.169–8.190 (d, 1H, ArCH, J = 8.4 Hz), 8.402–8.420 (d, 1H, ArCH, J = 7.2 Hz), 8.595–8.616 (d, 1H, ArCH, J = 8.4 Hz). 13C NMR (DMSO-d6, 100 MHz): δ 36.82, 53.89, 56.28, 66.68, 107.94, 108.62, 119.81, 122.19, 124.43, 129.78, 130.16, 131.47, 134.43, 153.20, 163.32, 164.23.Synthesis of NDSM
To a suspension of compound 2 (500 mg, 0.0015 mmol), 4-(diethylamino) salicylaldehyde (356 mg, 0.0018 mmol) was added in absolute ethanol (20 mL) and catalytic amount of acetic acid (18 μL, 0.003 mmol) was added to the same solution. The resulting solution was stirred at 90 °C for 10 hours. After cooling it to room temperature, the reaction mixture was monitored by TLC and the crude product was purified by column chromatography using n-hexane/ethylacetate (1![[thin space (1/6-em)]](https://www.rsc.org/images/entities/char_2009.gif) :
:![[thin space (1/6-em)]](https://www.rsc.org/images/entities/char_2009.gif) 1) as an eluent to afford compound NDSM as an orange solid with 82% yield; 1H NMR (400 MHz, DMSO-d6): δ 1.1174 (t, 3H, CH3), 2.2870–2.5078 (d, 5H, CH2, J = 3.8 Hz), 3.1758–3.3947 (m, 10H, CH2, J = 6.8 Hz), 4.0120–4.0364 (d, 2H, CH2, J = 8.4 Hz), 4.3752 (s, 2H, CH2), 6.0492 (s, 1H, ArCH, J = 7.6 Hz), 6.3346–6.3532 (d, 1H, ArCH, J = 8.4 Hz), 6.8743–6.8916 (d, 1H, ArCH, J = 7.2 Hz), 7.1034–7.1170 (d, 1H, ArCH, J = 8.4 Hz), 7.4124–7.4331 (d, 1H, ArCH, J = 8.4 Hz), 8.2167–8.2341 (d, 1H, ArCH, J = 8.4 Hz), 8.4555–8.467 (d, 1H, ArCH, J = 8.4 Hz), 8.6669–8.6847 (d, 1H, ArCH, J = 8.4 Hz), 9.6176 (s, 1H, C
1) as an eluent to afford compound NDSM as an orange solid with 82% yield; 1H NMR (400 MHz, DMSO-d6): δ 1.1174 (t, 3H, CH3), 2.2870–2.5078 (d, 5H, CH2, J = 3.8 Hz), 3.1758–3.3947 (m, 10H, CH2, J = 6.8 Hz), 4.0120–4.0364 (d, 2H, CH2, J = 8.4 Hz), 4.3752 (s, 2H, CH2), 6.0492 (s, 1H, ArCH, J = 7.6 Hz), 6.3346–6.3532 (d, 1H, ArCH, J = 8.4 Hz), 6.8743–6.8916 (d, 1H, ArCH, J = 7.2 Hz), 7.1034–7.1170 (d, 1H, ArCH, J = 8.4 Hz), 7.4124–7.4331 (d, 1H, ArCH, J = 8.4 Hz), 8.2167–8.2341 (d, 1H, ArCH, J = 8.4 Hz), 8.4555–8.467 (d, 1H, ArCH, J = 8.4 Hz), 8.6669–8.6847 (d, 1H, ArCH, J = 8.4 Hz), 9.6176 (s, 1H, C![[double bond, length as m-dash]](https://www.rsc.org/images/entities/char_e001.gif) N), 11.2487 (s, 1H, OH). 13C NMR (DMSO-d6, 100 MHz): δ 12.90, 34.35, 44.58, 52.07, 54.84, 63.77, 96.41, 104.94, 111.70, 119.82, 122.15, 124.50, 125.95, 128.51, 130.19, 131.75, 134.43, 134.74, 138.06, 146.19, 163.73, 163.86, 164.85. HRMS for C29H32N4O4. Calculated [M+] m/z 501.2424, found: 501.2480.
N), 11.2487 (s, 1H, OH). 13C NMR (DMSO-d6, 100 MHz): δ 12.90, 34.35, 44.58, 52.07, 54.84, 63.77, 96.41, 104.94, 111.70, 119.82, 122.15, 124.50, 125.95, 128.51, 130.19, 131.75, 134.43, 134.74, 138.06, 146.19, 163.73, 163.86, 164.85. HRMS for C29H32N4O4. Calculated [M+] m/z 501.2424, found: 501.2480.
UV-visible absorption and fluorescence studies
The UV-visible absorption and fluorescence studies of the probe NDSM were carried out using 2 × 10⁻⁵ M solution. A stock solution of probe NDSM (2 × 10⁻³ M) was prepared in CH3CN. Metal stock solution (1 × 10⁻³ M) was prepared by adding various metal salts in double-distilled water. Absorption spectra were recorded using 1 cm quartz cell, and the range of spectra recorded was 200–800 nm. The emission spectra were obtained using quartz cuvette of 10 mm, 5 nm slit width, and performed by excitation at 344 nm, medium sensitivity and 1 second response time.Fluorescence and absorption measurements were performed as follows: appropriate volume from a stock solution of metal ions (1 × 10⁻³ M, H2O) was added to the 2 mL of NDSM (2 × 10⁻⁵ M, CH3CN![[thin space (1/6-em)]](https://www.rsc.org/images/entities/char_2009.gif) :
:![[thin space (1/6-em)]](https://www.rsc.org/images/entities/char_2009.gif) H2O (7
H2O (7![[thin space (1/6-em)]](https://www.rsc.org/images/entities/char_2009.gif) :
:![[thin space (1/6-em)]](https://www.rsc.org/images/entities/char_2009.gif) 3)) solution. For determination of Fe3+ in the human serum sample, deproteinized human serum sample was prepared according to the literature procedure. Aliquots of the above deproteinized human serum sample were added to 2 mL of NDSM solution, and the emission spectra were recorded immediately.
3)) solution. For determination of Fe3+ in the human serum sample, deproteinized human serum sample was prepared according to the literature procedure. Aliquots of the above deproteinized human serum sample were added to 2 mL of NDSM solution, and the emission spectra were recorded immediately.
Equations
The binding constant (Kb) was calculated from fluorescence titration using modified Benesi–Hildebrand (B–H) equation (eqn (1)). The value of intercept and slope were taken from the plot of 1/[F − F0] versus 1/[Fe3+].| 1/(F − F0) = 1/Kb × 1/(Fmax − F0) ×1/[Fe3+] + 1/(Fmax − F0) | (1) |
For the calculation of limit of detection (LOD), 3σ method was followed as given in the following equation.
| LOD = 3σ/K | (2) |
| F0/F = 1 + KSV[Q] | (3) |
Equation followed to calculate quantum yield is as follows (eqn (4)).
| ϕ_x = ϕ_s × F_u/F_s × A_S/A_u | (4) |
Preparation of test paper
Test paper strips were immersed in the probe solution of NDSM (20 μM in CH3CN) and then dried well in a hot air oven at 40 °C for 30 minutes. These test paper strips were tested with the addition of aqueous solution (1 mM) of various sensing metal ions and were irradiated under UV light of 365 nm. Additionally, the sensor probe NDSM test strips were studied with the solution of Fe3+ (aqueous medium) with different concentrations varying from 0 to 5 equivalents.Bioimaging of NDSM in E. coli cells
Freshly prepared E-coli cells grown in Luria–Bertani medium were used for bioimaging analysis. The stock solution (20 μM) was prepared by dissolving NDSM in 70% acetonitrile in water (v/v). The prepared cells were washed with phosphate-buffered saline (PBS) and incubated with NDSM at 37 °C for 30 min. After incubation, fluorescence images of E. coli cells were recorded using WEXWOX fluorescence research microscope. Blue channel of the range between 400–500 nm was used. Then, E. coli cells treated with NDSM were added with Fe3+ solution and incubated for 30 min at 37 °C, and washed thrice with PBS buffer. Finally, the cells were imaged on a fluorescence microscope.Results and discussion
Design and synthesis of probe NDSM
The synthesis of NDSM was attained in good yields, as depicted in Scheme S1,† and the structure is given in Scheme S1 (see ESI file Scheme S1†). The structure and the purity of product NDSM were confirmed by 1H, 13C NMR, and LC-MS analysis (Fig. S1–S3†). As can be seen in the Scheme S1 (see ESI file Scheme S1†), lysosome targeting morpholine moiety is installed on naphthalimide as an amide. Compound NDSM was allowed to react with 4-(diethylamino)-2-hydroxybenzaldehyde to form a Schiff base which is the binding unit for Fe3+. Bright emission from NDSM emanates from ICT. Complexation of Fe3+ with NDSM blocking of ICT to quench the fluorescence of NDSM. Additionally, widely known complexing agent EDTA can retrieve Fe3+ from NDSM–Fe3+ complex to recuperate the fluorescence of NDSM.Spectroscopic property and optical responses to Fe3+
The absorption spectrum of NDSM (2 × 10⁻⁵ M) in acetonitrile![[thin space (1/6-em)]](https://www.rsc.org/images/entities/char_2009.gif) :
:![[thin space (1/6-em)]](https://www.rsc.org/images/entities/char_2009.gif) water (7
water (7![[thin space (1/6-em)]](https://www.rsc.org/images/entities/char_2009.gif) :
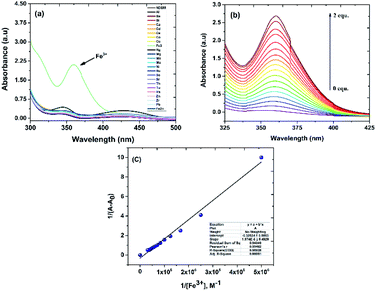
:![[thin space (1/6-em)]](https://www.rsc.org/images/entities/char_2009.gif) 3) solvent showed weak absorption peak at 344 nm (7500 mol−1 dm3 cm−1) and 430 nm (2500 mol−1 dm3 cm−1) (Fig. S4†). To begin with, the absorption spectrum of NDSM was recorded with 10 equivalents of various metal ions. As can be seen in Fig. 1, of the various metals added, only Fe3+ instilled a distinguishable change in the absorption spectrum of NDSM. Addition of only two equivalents of Fe3+ brought about a new and clear peak at around 360 nm (105
3) solvent showed weak absorption peak at 344 nm (7500 mol−1 dm3 cm−1) and 430 nm (2500 mol−1 dm3 cm−1) (Fig. S4†). To begin with, the absorption spectrum of NDSM was recorded with 10 equivalents of various metal ions. As can be seen in Fig. 1, of the various metals added, only Fe3+ instilled a distinguishable change in the absorption spectrum of NDSM. Addition of only two equivalents of Fe3+ brought about a new and clear peak at around 360 nm (105![[thin space (1/6-em)]](https://www.rsc.org/images/entities/char_2009.gif) 500 mol−1 dm3 cm−1). Other metal ions had very little or no effect on the absorption of NDSM.
500 mol−1 dm3 cm−1). Other metal ions had very little or no effect on the absorption of NDSM.
Furthermore, the addition of Fe3+ caused a phenomenal 30-fold increase in the molar absorptivity. Metal to ligand charge transfer can be ascribed to the enhancement of absorption at 360 nm. In free NDSM, isomerization at C![[double bond, length as m-dash]](https://www.rsc.org/images/entities/char_e001.gif) N weakened the ligand-to-ligand charge transfer which in turn led to feeble ICT absorption band. Selective complexation with Fe3+ hindered isomerization at C
N weakened the ligand-to-ligand charge transfer which in turn led to feeble ICT absorption band. Selective complexation with Fe3+ hindered isomerization at C![[double bond, length as m-dash]](https://www.rsc.org/images/entities/char_e001.gif) N, which led to strong ICT transition and absorption. This result implies the selective sensing of NDSM towards Fe3+. The quantitative sensing of Fe3+ by NDSM was analyzed by the incremental addition of Fe3+ leading to saturation during the addition of 2 equivalents (Fig. 1b). The ligand absorption at 360 nm underwent gradual and remarkable enhancement with a bathochromic shift, substantiating the complexation and restrained C
N, which led to strong ICT transition and absorption. This result implies the selective sensing of NDSM towards Fe3+. The quantitative sensing of Fe3+ by NDSM was analyzed by the incremental addition of Fe3+ leading to saturation during the addition of 2 equivalents (Fig. 1b). The ligand absorption at 360 nm underwent gradual and remarkable enhancement with a bathochromic shift, substantiating the complexation and restrained C![[double bond, length as m-dash]](https://www.rsc.org/images/entities/char_e001.gif) N isomerization. According to Benesi–Hildebrand (B–H plot) nonlinear curve fitting method, plot between absorption intensity ratio and 1/[Fe3+] was plotted, which confirmed 1
N isomerization. According to Benesi–Hildebrand (B–H plot) nonlinear curve fitting method, plot between absorption intensity ratio and 1/[Fe3+] was plotted, which confirmed 1![[thin space (1/6-em)]](https://www.rsc.org/images/entities/char_2009.gif) :
:![[thin space (1/6-em)]](https://www.rsc.org/images/entities/char_2009.gif) 1 binding stoichiometry of NDSM and Fe3+ (Fig. 1c). From this plot, the association constant was found to be Ka = 1.68 × 10⁴ M−1 for the NDSM + Fe3+ complex.
1 binding stoichiometry of NDSM and Fe3+ (Fig. 1c). From this plot, the association constant was found to be Ka = 1.68 × 10⁴ M−1 for the NDSM + Fe3+ complex.
Fluorescence studies on the detection of Fe3+ by NDSM
Encouraged by UV-vis studies, we extended sensing study of NDSM to fluorescence platform. Probe NDSM (2 × 10⁻⁵ M) displayed a strong fluorescence emission at 531 nm when excited at 344 nm UV light with ΦFl calculated to be 0.28 (quinine sulfate in 0.1 N H2SO4 as a standard). The Stokes shift was found to be 53![[thin space (1/6-em)]](https://www.rsc.org/images/entities/char_2009.gif) 475 cm−1 (187 nm), which is relatively large due to the cooperation of ESIPT and ICT processes in the Schiff base region. The influence of various metal ions on the emission property of NDSM was studied and is displayed in Fig. S5.† Fluorescence of NDSM was almost wholly quenched over the addition of 2 equivalence of Fe3+, whereas other metal ions were unable to affect the fluorescence of NDSM. This indicates that probe NDSM can act as a selective “turn-off” sensor for the detection of Fe3+.
475 cm−1 (187 nm), which is relatively large due to the cooperation of ESIPT and ICT processes in the Schiff base region. The influence of various metal ions on the emission property of NDSM was studied and is displayed in Fig. S5.† Fluorescence of NDSM was almost wholly quenched over the addition of 2 equivalence of Fe3+, whereas other metal ions were unable to affect the fluorescence of NDSM. This indicates that probe NDSM can act as a selective “turn-off” sensor for the detection of Fe3+.
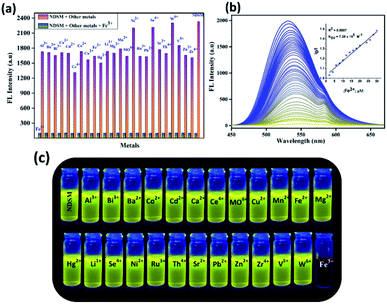
The interference of other competitive metal ions and anions over the detection of Fe3+ using NDSM was studied. As can be seen from Fig. 2a, the sensing was perturbed by the presence of other ions, even 10 equivalents, which indicated high selectivity of NDSM towards Fe3+. Besides, bright and clear yellow emission of the probe was completely switched off when viewed under the UV light (Fig. 2c), whereas other metal ions retained the yellow emission. Using the UV-vis spectra, the quantitative sensing ability of NDSM towards Fe3+ was studied by the titration method, as shown in Fig. 2b. The fluorescence intensity changes over the gradual increase of the concentration of Fe3+ were investigated. The fluorescence intensity decrease at 531 nm was gradual, with increasing concentration of Fe3+, which eventually became constant at two equivalents of Fe3+. As can be seen in Fig. 2b (inset), the plot of I0/I maintains a linear relationship between the concentration of Fe3+ and emission intensity of NDSM. Using 3σ/K method, the detection limit was calculated from emission titration method, which was found to be 0.81 μM (Fig. S6†).
Electrochemical study
Cyclic voltammetry (CV) experiments were performed with NDSM modified glassy carbon electrode (GCE-NDSM) in an electrolyte with pH 7 phosphate buffer (PBS) solution at a scan rate of 50 mV s−1 under a nitrogen atmosphere to determine the electrochemical behaviour as well as charge transfer process. As can be seen from Fig. S7† a feeble redox peak appeared around 0.15 to 0.2 V vs. Ag/AgCl due to the presence of ICT process in the molecule. The estimated HOMO (EHOMO = ELUMO − Egap) and LUMO (ELUMO = −4.8 eV − Ered) energy gaps −7.55 eV and −4.95 eV, respectively were found almost close to the structural motif characteristic of good charge transition. Moreover, for NDSM the energy difference (ΔE) estimated through CV (2.6 eV) and UV-vis absorption (2.52 eV) (Fig. S7b†) methods suggested that probe NDSM is a suitable D–A system with possibility of ICT.Effect of pH and time response
The effect of pH on the emission behaviour NDSM and Fe3+ at various pH values was studied to comprehending the practical utility of probe to detect Fe3+ (Fig. 3a). Experimental results demonstrated that the fluorescence of free NDSM was not affected in pH window of 5–12. This suggests that the probe has not been affected in this pH range. But when the pH of the medium was reduced further, a significant decline in emission intensity was observed, and the lowest emission intensity was recorded at pH = 1. This could be due to the interference of ESIPT in strongly acidic condition. However, the quenched fluorescence of NDSM + Fe3+ was not affected in the entire pH region tested. Thus, detection of Fe3+ using NDSM can be realized in the pH range of 5–12, especially under the physiological and neutral pH conditions. Besides, the fluorescence response time of NDSM towards the addition of Fe3+ was studied by monitoring fluorescence vs. time. As shown in Fig. 3b, the addition of Fe3+ to NDSM caused immediate quenching of emission and reached the plateau in 2 seconds. This demonstrates there is an instant complex formation between NDSM and Fe3+. This indicates cultivation time free detection of Fe3+ by NDSM with potential applicability in real-time applications.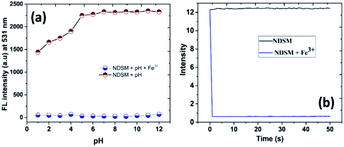 | ||
| Fig. 3 (a) Effect of pH on the fluorescence response of NDSM and NDSM + Fe3+. (b) Fluorescence response time of NDSM over the addition of Fe3+. | ||
Binding stoichiometry and sensing mechanism
To get an insight into the complexing stoichiometry between NDSM and Fe3+, B–H a linear curve was plotted, as shown in Fig. 4a. The linear tendency of the B–H plot indicates there is 1![[thin space (1/6-em)]](https://www.rsc.org/images/entities/char_2009.gif) :
:![[thin space (1/6-em)]](https://www.rsc.org/images/entities/char_2009.gif) 1 complex formation between NDSM and Fe3+. From this linear plot, the association binding constant (Ka) was calculated to be 2.49 × 10⁴ M−1. Additionally, Job's plot method was used to evaluate the binding stoichiometry between NDSM and Fe3+. As can be seen in Fig. 4b, the fluorescence intensity of NDSM + Fe3+ was plotted against molar fraction by maintaining constant total concentration. The deflection point appeared at 0.5 molar ratio, which indicates 1
1 complex formation between NDSM and Fe3+. From this linear plot, the association binding constant (Ka) was calculated to be 2.49 × 10⁴ M−1. Additionally, Job's plot method was used to evaluate the binding stoichiometry between NDSM and Fe3+. As can be seen in Fig. 4b, the fluorescence intensity of NDSM + Fe3+ was plotted against molar fraction by maintaining constant total concentration. The deflection point appeared at 0.5 molar ratio, which indicates 1![[thin space (1/6-em)]](https://www.rsc.org/images/entities/char_2009.gif) :
:![[thin space (1/6-em)]](https://www.rsc.org/images/entities/char_2009.gif) 1 binding mode between NDSM and Fe3+.
1 binding mode between NDSM and Fe3+.
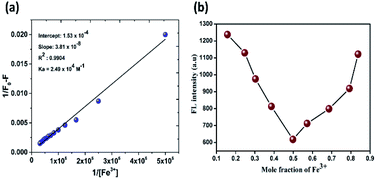 | ||
Fig. 4 (a) B–H plot of the 1![[thin space (1/6-em)]](https://www.rsc.org/images/entities/char_2009.gif) : :![[thin space (1/6-em)]](https://www.rsc.org/images/entities/char_2009.gif) 1 complex of probe NDSM and Fe3+ ions; (b) Job's plot for determining the stoichiometry of NDSM and Fe3+ ions. 1 complex of probe NDSM and Fe3+ ions; (b) Job's plot for determining the stoichiometry of NDSM and Fe3+ ions. | ||
The binding event of the NDSM with Fe3+ is represented in Fig. S8.† The complexation of Fe3+ on the Schiff base region of the probe is responsible for the concomitant optical event of the probe. FT-IR and LC-MS experiments were carried out to further confirm the binding mechanism. In FT-IR (Fig. S9†), the characteristic phenolic O–H stretching frequency of NDSM that appeared at 3441 cm−1 got broadened and shifted to 3539 cm−1. The stretching vibration of the imine C![[double bond, length as m-dash]](https://www.rsc.org/images/entities/char_e001.gif) N group of ligand at 1581 cm−1 completely disappeared in the complex system. This indicates Fe3+ forms complex with NDSM by interaction with the nitrogen atom of imine and phenolic –OH. LC-MS analysis of NDSM–Fe3+ showed exact mass value for the formed 1
N group of ligand at 1581 cm−1 completely disappeared in the complex system. This indicates Fe3+ forms complex with NDSM by interaction with the nitrogen atom of imine and phenolic –OH. LC-MS analysis of NDSM–Fe3+ showed exact mass value for the formed 1![[thin space (1/6-em)]](https://www.rsc.org/images/entities/char_2009.gif) :
:![[thin space (1/6-em)]](https://www.rsc.org/images/entities/char_2009.gif) 1 complex (Fig. S10†).
1 complex (Fig. S10†).
Reversibility study
For real-time application and from the economic aspect, reversibility is the vital parameter of the probe. To validate the reversibility of NDSM sensor towards Fe3+, a fervent complexing agent EDTA was added to the solution of NDSM–Fe3+ complex system. Initially, free NDSM exhibits intense fluorescence and addition of Fe3+ quenched the emission almost wholly. To this solution, one equivalent of Na2–EDTA was added, and the emission was recorded immediately. As can be seen in the Fig. 5a, the addition of Na2–EDTA ligand to the mixture of NDSM and Fe3+ caused almost complete recovery of the lost fluorescence, almost immediately, with previous intensity due to the formation of EDTA + Fe3+ complex and subsequent regeneration of the free NDSM. This “ON–OFF–ON” switching behavior at 531 nm of NDSM towards Fe3+ and EDTA can be repeated for about five times with very little loss in the initial emission intensity (Fig. 5b). This experiment suggests excellent reusability of the NDSM for the detection of Fe3+ via the addition of cheap and readily available EDTA ligand.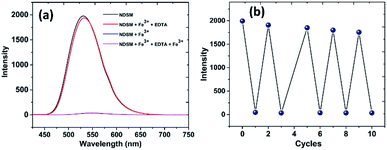 | ||
Fig. 5 (a) Fluorescence intensity responses of NDSM (2 × 10⁻⁵ M) in ACN-H2O medium (7![[thin space (1/6-em)]](https://www.rsc.org/images/entities/char_2009.gif) : :![[thin space (1/6-em)]](https://www.rsc.org/images/entities/char_2009.gif) 3 v/v) upon addition of Fe3+ + EDTA; (b) number of sequential detections of Fe3+ and EDTA. 3 v/v) upon addition of Fe3+ + EDTA; (b) number of sequential detections of Fe3+ and EDTA. | ||
Molecular logic gate behavior of NDSM
Inspired by the excellent reversible sensing behavior of NDSM towards Fe3+ and EDTA, we intended to construct a molecular logic gate. The emission sensitivity changes at 531 nm of NDSM in the presence of guest species (Fe3+ and EDTA) was taken as the output to design implication logic gate. The fluorescent probe as such remains in “turned-on” state as such and in the presence of EDTA which was considered as the ON mode (output = 1). While the fluorescence of NDSM turned-off entirely in the presence of Fe3+, it is regarded as OFF mode (output = 0). Based on this input, four possible input functions can be derived, such as (0, 0), (1, 0), (0, 1) and (1, 1) and the truth table is presented in the Fig. 6a condition (0, 0) is where none of the analytes (Fe3+, EDTA) is present, and the output signal is “0”. In the presence of input (Fe3+) to NDSM, the emission at 531 nm is quenched and leads to the function (1, 0) with output “0” whereas input EDTA leaves NDSM “turned-on” and function is represented as (0, 1) with output “1”. Finally, the simultaneous existence of both inputs (Fe3+ and EDTA), i.e. (1, 1), the emission at 531 is restored showing output signal “1”. Based on this, a logic gate was constructed, and it is shown in the Fig. 6b. With the IMPLICATION operation of NOT gate and OR gate, this designed logic circuit could convert two inputs (Fe3+, EDTA) into the output of NDSM fluorescence at 531 nm.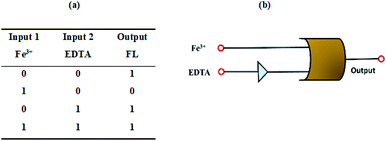 | ||
| Fig. 6 (a) Truth table (1 = on; 0 = off states). (b) Pictorial representation of logic gate with two input, Fe3+ and EDTA. | ||
Detection of Fe3+ by NDSM by paper-based array system
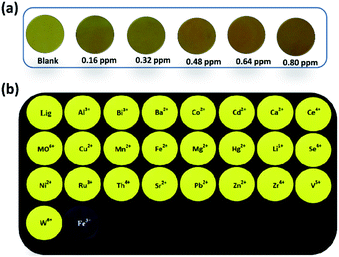
With the proven detection performance of NDSM in the solution state, the detection potential was also extended to the paper-based sensor. Whatman filter paper was facilely fabricated with NDSM by the drop-casting method. The naked eye observation in ambient sunlight indicated a golden yellow color. As can be seen in Fig. 7a, the golden yellow thickened over the instant exposure of Fe3+. The test strip became darker in color with the increasing concentration of Fe3+ (0.16–0.8 ppm). Notably, the test strips could produce a discernible response at concentration as low as 0.16 ppm. Visual detection was also monitored by exposing the test paper under a UV lamp (Ex = 365 nm). The fluorescence response of the filter paper was monitored by exposing different metal ions. As depicted in Fig. 7b, the bright yellow fluorescence of the paper strip was not affected by metal ions tested except Fe3+. Contact with Fe3+ has caused immediate quenching of the color in filter paper. Besides, the bright yellow fluorescence gradually faded away over the increasing concentration of Fe3+ and emission intensity inversely proportional to the concentration of Fe3+. These results demonstrate that NDSM can be used as a portable preliminary sensor platform for Fe3+.Application of NDSM in practical water analysis
To investigate the practical utility of NDSM, fluorescence detection of NDSM to Fe3+ was carried out in water samples collected from different water bodies of Vellore district. The collected water samples were spiked with the known concentrations of Fe3+, and their influence on the fluorescence of NDSM was analyzed by recording the emission intensity. Three successive measurements were carried out to detect the mean detection value of Fe3+. As can be shown in Table 1, the spiked concentration of Fe3+ has been detected with satisfactory recovery and relative stand deviation (R.S.D.). These results indicate NDSM can successfully detect with high selectivity and accurate quantification.| S. No. | Water samplesa | Fe3+ spiked (M) | Fe3+ found (M) | Recovery (%) | R.S.Db (n = 3) (%) |
|---|---|---|---|---|---|
a Water samples were collected from in and around VIT campus, Vellore.b relative standard deviation; conditions: 20.00 μM NDSM in mixed solution of CH3CN/river water (7![[thin space (1/6-em)]](https://www.rsc.org/images/entities/char_2009.gif) : :![[thin space (1/6-em)]](https://www.rsc.org/images/entities/char_2009.gif) 3). 3). |
|||||
| 1 | Tap water | 2 × 10⁻⁵ | 1.91 × 10⁻⁵ | 98.56 | 0.19 |
| 2 | Lake water | 2 × 10⁻⁵ | 1.95 × 10⁻⁵ | 98.81 | 0.35 |
| 3 | Well water | 2 × 10⁻⁵ | 1.93 × 10⁻⁵ | 97.91 | 0.21 |
| 4 | Mineral water | 2 × 10⁻⁵ | 1.96 × 10⁻⁵ | 98.81 | 1.03 |
| 5 | Distilled water | 2 × 10⁻⁵ | 1.93 × 10⁻⁵ | 98.46 | 0.28 |
| 6 | Purified water | 2 × 10⁻⁵ | 1.97 × 10⁻⁵ | 97.96 | 0.23 |
| 7 | Human serum albumin | 2 × 10⁻⁵ | 1.89 × 10⁻⁵ | 94.51 | 0.26 |
Fluorescent imaging of Fe3+ ions in E-coli cells
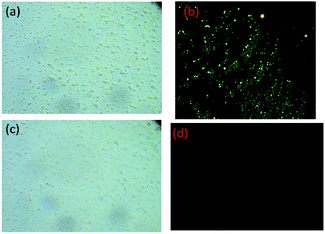
Cytotoxicity of NDSM was studied using red blood cells (RBC) by adding different concentrations of NDSM to RBC cell culture medium and incubated for about 24 h. The cell viability was found to be more than 95% at the NDSM concentration of 2 × 10⁻⁵ M, which indicates that cells can endure low concentration of NDSM for a long period. Hence, NDSM can be used for the bioimaging of Fe3+ in living cells. Accordingly, in vitro fluorescence imaging of Fe3+ was carried out by incubating NDSM (in DMSO/H2O (2![[thin space (1/6-em)]](https://www.rsc.org/images/entities/char_2009.gif) :
:![[thin space (1/6-em)]](https://www.rsc.org/images/entities/char_2009.gif) 8 v/v)) with E. coli cells buffered with Luria–Bertani medium and the imaging was carried out after 30 minutes. As can be seen in Fig. 8. E. coli cells incubated with NDSM showed clear and intense yellow color emission when visualized under fluorescence microscopy. Another set of E. coli cell incubated with NDSM was added and incubated with 10 μM Fe(NO3)3. Fluorescence imaging of these cells showed a yellow emission of NDSM, which was entirely quenched by Fe3+. Additionally, the brightfield image of Fe3+ treated cells showed the clear and intact appearance of cells which indicates the viability of the cells throughout the imaging experiment. Due to the negligible cytotoxicity, biocompatibility, cell permeability and conspicuous imaging of Fe3+, NDSM can be used to detect Fe3+ in living cells.
8 v/v)) with E. coli cells buffered with Luria–Bertani medium and the imaging was carried out after 30 minutes. As can be seen in Fig. 8. E. coli cells incubated with NDSM showed clear and intense yellow color emission when visualized under fluorescence microscopy. Another set of E. coli cell incubated with NDSM was added and incubated with 10 μM Fe(NO3)3. Fluorescence imaging of these cells showed a yellow emission of NDSM, which was entirely quenched by Fe3+. Additionally, the brightfield image of Fe3+ treated cells showed the clear and intact appearance of cells which indicates the viability of the cells throughout the imaging experiment. Due to the negligible cytotoxicity, biocompatibility, cell permeability and conspicuous imaging of Fe3+, NDSM can be used to detect Fe3+ in living cells.
Conclusions
In this work, we designed and synthesized 1,8-naphthalimide based Schiff base probe (NDSM) and confirmed its molecular structure by NMR, LC-MS and HRMS analysis. The synthesized probe was able to detect Fe3+ in the presence of various other competitive ions in the organic medium. NDSM, as such, is yellow in color and a bright yellow emitting compound. Concerted analysis of both absorption and emission spectra of NDSM in the presence Fe3+ revealed that NDSM could act as an efficient and economical optical probe for the selective detection of Fe3+. B–H and Job's plot analysis showed that there was 1![[thin space (1/6-em)]](https://www.rsc.org/images/entities/char_2009.gif) :
:![[thin space (1/6-em)]](https://www.rsc.org/images/entities/char_2009.gif) 1 complexation between NDSM and Fe3+. Optical response of NDSM towards Fe3+ was rapid. NDSM has very high sensitivity towards Fe3+ as evident from the very low LOD values (nanomolar range). IR and LC-MS analyses revealed that Fe3+ forms a complex with NDSM by coordinating with C
1 complexation between NDSM and Fe3+. Optical response of NDSM towards Fe3+ was rapid. NDSM has very high sensitivity towards Fe3+ as evident from the very low LOD values (nanomolar range). IR and LC-MS analyses revealed that Fe3+ forms a complex with NDSM by coordinating with C![[double bond, length as m-dash]](https://www.rsc.org/images/entities/char_e001.gif) N and –OH functional groups. The optical property of NDSM can be regenerated entirely from NDSM + Fe3+ with the addition of EDTA, and the reversible detection of Fe3+ can be realized several times. The potential real-time application of NDSM has been successfully demonstrated in various platforms, such as paper-based testing, analysis in different water bodies, molecular logic function and bioimaging analysis in E. coli. Therefore, NDSM can be used as a potential platform for the chromogenic and fluorogenic detection of Fe3+.
N and –OH functional groups. The optical property of NDSM can be regenerated entirely from NDSM + Fe3+ with the addition of EDTA, and the reversible detection of Fe3+ can be realized several times. The potential real-time application of NDSM has been successfully demonstrated in various platforms, such as paper-based testing, analysis in different water bodies, molecular logic function and bioimaging analysis in E. coli. Therefore, NDSM can be used as a potential platform for the chromogenic and fluorogenic detection of Fe3+.
Ethical statement
All the experiments, the results of which have been represented in the manuscript, were performed in compliance with relevant laws or guidelines by ICMR (Govt. of India).All the experiments, the results of which have been represented in the manuscript, have followed the institutional (VIT) guidelines.
Our application for approval is under the consideration of the Institutional Ethical Committee. A certificate from the Ethical Committee is also appended herewith.
An informed consent, as stipulated by the Institutional Ethical Committee, has been obtained from each of the volunteers before collecting the sample.
Conflicts of interest
There are no conflicts to declare.Acknowledgements
Dhanapal J and Sathish S thank VIT University for providing financial support through research associateship. SM gratefully acknowledges Youth 1000 Talent Program of China and Interdisciplinary Research Program of Hunan University. The DST-FIST NMR facility at VIT University is duly acknowledged. The authors thank Dr R. Srinivasan, SSL-VIT for language editing.Notes and references
- A. M. Brokesh and A. K. Gaharwar, ACS Appl. Mater. Interfaces, 2020, 12, 5319–5344 CrossRef CAS PubMed.
- D. Buccella, M. H. Lim and J. R. Morrow, Inorg. Chem., 2019, 58, 13505–13508 CrossRef CAS PubMed.
- Nat. Chem. Biol., 2008, 4, 143 Search PubMed.
- X. Huang, Mutat. Res., 2003, 533, 153–171 CrossRef CAS PubMed.
- D. Galaris, V. Skiada and A. Barbouti, Cancer Lett., 2008, 266, 21–29 CrossRef CAS PubMed.
- H. Kozlowski, M. Luczkowski, M. Remelli and D. Valensin, Coord. Chem. Rev., 2012, 256, 2129–2141 CrossRef CAS.
- P. Lesani, G. Singh, C. M. Viray, Y. Ramaswamy, D. M. Zhu, P. Kingshott, Z. Lu and H. Zreiqat, ACS Appl. Mater. Interfaces, 2020, 12, 18395–18406 CrossRef CAS PubMed.
- J. Li, L. Yang, Y. Ruan, S. Chu, H. Wang, Z. Li, C. Jiang, B. Liu, L. Yang and Z. Zhang, ACS Appl. Nano Mater., 2020, 3, 8224–8231 CrossRef CAS.
- S. Singh, J. K. Vaishnav and T. K. Mukherjee, ACS Appl. Nano Mater., 2020, 3, 3604–3612 CrossRef CAS.
- T. Boobalan, M. Sethupathi, N. Sengottuvelan, P. Kumar, P. Balaji, B. Gulyás, P. Padmanabhan, S. T. Selvan and A. Arun, ACS Appl. Nano Mater., 2020, 3, 5910–5919 CrossRef CAS.
- M. Xiao, Z. Liu, N. Xu, L. Jiang, M. Yang and C. Yi, ACS Sens., 2020, 5, 870–878 CrossRef CAS PubMed.
- S. Yu, W. Li, Y. Fujii, T. Omura and H. Minami, ACS Sustainable Chem. Eng., 2019, 7, 19157–19166 CrossRef CAS.
- F. Arshad and M. P. Sk, ACS Appl. Nano Mater., 2020, 3, 3044–3049 CrossRef CAS.
- A. Sarkar, A. Chakraborty, T. Chakraborty, S. Purkait, D. Samanta, S. Maity and D. Das, Inorg. Chem., 2020, 59, 9014–9028 CrossRef CAS PubMed.
- K. P. Carter, A. M. Young and A. E. Palmer, Chem. Rev., 2014, 114, 4564–4601 CrossRef CAS PubMed.
- H. Xu, C. Zhu, Y. Chen, Y. Bai, Z. Han, S. Yao, Y. Jiao, H. Yuan, W. He and Z. Guo, Chem. Sci., 2020, 11, 11037–11041 RSC.
- S. A. A. Razavi and A. Morsali, Coord. Chem. Rev., 2020, 415, 213299 CrossRef CAS.
- A. Nain, Y. T. Tseng, Y. S. Lin, S. C. Wei, R. P. Mandal, B. Unnikrishnan, C. C. Huang, F. G. Tseng and H. T. Chang, Sens. Actuators, B, 2020, 321, 128539 CrossRef CAS.
- D. L. Ma, S. Y. Wong, T. S. Kang, H. P. Ng, Q. B. Han and C. H. Leung, Methods, 2019, 168, 3–17 CrossRef CAS PubMed.
- Y. Guo, L. Zhang, S. Zhang, Y. Yang, X. Chen and M. Zhang, Biosens. Bioelectron., 2015, 63, 61–71 CrossRef CAS PubMed.
- Z. Zhang, Z. Wei, F. Meng, J. Su, D. Chen, Z. Guo and H. Xing, Chem. - Eur. J., 2020, 26, 1661–1667 CrossRef CAS PubMed.
- Z. Shaghaghi and R. Rezanezhad, ChemistrySelect, 2018, 3, 5534–5540 CrossRef CAS.
- Z. Xu, L. Hu, J. Yuan, Y. Zhang, Y. Guo, Z. Jin, F. Long, Y. Long, H. Liang, S. Ruan and Y.-J. Zeng, Adv. Mater. Interfaces, 2020, 7, 1902075 CrossRef CAS.
- D. Dai, J. Yang, Y. Wang and Y.-W. Yang, Adv. Funct. Mater., 2021, 31(1), 2006168 CrossRef CAS.
- R. Kumar, P. Gahlyan, N. Yadav, M. Bhandari, R. Kakkar, M. Dalela and A. K. Prasad, Dyes Pigm., 2017, 147, 420–428 CrossRef CAS.
- X. Wu, S. Zhang, Q. Niu and T. Li, Tetrahedron Lett., 2016, 57, 3407–3411 CrossRef CAS.
- J. Shi and Z. Zhang, Inorg. Chim. Acta, 2020, 511, 119790 CrossRef CAS.
- R. Wei, Z. Wei, L. Sun, J. Z. Zhang, J. Liu, X. Ge and L. Shi, ACS Appl. Mater. Interfaces, 2016, 8, 400–410 CrossRef CAS PubMed.
- A. Shylaja, S. R. Rubina, S. S. Roja and R. R. Kumar, Dyes Pigm., 2020, 174, 108062 CrossRef CAS.
- J. Gao, Y. He, Y. Chen, D. Song, Y. Zhang, F. Qi, Z. Guo and W. He, Inorg. Chem., 2020, 59, 10920–10927 CrossRef CAS PubMed.
- Q. Yan, W. Liu, H. Wen, X. Zhibin and Z. Meng, ChemistrySelect, 2020, 5, 1878–1883 CrossRef CAS.
- P. Madhu, S. Ponnusamy and R. Sribalan, New J. Chem., 2019, 43, 11069–11081 RSC.
- Y. e. Yu, Y. Wang, H. Yan, J. Lu, H. Liu, Y. Li, S. Wang, D. Li, J. Dou, L. Yang and Z. Zhou, Inorg. Chem., 2020, 59, 3828–3837 CrossRef CAS PubMed.
- B. X. Shen and Y. Qian, ChemistrySelect, 2017, 2, 2406–2413 CrossRef CAS.
- R. S. Darole, D. B. Christopher Leslee, A. Mukherjee, R. G. Gonnade, S. Karuppannan and B. Senthilkumar, Appl. Organomet. Chem., 2020, 34, e5867 CrossRef CAS.
- Y. Zhang, Y. Feng, H. Guo, A. Abdurahman, X. Ai, Z. Zhang and M. Zhang, Asian J. Org. Chem., 2020, 9, 1081–1086 CrossRef CAS.
- K. Kaur, S. Chaudhary, S. Singh and S. K. Mehta, Sens. Actuators, B, 2016, 232, 396–401 CrossRef CAS.
- P. S. Nayab and M. Shkir, Sens. Actuators, B, 2017, 251, 951–957 CrossRef CAS.
- B. Zhao, T. Liu, Y. Fang, L. Wang, B. Song and Q. Deng, Tetrahedron Lett., 2016, 57, 4417–4423 CrossRef CAS.
- K. Thenmozhi and H. Jonnagaddala, Mater. Chem. Front., 2020, 4(5), 1471–1482 RSC.
- A. Han, H. Su, G. Xu, M. Khan and H. Li, RSC Adv., 2020, 10, 23372–23378 RSC.
- X. Zhu, Y. Duan, P. Li, H. Fan, T. Han and X. Huang, Anal. Methods, 2019, 11, 642–647 RSC.
- B. Li, J. Tian, D. Zhang and F. Tian, Luminescence, 2017, 32, 1567–1573 CrossRef CAS PubMed.
- X. Xia, D. Zhang, C. Fan and S. Pu, Appl. Organomet. Chem., 2020, 34, e5841 CrossRef CAS.
- H. Fang, N. Wang, L. Xie, P. Huang, K. Y. Deng and F. Y. Wu, Sens. Actuators, B, 2019, 294, 69–77 CrossRef CAS.
- X. He, W. Xiong, L. Zhang, C. Xu, J. Fan, Y. Qian, J. Wen, F. Ding and J. Shen, Dyes Pigm., 2020, 174, 108059 CrossRef CAS.
- L. Peng, Z. Zhou, X. Wang, R. Wei, K. Li, Y. Xiang and A. Tong, Anal. Chim. Acta, 2014, 829, 54–59 CrossRef CAS PubMed.
- H. F. Xie, C. J. Yu, Y. L. Huang, H. Xu, Q. L. Zhang, X. H. Sun, X. Feng and C. Redshaw, Mater. Chem. Front., 2020, 4, 1500–1506 RSC.
- S. K. Padhan, N. Murmu, S. Mahapatra, M. K. Dalai and S. N. Sahu, Mater. Chem. Front., 2019, 3, 2437–2447 RSC.
- N. Dey, A. Ali, M. Kamra and S. Bhattacharya, J. Mater. Chem. B, 2019, 7, 986–993 RSC.
- S. N. Ansari, A. K. Saini, P. Kumari and S. M. Mobin, Inorg. Chem. Front., 2019, 6, 736–745 RSC.
- S. Gharami, K. Aich, D. Sarkar, P. Ghosh, N. Murmu and T. K. Mondal, New J. Chem., 2019, 43, 1857–1863 RSC.
- P. Karmakar, S. Manna, S. S. Ali, U. N. Guria, R. Sarkar, P. Datta, D. Mandal and A. K. Mahapatra, New J. Chem., 2018, 42, 76–84 RSC.
- D. Y. Patil, A. A. Patil, N. B. Khadke and A. V. Borhade, Inorg. Chim. Acta, 2019, 492, 167–176 CrossRef CAS.
- Q. Yu, X. Zhang, S. T. Wu, H. Chen, Q. L. Zhang, H. Xu, Y. L. Huang, B. X. Zhu and X. L. Ni, Chem. Commun., 2020, 56, 2304–2307 RSC.
- A. Finelli, V. Chabert, N. Hérault, A. Crochet, C. Kim and K. M. Fromm, Inorg. Chem., 2019, 58, 13796–13806 CrossRef CAS PubMed.
- M. S. H. Faizi, S. Gupta, V. Mohan K, V. K. Jain and P. Sen, Sens. Actuators, B, 2016, 222, 15–20 CrossRef CAS.
- S. Jena, P. Dhanalakshmi, G. Bano and P. Thilagar, J. Phys. Chem. B, 2020, 124, 5393–5406 CrossRef CAS PubMed.
- G. Hu, H. Jia, Y. Hou, X. Han, L. Gan, J. Si, D. H. Cho, H. Zhang and J. Fang, Anal. Chem., 2020, 92, 4371–4378 CrossRef CAS PubMed.
- A. Podder, V. P. Murali, S. Deepika, A. Dhamija, S. Biswas, K. K. Maiti and S. Bhuniya, Anal. Chem., 2020, 92, 12356–12362 CrossRef CAS PubMed.
- A. M. Koorts and M. Viljoen, Arch. Physiol. Biochem., 2007, 113, 30–54 CrossRef CAS PubMed.
- W. Xu, T. Barrientos and N. C. Andrews, Cell Metab., 2013, 17, 319–328 CrossRef CAS PubMed.
- D. R. Richardson, D. J. R. Lane, E. M. Becker, M. L. H. Huang, M. Whitnall, Y. S. Rahmanto, A. D. Sheftel and P. Ponka, Proc. Natl. Acad. Sci. U. S. A., 2010, 107, 10775–10782 CrossRef CAS PubMed.
Footnote |
| † Electronic supplementary information (ESI) available. See DOI: 10.1039/d1ra00345c |
| This journal is © The Royal Society of Chemistry 2021 |

