 Open Access Article
The enhancement of ozone–liquid mass transfer performance in a PTFE hollow fiber membrane contactor using ultrasound as a catalyzer†
Bing Wang *ab,
Huan Zhanga,
Qingjie Mengc,
Hongyang Rena,
Mingyang Xionga and
Chunyang Gaoa
aSchool of Chemistry and Chemical Engineering, Southwest Petroleum University, Chengdu 610500, P. R. China. E-mail: wangb@swpu.edu.cn; Fax: +86 24 83037306; Tel: +86 28 83037300
bSichuan Provincial Key Laboratory of Environmental Pollution Prevention on Oil and Gas Fields and Environmental Safety, Chengdu 610500, P. R. China
cHade Oil and Gas Development Department, PetroChina Tarim Oilfield Company, Korla 841000, P. R. China
First published on 14th April 2021
Abstract
A comprehensive assessment of a polytetrafluoroethylene (PTFE) hollow fiber membrane contactor and ultrasound for intensifying ozone–liquid mass transfer was conducted simultaneously. The initial part of the study concentrates on the systematic analysis of the previous literature related to the reinforcement on the ozone–liquid mass transfer. In this paper, the introduction of a membrane contactor and ultrasound as a catalyzer that increased the mass transfer coefficient (KLa) may be partially attributed to the increase of the net surface area and the decrease of the mass transfer resistance, thus leading to the enhancement of the ozone mass transfer rate and acceleration of the ozone decomposition in solution. Results revealed that the maximum value of the KLa value was 0.7858 min−1 in the PTFE hollow fiber membrane contactor in the presence of the ultrasound, while only 0.5154 min−1 in a single ozone aeration at an intake flow of 300 L h−1, ozone dosage of 32.38 mg L−1 and operating temperature of 293.15 K. A 52.46% improvement of the KLa value was obtained in the presence of the ultrasound. In addition, the dosage of sodium chloride appeared to have a positive correlation with KLa, but a negative correlation with the concentration of dissolved ozone. The sulfolane destruction by ozonation, ultrasound and the combination between the ozonation and ultrasound were performed to further verify the enhancement of the ozone mass transfer performance. It has been established that the O3/US combined process was a promising method, giving the maximum degradation of sulfolane (96.5%) with the synergistic index as 2.41.
1. Introduction
It is well known that ozone has the characteristics of strong oxidation performance, environment protection and high effectiveness; it has also been widely observed and investigated for the wastewater treatment and ozone-based processes to improve the quality of water.1–3 The total reaction rate of the ozonation process can be affected by both the reaction kinetics and mass transfer coefficient (KLa).4 However, the main disadvantage of ozone is its low solubility and instability in aqueous solution, which limits the extent of its application. Ozonation processes are conventionally carried out by the gas bubble formation using ozone–water contactors, including porous diffusers, injector nozzles, bubble columns and venturi injectors.5–8 However, in those cases, ozone–liquid transport is a rate-limiting process due to the size and distribution of ozone bubbles.9 An alternative approach is to increase the ozone mass transfer from the gas phase to the liquid phase using membrane contactors.Membrane contactors act as a convenient barrier between the gas and water phases, and offer several advantages of higher gas–water contact area, higher efficiency of ozone dissolution, no foaming and low-energy demand. Because of their non-polar structure, polymeric membranes employed for gas–liquid membrane contacting offer the advantage of hydrophobicity to differing degrees. Hollow fiber configurations can be produced with small diameters of a few μm, thus achieving a very high specific internal membrane surface area. Porous membranes with ozone durability are used as ozone–water membrane contactors, such as polytetrafluoroethylene (PTFE), polyvinylidene-fluoride (PVDF), polyethylene (PE) and polyvinylfluoride (PVF). The ozone durability of the above membrane contactors obeys the order of PTFE > PVDF > PE > PVF.10 The commonly used porous membrane materials are PVDF and PTFE, both fluoropolymers, which show the strongest chemical stability among the polymer group, as the electronegativity of fluorine atoms and the absence of carbon double bonds in the structure prevent an ozone or OH-radical attack.11 However, previous studies indicate that PVDF is susceptible for material alterations, which may take place over time. Bamperng et al.10 treated dye solutions with ozone membrane contactors, and observed an ozone flux decline of 30% for PVDF membranes compared to PTFE over 16 h. For the PTFE membranes, no property changes over time have been reported. In addition, PTFE is characterized as the high melting point, low solubility, high thermal stability, low friction, and low surface energy.12,13 Thus, the PTFE hollow fiber membrane could be regarded as an ideal membrane contactor.
Another method of enhancing the mass transfer of ozone into solution is through the use of ultrasonic irradiation (US).14–17 In the past few years, ultrasonic irradiation has a broad prospect of application in the catalysis aspect.18–21 Ozone is decomposed thermolytically in the vapor phase of a cavitation bubble by sonolysis.22 When ozone bubbles enter the ultrasound system, the turbulence would reduce the liquid film thickness.23 Then, the KLa increases. In addition, one of the mechanical effects of ultrasound is the breakage of the ozone bubbles,14 which leads to the larger specific surface area. Therefore, the ozone mass transfer coefficient KLa would increase in the presence of ultrasonic irradiation. Furthermore, hydroxyl radicals will be produced in the vapour phase of the cavitation bubbles during the ultrasonic process.24
As a clean and environmentally friendly energy source, the demand for natural gas is on the rise. For example, the development of China's natural gas industry has made significant progress in recent years, driven by the increasing domestic demand and the soaring oil and natural gas prices abroad.25 Thus, the widespread use of sulfolane is all but inevitable. With the extensive application of sulfolane, it has been found in the overhaul wastewater. The most serious problems caused by large amounts of highly hazardous overhaul wastewater are generated by the sulfolane associated with the natural gas purification process, which lingers in the equipment, and then enters the effluent in the equipment maintenance period. Common symptoms of exposure to sulfolane are headache, nausea, tiredness, gastrointestinal upset, tremors, or convulsions. Furthermore, it can cause irritation of the eyes and skin allergies. Therefore, wastewater-containing sulfolane has become an environmental concern. Thus, it is of importance to explore efficient treatment processes for the removal of such pollutant.
The objectives of the present study were (a) to use ultrasound to improve the ozone–liquid mass transfer in the PTFE hollow fiber membrane contactor; (b) to analyze the enhancement mechanism of ozone mass transfer using ultrasound; (c) to evaluate the effect of operation parameters on the KLa value and dissolved ozone concentration, and (d) to investigate the synergistic effect between ultrasound and ozonation for removing sulfolane.
2. Overview of work done on the intensification of ozone–liquid mass transfer in recent years
Ozonation, as one of the effective advanced oxidation processes (AOPs), has been extensively used to remove refractory organics in wastewater. It is necessary to improve ozone–liquid mass transfer due to the relatively low solubility of ozone. Many interesting methods by vast scholars proposed for the enhancement of ozone–liquid mass transfer have been demonstrated in the recent past, and some of the recent investigations have been highlighted here to present a degree of confidence.Graça et al.26 investigated the ozone–water mass transfer enhancement in continuous mode using a macroscale oscillatory flow reactor provided with smooth periodic constrictions (OFR-SPC). The obtained results indicated that KLa increased with an increase in f (up to 4 Hz), x0 (up to 15 mm), and the gas flow rate (up to 150 N cm3 min−1). Sabelfeld and Geißen27 have studied the ozone mass transfer in a helically wounded hollow fiber membrane contactor, which is dependent on the operating conditions. In comparison, the high-ozone-dosage low-liquid velocities were favorable. Additionally, the mass transfer enhancement was related to the gas flow orthogonal to the helical wounded fibers at the fiber shell. The obtained results indicated that the helical structure of the hollow fibers of the ozone–liquid membrane contactor contributed to the high ozone flow rates and high ozone dissolved concentration, increasing the mass transfer coefficient. Ratnawati et al.28 studied the effect of the ozone-containing gas flow rate (over a range of 2–5 L min−1) and pH (over a range of 4–10) on the ozone mass transfer coefficient in a bubble column reactor. The obtained results indicated that a maximum KLa of 2.1 × 10⁻³ s−1 at pH 4 with a gas flow rate of 4 L min−1 was obtained. Stylianou et al.29 investigated the ozone transfer to water using a tubular hydrophobized a-Al2O3 membrane contactor. The pH and ozone concentration values played a significant role in the dissolved ozone concentration, while the temperature has relatively little effect on the measured ozone. Abdullah et al.30 studied the ozone–liquid mass transfer under semi-batch conditions in a bubble column, a baffled column and an oscillatory baffled reactor (OBR). The obtained results indicated that the ozone mass transfer efficiency increased from 57% using the baffled reactor to 92% with OBR when the liquid and gas superficial velocities were 0.3 and 3.4 cm s−1, respectively. Ren et al.4 investigated the effect of different superficial gas and liquid velocities on the overall liquid side volumetric mass transfer coefficient (kLα) in a novel microchannel reactor. As is well known, the reaction behavior of the multiphase reaction depends on the ozone mass transfer and the residence time in the microchannel. Kukuzaki et al.31 investigated the ozone transfer with tubular hydrophilic and hydrophobized Shirasu porous glass (SPG) membranes based on the ozone absorption into water. It has been reported that the fluorocarbon functional group of an organosilane compound modified the surface of the SPG membranes. A maximum overall mass transfer coefficient (KL) of 1.2 × 10⁻⁵ m s−1 was obtained for the 0.51 μm hydrophobized membrane. It can be observed that the KL value for the hydrophobized SPG membranes was much larger, as compared to that obtained for the hydrophilic membrane (2.1 × 10⁻⁶ m s−1). An enhanced turbulence at the surface of the membrane could contribute to the higher KL values. Gao et al.8 investigated the characteristics of the Karman contactor as an ozonation unit by measuring the volumetric mass transfer coefficient of ozone (KLa), gas hold-up (εG), and bubble size. It has been observed that increasing the gas and liquid flow rates significantly enhances the rates of ozone absorption, owing to the small bubbles produced by the Karman contactor. The augmentation of small bubbles has increased the interfacial area of the gas–liquid contact, leading to the increase of KLa. Although the Karman contactor was expensive compared with other conventional bubble columns, its performance was satisfactory due to the high performance. Intensification of the ozone mass transfer using a reactor has been reported by Mitani et al.32 This reactor was composed of a microporous stainless steel tubular gas diffuser, leading to a decrease in the gas bubble size and improvement in the overall mass transfer area. It was observed that as the liquid flow rate increased from 3.33 × 10⁻⁶ to 2.08 × 10⁻⁵ m3 s−1, the KLa value increased from 0.0223 to 0.316 s−1 in our system. In most studies, the gas flow rate had a positive influence on the ozone mass transfer coefficient. In contrast, the liquid flow rate was dominant in the rate of ozone mass transfer in this study. Farines et al.33 investigated the influence of the superficial gas and liquid velocities on the ozone mass transfer using a co-current upflow reactor filled with granular silica gel. It was found that the dissolved ozone concentration depends on the technological parameters and conditions of the reactor. At steady state, increasing the gas velocity yields the increase in both overall mass transfer coefficient and dissolved ozone concentration. Hsu et al.34 studied the ozone mass transfer from gaseous to solution using a new gas-inducing reactor. The effect of several operational parameters, namely agitation speed, superficial gas velocity, temperature and working liquid level on the ozone volumetric mass-transfer coefficient (KL,O3a), was investigated in a semi-batch system. The obtained experimental results indicated that an increase of the ozone volumetric mass-transfer coefficient could be attributed to the increase of the agitation speed, temperature, and superficial gas velocity. Jakubowski et al.35 studied the ozone mass transfer using a confined plunging liquid jet contactor (CPLJC). The overall volumetric mass transfer coefficient (KLa) plays an important in the ozone mass transfer performance of the CPLJC. It was observed that increasing the volumetric gas flow rate (QG) leads to an increase of the interfacial area (a), thus KLa. It has been reported that the KLa value was in the 0.301–0.474 (s−1) range.
Intensification of the ozone mass transfer using acoustic and hydrodynamic cavitations has been reported by Karamah et al.36 The effect of the application of acoustic cavitations, hydrodynamic cavitations, and the combination of acoustic and hydrodynamic cavitations on the ozone mass transfer was observed using four process schemes. The obtained results presented a synergistic effect between the hydrodynamic and acoustic cavitations to improve the ozone mass transfer. The enhancement of the acoustic cavitation was higher than that of the hydrodynamic cavitation. The enhancement effect by the ozone mass transfer decreased in the order of combination of the hydrodynamic cavitation, sonication and ozonation > combination of sonication and ozonation > combination of hydrodynamic cavitation and ozonation. For the combination of both types of cavitation and ozonation, the enhancement of the chemical effect of cavitation was 3.68 times the mechanical effects. Weavers and Hoffmann37 studied the sonolytic degradation of ozone using both closed and open continuous-flow systems in order to explore the influence of the mass transfer on the chemical reactivity under ultrasound. By measuring the mass transfer coefficient (KLa2), it was observed that the O3 mass transfer diffusing into the aqueous phase was increased. This can be explained in that the application of the ultrasonic waves improved the ozone–liquid mass transfer as a result of the sonolytic degradation of O3, producing a larger driving force to accelerate the dissolution of gaseous O3.
3. Experimental
3.1 Materials
The membrane contactors used in the present study were purchased from DD Water Group Co. (Zhejiang Province, China). Characterizations of the PTFE hollow fiber membrane contactors are as follows in Table 1 and Fig. S1.† The diameter distributions of the microbubbles were measured using the method described in the previous research.38 All chemicals used in this study were of analytical grade. Deionized water freshly prepared in the laboratory was used in all experiments.| Membrane contactor parameters | Value |
|---|---|
| Mean pore diameter [μm] | 0.22 |
| Porosity [%] | 83.8 |
| External diameter [mm] | 2.291 |
| Wall thickness [mm] | 0.453 |
| Contact angle [°] | 102.66 |
3.2 Experiment set-up
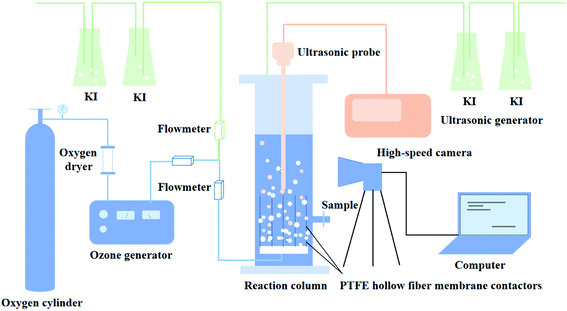
The experimental apparatus is constitutive of the membrane contactors and ultrasonic generation system, as shown in Fig. 1, which is made entirely of plexiglass (acrylic) with a breadth of 0.06 m, a depth of 0.06 m, and a height of 0.6 m. There were 20 membrane contactors, which were installed at the bottom of the reactor, and each PTFE hollow fiber membrane contactor was 150 mm in length. One end of the membrane contactor was positioned at the bottom of the reactor, and the other end was well sealed to ensure that ozone was introduced into the liquid phase through the membrane contactors.Ozone was produced from extra-dry and high-purity oxygen by using a CF-G-3-20 g generator (Qingdao Guolin, China). The flow rate of ozone was controlled by a rotameter incorporated into the ozone generator. Varying the electricity of the ozone generator regulated the gaseous ozone concentration, as could be seen in Table S1.† The ultrasonic probe connected with an ultrasonic generator (MS-ZDB, 20 kHz, Handan City Meishun Machinery Co., Ltd) was arranged at the top of the reactor. Dissolved ozone concentrations were measured by indigo method.39 The off-gas ozone leaving the reactor was trapped in gas absorption bottles containing 2% (w/v) KI solution. The pH value of the solution was buffered close to 3 by adding sulfuric acid solution, which depressed the ozone self-decomposition. The pH was determined using a pHS-3C meter.
One mL samples were taken at each interval, and were extracted with 1 mL dichloromethane. The analysis of the samples in dichloromethane was performed using an Agilent 6890 GC equipped with auto-sampler and Flame Ionization Detector (FID). The samples were injected to the GC, and chromatographic separation was made on a fused silica capillary column (ZB 5MSI, Phenomenex). High purity helium was used as the carrier gas with a head pressure of 250 kPa. The temperature of the injection port was set as 165 °C, and the injection was set on splitless mode with 5.00 μL injection volume. The initial temperature was set to 90, and then ramped to 175 °C with 10 °C min−1 rate, where it kept constant for 3 min. The FID detector temperature set at 250 °C.
Before the experimental operation, the reactor was pre-ozonated for 5 min to satisfy any ozone demand in the reactor, and then it was washed several times with distilled water to exclude any possible side effects.
3.3 Determination of KLa
The transformation rate of ozone into hydroxyl radicals is strongly pH-dependent. In principle, for pH < 7, this variable has a slight influence on the ozone decomposition. Therefore, the natural ozone self-decomposition can be neglected in this study (pH 3).The mass transfer coefficient (KLa) (min−1) in the ozonation process can be expressed as follows:
 | (1) |
In which r = 0, then eqn (1) can be further rewritten as:
 | (2) |
The slope of ln[Cs/(Cs − C)] against t is the KLa value.
4. Results and discussion
4.1 Effect of the operating parameters on the bubble size distribution
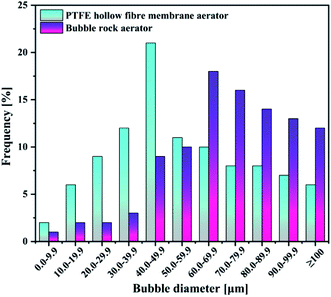
| Aeration patterns | PTFE hollow-fiber membrane | Bubble rock |
| Sauter mean radius [μm] | 52.78 | 86.25 |
The balance between the fluid shear stress and surface tension force in solution caused the bubbles to form. Thus, the single spherical bubble diameter can be estimated by eqn (3).40
 | (3) |
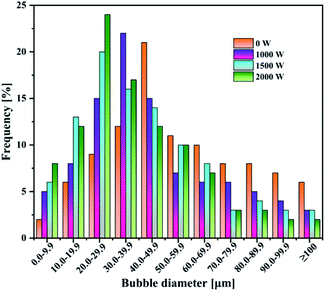
Under the same total ultrasonic frequency (20 kHz) input condition, the percentage of small bubbles was found to increase (Fig. 3), while the Sauter mean radius of the bubbles decreased from 50.78 to 30.49 μm with the increasing power operated from 0 to 2000 W. The motion of the bubbles in this system was in the presence of ultrasound. The size of the bubbles was mainly determined by the bubble coalescence and breakup behavior, and ultrasonic action. For the same system, the motion of the bubbles kept a balance between the bubble coalescence and breakup in the absence of ultrasound. However, a synthetic effect caused by such factors as cavitation effect, micro-jetting and turbulence has an obvious effect on the production of bubbles in the presence of ultrasound. These comprehensive effects destroyed the balance between the motion, growth, coalescence and breakup of the original bubbles, and caused much more violent turbulence in the gas–liquid two-phase flow to make more bubbles break up. Remarkably, the introduction of ultrasound decreased the mean radius of the bubbles (Table 3).
| Ultrasound power [W] | 0 | 1000 | 1500 | 2000 |
| Sauter mean radius [μm] | 52.78 | 35.62 | 32.81 | 30.49 |
4.2 Effects of operating parameters on the ozone mass transfer
| Aeration patterns | Dissolved ozone concentration (mg L−1) | KLa (min−1) |
|---|---|---|
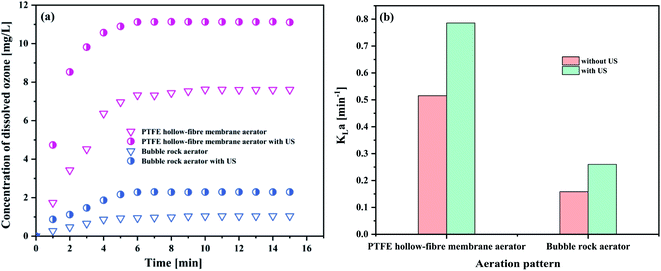
| PTFE hollow-fiber membrane aerator | 7.6093 | 0.5154 |
| PTFE hollow-fiber membrane aerator with US | 11.1071 | 0.7858 |
| Bubble rock aerator | 1.0472 | 0.1586 |
| Bubble rock aerator with US | 2.2964 | 0.2601 |
As evident in Fig. 4(a), the concentration of dissolved ozone in the PTFE hollow-fiber membrane aeration was significantly higher than that of bubble rock aeration. KLa followed the same trend as the concentration of dissolved ozone (Fig. 4(b)). From Section 4.1.1, it can be seen that the bubble size produced in the PTFE hollow-fiber membrane aeration (52.78 μm) was smaller than that of bubble rock aeration (86.25 μm). The smaller bubbles offer the higher interfacial area for the ozone–liquid contact, which favors the ozone mass transfer. It was found that the 0.7858 and 0.2601 min−1 of KLa were obtained by the PTFE hollow-fiber membrane aeration and bubble rock aeration, respectively. The PTFE hollow-fiber membrane aeration was over triple the KLa value of the bubble rock aeration. It could be concluded that the bubble size has a great influence on the ozone mass transfer.
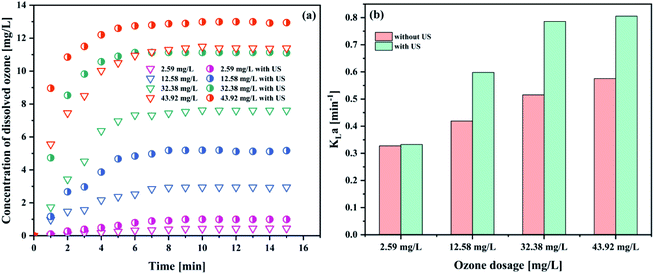 | ||
| Fig. 5 Effect of gaseous ozone concentration on (a) the concentration of dissolved ozone and (b) KLa (pH 3; intake flow rate 300 L h−1; temperature 293.15 K; US power 1000 W). | ||
| Gaseous ozone concentration | Dissolved ozone concentration (mg L−1) | KLa (min−1) |
|---|---|---|
| 2.59 mg L−1 | 0.4471 | 0.3273 |
| 2.59 mg L−1 with US | 0.9930 | 0.3328 |
| 12.58 mg L−1 | 2.9469 | 0.4187 |
| 12.58 mg L−1 with US | 5.1689 | 0.5980 |
| 32.38 mg L−1 | 7.6093 | 0.5154 |
| 32.38 mg L−1 with US | 11.1071 | 0.7858 |
| 43.92 mg L−1 | 11.3943 | 0.5755 |
| 43.92 mg L−1 with US | 12.9430 | 0.8053 |
As can be seen in Fig. 5(a), the concentration of dissolved ozone increased with increasing gaseous ozone concentration. The results indicated that an increase in the gaseous ozone concentration is beneficial to the mass transfer of ozone to some extent. An increase in the gaseous ozone concentration is expected to correspond with an increase in the equilibrium ozone concentration in solution, which can be explained by Henry's law,41
 | (4) |
An increase in the equilibrium ozone concentration could improve the ozone mass transfer driving force. The main driving force for ozone mass transfer is a concentration difference in the gas–liquid two-phase.29,31 It has been reported that ozone in the solution would reach saturation at a fixed temperature. Influenced by the dissolution, reaction and decomposition of ozone, the ozone concentration in solution would stop continually increasing when it was saturated at a fixed ozone input as the reaction time was prolonged and obtained a balance in solution. The ozone mass transfer from gas to liquid is mainly controlled by liquid film. This leads to the increase of KLa (Fig. 5(b)). It was observed that the introduction of ultrasound increased the KLa value to 0.7858 min−1, compared to 0.5154 min−1 of the ozonation in the absence of ultrasound in the PTFE hollow fiber membrane contactors, suggesting that the addition of ultrasound can contribute to the mass transfer of ozone dissolved into solution. Similar results have also been reported by Weavers et al.37 for the enhancement of ozone mass transfer using ultrasound. The local turbulence created by ultrasonic cavitation helps to decrease the mass transfer resistance for the ozone–liquid transfer.42 Considering the energy consumption and exhaust ozone, 32.38 mg L−1 was used for the following studies.
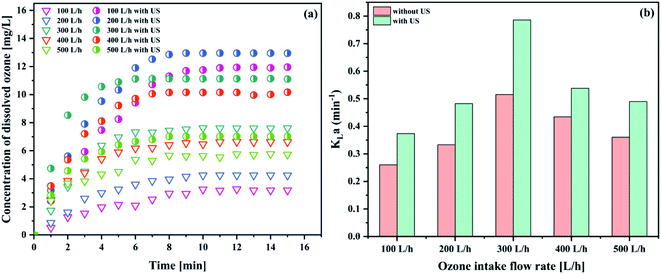 | ||
| Fig. 6 Effect of the intake flow rate on (a) the concentration of dissolved ozone and (b) KLa (pH 3; gaseous ozone concentration 32.38 mg L−1; temperature 293.15 K; US power 1000 W). | ||
| Intake flow rate | Dissolved ozone concentration (mg L−1) | KLa (min−1) |
|---|---|---|
| 100 L h−1 | 3.1798 | 0.2602 |
| 100 L h−1 with US | 11.9565 | 0.3738 |
| 200 L h−1 | 4.2491 | 0.3332 |
| 200 L h−1 with US | 12.9491 | 0.4825 |
| 300 L h−1 | 7.6093 | 0.5154 |
| 300 L h−1 with US | 11.1071 | 0.7858 |
| 400 L h−1 | 6.6267 | 0.4343 |
| 400 L h−1 with US | 10.1673 | 0.5381 |
| 500 L h−1 | 5.7404 | 0.3604 |
| 500 L h−1 with US | 7.0174 | 0.4900 |
As can be seen in Fig. 6(a), the equilibrium ozone concentrations increased with an increase in the intake flow rate, ranging from 100 L h−1 to 300 L h−1 and 100 L h−1 to 200 L h−1 in both ozone system and the combination between ozone and ultrasound system, respectively. Similar results were reported in the literature.38 In contrast, the KLa value increased first and then gradually decreased (see Fig. 6(b)). The maximum KLa value reached (0.7858 min−1) was higher than that of the condition without ultrasound (0.5154 min−1). A 52.5% improvement of the KLa value was obtained with the introduction of ultrasound, indicating that ultrasound could promote the mass transfer performance. Ultrasound appears to be a promising way to overcome the transfer limitations and improve the ozone mass transfer, compared to the same process without ultrasonication. It was observed that KLa increased due to the turbulence and surface renewal. Moreover, the rising velocity of the small ozone bubbles that produced the membrane contactors increased with the increasing intake flow rate. Thus, small bubbles were less likely to coalesce into larger bubbles. As is well known, the ozone mass transfer resistance was mainly controlled by the liquid phase. Increasing the intake flow rate caused a greater turbulence between the gas phase and the aqueous phase, which is conducive to the mixing of the gas–liquid two phases. It can be inferred that the faster ozone intake flow rate enhanced the mixing degree between the ozone–liquid two-phase, resulting in a decreased mass transfer resistance; thus, enhancing the ozone mass transfer coefficient. In contrast, the ozone intake flow rate was too fast to have enough time to collapse in the bulk solution, which caused the poor ozone mass transfer performance. Hence, based on the obtained results, the ozone intake flow rate of 300 L h−1 was used in the subsequent studies.
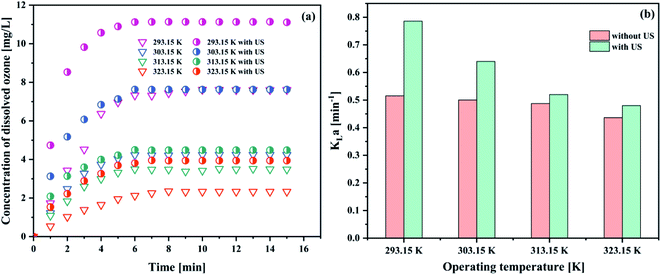 | ||
| Fig. 7 Effect of operating temperature on (a) the concentration of dissolved ozone and (b) KLa (pH 3; intake flow rate 300 L h−1; gaseous ozone concentration 32.38 mg L−1; US power 1000 W). | ||
| Operating temperature | Dissolved ozone concentration (mg L−1) | KLa (min−1) |
|---|---|---|
| 293.15 K | 7.6093 | 0.5154 |
| 293.15 K with US | 11.1071 | 0.7858 |
| 303.15 K | 4.2419 | 0.5002 |
| 303.15 K with US | 7.6242 | 0.6402 |
| 313.15 K | 3.4887 | 0.4875 |
| 313.15 K with US | 3.4845 | 0.5211 |
| 323.15 K | 2.3343 | 0.4364 |
| 323.15 K with US | 3.9435 | 0.4801 |
The results in Fig. 7(a and b) showed that the ozone equilibrium concentration and KLa in water decreased with the increase of the operating temperature in each system, indicating the increase of temperature against ozone mass transfer. Both ozone equilibrium concentration and KLa value could be boosted by the addition of ultrasound. The higher the temperature, the lower the ozone equilibrium concentration in solution. This phenomenon can be explained by Henry's constants (273–333 K):43
 | (5) |
The similar trends of the results were also reported in the literature.44–46 When the operation temperature increased from 293.15 to 323.15 K with the decrease of the dissolved ozone concentration, this caused the decrease of the ozone mass transfer driving force, and hence decreased KLa. It was found that with an increase in the temperature, the viscosity and/or surface tension decreased, resulting in a reduction of the cavitation intensity. Thus, the liquid phase resistance increased. Considering the obtained results and associated discussion, 293.15 K was established as the optimum operating temperature for further studies.
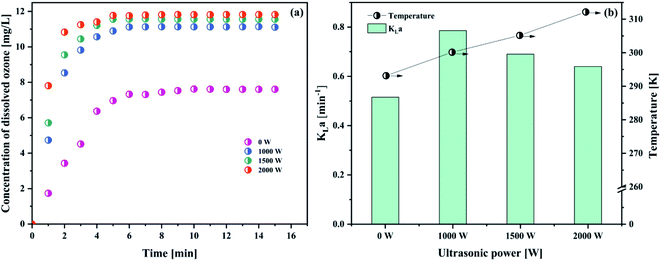
As observed in Fig. 8(a) and Table 8, it was demonstrated that increasing the ultrasonic power (from 1000 to 2000 W) has a positive effect on the dissolved ozone concentration. However, when the ultrasound power increases (from 1000 to 2000 W), the KLa value will decrease (from 0.7858 min−1 to 0.6400 min−1) (Fig. 8(b)). In the same condition, a blank test (ultrasonic power is 0) was also carried out.
| Ultrasonic powers | Dissolved ozone concentration (mg L−1) | KLa (min−1) |
|---|---|---|
| 0 W | 7.6093 | 0.5154 |
| 1000 W | 11.1071 | 0.7858 |
| 1500 W | 11.5598 | 0.6902 |
| 2000 W | 11.8260 | 0.6401 |
The result was attributed to the following reasons. On the one hand, ultrasound could create the mechanical effects, including a greater mixing and break up of the ozone bubble,14,37 which increased the specific surface area (seen Section 4.1.2). Tsochatzidis et al.49 reported that the increase of the input ultrasonic power at a constant ultrasound frequency increases the opportunity of the cavitation bubble collapse. The acoustic streaming accelerated the interfacial turbulence by cavitation bubbles collapse at the interface of the gas–liquid phase. Thus, the KLa value increased in the presence of ultrasound. On the contrary, when the ultrasound power reached a certain value, cavitation would tend to saturation. When the ultrasound power further increased, the cavitation bubbles would be too big to collapse, and an acoustic screen forms in this system. As a result, this led to a decrease in the KLa value. In addition, with higher ultrasound power, the temperature in solution would increase. As is well known, the higher temperature is very unfavourable for the solubility of ozone in water. Considering the obtained results and lower energy waste, the optimum ultrasonic power was 1000 W.
As could be seen from Fig. 9 and Table 9, the introduction of sodium chloride was negatively correlated with the concentration of dissolved ozone, and positively correlated with the KLa value. The highest KLa value was obtained with the dosage of NaCl of 1500 mg L−1 (1.1144 min−1). To the best of our knowledge, the addition of NaCl could decrease the gas solubility.51 However, the bubble diameter decreased with an increase in the salt concentration.52 Similar results were also reported by Walker et al.53 The increase of KLa attributed to the larger available gas–liquid interfacial area. On the one hand, the ionization of NaCl makes the production of vast quantities of charged ions in solution. The electrical adsorption of these ions enhanced the liquid film of the bubble. So, the coalescence of the bubbles was suppressed, causing the decrease of the bubble size.52 On the other hand, the presence of NaCl lowers the zeta potential of the bubble interface in water, thereby increasing the bubble stability in the system, leading to the decrease of the bubble size.54 In addition, the surface tension in the water increased with the increase in the concentration of NaCl solution. Furthermore, the bubble size decreases with increasing surface tension.55 These small bubbles in the system subsequently increase the net gas–liquid interfacial area. At the same time, a decrease in the bubble diameter prolongs the bubble residence time in liquids.52 This would increase the ozone mass transfer from the gas phase to the liquid phase.51 From the data obtained, it seems that the degree of increase in the mass transfer coefficient with an increase of the interfacial area is greater than the decrease caused by the decrease in ozone solubility due to the addition of NaCl. The KLa value increased with the NaCl concentration. Nevertheless, this is in disagreement with the results of other researchers, who showed that the changes in the surface tension exerted considerable influence on the bubble size, but it had no significant impact on the mass transfer.56 In short, the order-of-magnitude increase in the interfacial area at high salt concentration is the chief cause of the high KLa value.52 Therefore, the KLa value increases.
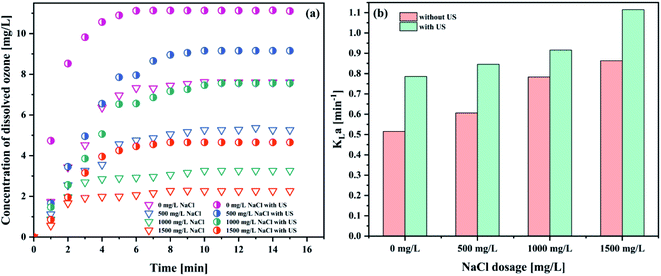 | ||
| Fig. 9 Effect of NaCl on (a) the concentration of dissolved ozone and (b) KLa (pH 3; intake flow rate 300 L h−1; gaseous ozone concentration 32.38 mg L−1; US power 1000 W; temperature 293.15 K). | ||
| NaCl concentrations | Dissolved ozone concentration (mg L−1) | KLa (min−1) |
|---|---|---|
| 0 mg L−1 | 7.6093 | 0.5154 |
| 0 mg L−1 with US | 11.1071 | 0.7858 |
| 500 mg L−1 | 5.2646 | 0.6065 |
| 500 mg L−1 with US | 9.1563 | 0.8457 |
| 1500 mg L−1 | 3.2598 | 0.7831 |
| 1500 mg L−1 with US | 7.5644 | 0.9158 |
| 2000 mg L−1 | 2.2661 | 0.8632 |
| 2000 mg L−1 with US | 4.6545 | 1.1144 |
4.3 Discussion on the enhancement mechanism
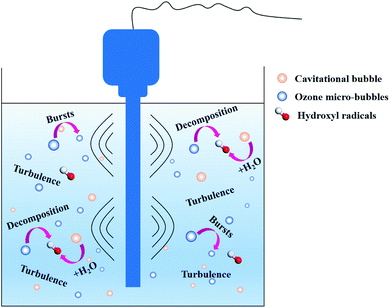
According to the comprehensive results obtained, the enhancement of the ozone mass transfer in aqueous medium increased with the introduction of ultrasound into the ozone system (Fig. 10). Ultrasonic cavitation bubbles were subjected to the surface tension, viscous force, inertia force and buoyancy in the fluid, and collapsed when the gas–liquid phase interface was precipitated. The periodic precipitation of these bubbles from the phase interface caused the local fluids near the gas–liquid interface to be periodically replaced, leading to the strong disturbance on the liquid surface and resulting in the deformation and turbulence of the phase interface, thus renewing the fluids on the interface surface. This is an important hydrodynamic instability phenomenon. The interfacial turbulence causes mass transfer in the form of convection, greatly reducing the mass transfer resistance. In addition, the contact area of ozone with water will be increased due to the ultrasound with the breakage of ozone bubbles, which can significantly enhance the whole dissolution process. Many ozone bubbles and cavitation bubbles previously existing in the solution became larger. When the size of the bubbles exceeded a certain value, the cavitation bubble and ozone bubbles encountered catastrophic collapse. The bubble radii become increasingly small. In addition, the cavitation bubbles gradually release energy through implosions to attack the ozone bubbles, making them easily decompose in the liquid. According to the note above, the ultrasound irradiation increased the mass transfer and decomposition of ozone.4.4 Removal efficiency of sulfolane in different processes
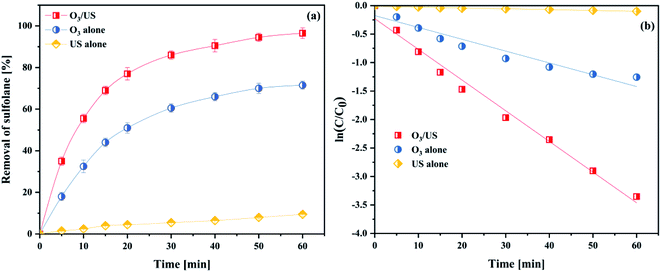
To further investigate the synergy of ultrasonic and ozone, we take sulfolane as the model pollutant and use the removal rate of sulfolane to be the targets, conducting the applied research to the oxidation capability in ozonation, ultrasound (US) and ozonation/ultrasound systems, respectively. The results are shown in Fig. 11(a). As shown in Fig. 11(a), the degradation effect of sulfolane obeyed the order of O3/US > O3 > US. About 96.5% of sulfolane was removed within 60 min, while only 9.5% of sulfolane was removed by US alone. From the kinetic analysis, it has been established that the sulfolane removal rate followed pseudo-first-order kinetics with trends being displayed in Fig. 11(b), and the obtained values of the kinetic rate constants are given in Table S2.†The introduction of ultrasound to ozonation further enhanced the sulfolane degradation, indicating that ultrasound increased the ozone mass transfer and accelerated the production of OH˙ in the ozonation process. The synergistic index (E) for the combined process of O3/US was calculated as follows:
 | (6) |
Considering the results of Table S2,† we obtained the rate constants for the combined process of ozonation, and found that it was 2.41 times higher than that of adding them independently for sonication and ozonation. This phenomenon illuminated a good synergistic effect between ultrasound and ozonation. With larger values of E, in particular, better synergistic effects were achieved.
5. Conclusions
The finding of the present study proved that ultrasound was a more favorable choice for the enhancement of ozone mass transfer than separate experiments involving only ultrasonic irradiation alone or single ozonation. The increase of ozone mass transfer in the presence of ultrasound may be partially attributed to (1) a reduction of the mass transfer resistance; (2) a larger contact area between ozone and liquid solution; (3) renewal of the fluids on the interface surface. It was obvious that the presence of ultrasound heightens KLa to 0.7858 min−1 compared to 0.5151 min−1 of the ozone system. The increase of KLa was derived from the increase of the ozone mass transfer and the acceleration of the ozone decomposition. The presence of NaCl in the liquid decreases the bubble size. It was also shown that the KLa value increases, and the concentration of dissolved ozone decreases with a higher concentration of NaCl. The destruction of sulfolane was further performed to investigate the enhancement of the ozone–liquid mass transfer in the PTFE hollow fiber membrane contactor in the presence of ultrasound. It was observed that the degradation efficiency of sulfolane by O3–US and O3/US follows the order of O3/US > O3 > US.Author contributions
Project administration, Bing Wang; writing-original draft preparation, Huan Zhang; writing-review and editing, Qingjie Meng and Hongyang Ren; comments and suggestions, Bing Wang; data curation, Mingyang Xiong and Chunyang Gao.Conflicts of interest
The authors declare no competing financial interests.Acknowledgements
This work was carried out with the financial support of the “Double First-Class” University Project from Southwest Petroleum University (2019cxzd028), and the Technology Innovation R&D Project of Chengdu (2019-YF05-00066-SN).References
- M. S. Kim, D. Cha, K. M. Lee, H. J. Lee, T. Kim and C. Lee, Water Res., 2020, 169, 115230 CrossRef CAS.
- W. Fan, W. G. An, M. X. Huo, W. Yang, S. Y. Zhu and S. S. Lin, Sep. Purif. Technol., 2020, 238, 116484 CrossRef CAS.
- Y. Huang, M. Liang, L. Ma, Y. Wang, D. Zhang and L. Li, Environ. Pollut., 2021, 268, 115722 CrossRef CAS PubMed.
- J. Ren, S. He, C. Ye, G. Chen and C. Sun, Chem. Eng. J., 2012, 210, 374–384 CrossRef CAS.
- X. Li, F. Ma, Y. Li, H. Zhang, J. Min, X. Zhang and H. Yao, Chem. Eng. J., 2020, 389, 124411 CrossRef CAS.
- S. Pathapati Srikanth, L. Mazzei Angelo, R. Jackson James, K. Overbeck Paul and P. Bennett Justin, Ozone: Sci. Eng., 2016, 38, 245–252 CrossRef.
- C. Shan, Y. Xu, M. Hua, M. Gu, Z. Yang, P. Wang, Z. Lu, W. Zhang and B. Pan, Chem. Eng. J., 2018, 338, 261–270 CrossRef CAS.
- M. T. Gao, M. Hirata and H. Takanashi, Sep. Purif. Technol., 2005, 42, 145–149 CrossRef CAS.
- A. A. Kulkarni, Ind. Eng. Chem. Res., 2007, 46, 2205–2211 CrossRef CAS.
- S. Bamperng, T. Suwannachart, S. Atchariyawut and R. Jiraratananon, Sep. Purif. Technol., 2010, 72, 186–193 CrossRef CAS.
- D. S. Pines, K. N. Min, S. J. Ergas and D. A. Reckhow, Ozone: Sci. Eng., 2005, 27, 209–217 CrossRef CAS.
- R. Shu, R. Shen and J. Liu, Eng. Failure Anal., 2021, 122, 105222 CrossRef CAS.
- Y. Sawae, T. Morita, K. Takeda, S. Onitsuka, J. Kaneuti, T. Yamaguchi and J. Sugimura, Tribol. Int., 2021, 106884 CrossRef CAS.
- S. A. Hewage, J. H. Batagoda and J. N. Meegoda, Environ. Eng. Sci., 2020, 38, 521–534 CrossRef.
- Q. Zhao, M. Li, K. Zhang, K. Wang, H. Wang, S. Meng and R. Mu, J. Environ. Manage., 2020, 262, 110356 CrossRef CAS PubMed.
- S. Chandak, P. K. Ghosh and P. R. Gogate, Process Saf. Environ. Prot., 2020, 137, 149–157 CrossRef CAS.
- V. V. Patil, P. R. Gogate, A. P. Bhat and P. K. Ghosh, Sep. Purif. Technol., 2020, 239, 116594 CrossRef CAS.
- Q. W. Gui, T. Fan, S. N. Ying, L. Yang, G. Tao, J. X. Tang, J. Y. Chen, C. Zhong and W. M. He, Chin. Chem. Lett., 2020, 31, 3241–3244 CrossRef CAS.
- W. Chao, L. H. Lu, A. Z. Peng, G. K. Jia, C. Peng, C. Zhong, Z. Tang, W. M. He and X. Xu, Green Chem., 2018, 20, 3683–3688 RSC.
- N. H. Ince, G. Tezcanli, R. K. Belen and G. Apikyan, Appl. Catal., B, 2001, 29, 167–176 CrossRef CAS.
- X. Xiong, B. Wang, W. Zhu, K. Tian and H. Zhang, Catalysts, 2018, 9, 678–688 CrossRef.
- A. Ziylan and N. H. Ince, Catal. Today, 2015, 240, 2–8 CrossRef CAS.
- Y. Shen, Q. Xu, R. Wei, J. Ma and Y. Wang, Ultrason. Sonochem., 2017, 38, 681–692 CrossRef CAS PubMed.
- X. Y. Ma, Y. Q. Cheng, Y. J. Ge, H. D. Wu, Q. S. Li, N. Y. Gao and J. Deng, Ultrason. Sonochem., 2018, 40, 763–772 CrossRef CAS PubMed.
- Z. Y. Wang, D. K. Luo and L. L. Liu, Energy Rep., 2018, 4, 351–356 CrossRef.
- C. A. L. Graça, R. B. Lima, M. F. R. Pereira, A. M. T. Silva and A. Ferreira, Chem. Eng. J., 2020, 389, 124412 CrossRef.
- M. Sabelfeld and S. Geißen, J. Membr. Sci., 2019, 574, 222–234 CrossRef CAS.
- R. Ratnawati, A. K. Dyah, S. Purbo and P. Aji, MATEC Web Conf., 2018, 156, 2015 CrossRef.
- S. K. Stylianou, M. Kostoglou and A. I. Zouboulis, Ind. Eng. Chem. Res., 2016, 28, 7587–7597 CrossRef.
- A. Abdullah, C. Paul, H. Adam and Z. Kui, Chem. Eng. Process., 2014, 84, 82–89 CrossRef.
- M. Kukuzaki, K. Fujimoto, S. Kai, K. Ohe, T. Oshima and Y. Baba, Sep. Purif. Technol., 2010, 72, 347–356 CrossRef CAS.
- M. M. Mitani, A. A. Keller, O. C. Sandall and R. G. Rinker, J. Environ. Eng., 2005, 27, 45–51 CAS.
- V. Farines, S. Baig, J. Albet, J. Molinier and C. Legay, Chem. Eng. J., 2003, 91, 67–73 CrossRef CAS.
- Y. C. Hsu, T. Y. Chen, J. H. Chen and C. W. Lay, Ind. Eng. Chem. Res., 2002, 41, 120–127 CrossRef CAS.
- C. A. Jakubowski, B. W. Atkinson, P. Dennis and G. M. Evans, Ozone: Sci. Eng., 2003, 1–12 CrossRef CAS.
- E. F. Karamah, B. Setijo and W. W. Purwanto, Ozone: Sci. Eng., 2013, 35, 482–488 CrossRef CAS.
- L. K. Weavers and M. R. Hoffmann, Environ. Sci. Technol., 1998, 32, 3941–3947 CrossRef CAS.
- B. Wang, X. Xiong, Y. Shui, Z. Huang and K. Tian, Chem. Eng. J., 2019, 375, 678–688 CrossRef.
- H. Bader and J. Hoigné, Water Res., 2013, 15, 449–456 CrossRef.
- S. E. Forresterc and C. D. Rielly, Chem. Eng. Sci., 1998, 53, 1517–1527 CrossRef.
- Y. Wang, H. Zhang, L. Chen, S. Wang and D. Zhang, Sep. Purif. Technol., 2012, 84, 138–146 CrossRef CAS.
- P. R. Gogate, S. Mededovic-Thagard, D. Mcguire, G. Chapas, J. Blackmon and R. Cathey, Ultrason. Sonochem., 2014, 21, 590–598 CrossRef CAS PubMed.
- E. Rischbieter, H. Stein and A. Schumpe, J. Chem. Eng. Data, 2013, 45, 338–340 CrossRef.
- R. H. Huang, H. H. Yan, L. S. Li, D. Y. Deng, Y. H. Shu and Q. Y. Zhang, Appl. Catal., B, 2011, 106, 264–271 CAS.
- M. Mehrjouei, S. Müller and D. Möller, Chem. Eng. J., 2015, 263, 209–219 CrossRef CAS.
- J. Wang and Z. Bai, Chem. Eng. J., 2017, 312, 79–98 CrossRef CAS.
- S. Raut-Jadhav, D. V. Pinjari, D. R. Saini, S. H. Sonawane and A. B. Pandit, Ultrason. Sonochem., 2016, 31, 135–142 CrossRef CAS PubMed.
- M. Mischopoulou, P. Naidis, S. Kalamaras, T. A. Kotsopoulos and P. Samaras, Renewable Energy, 2016, 96, 1078–1085 CrossRef CAS.
- N. A. Tsochatzidis, P. Guiraud, A. M. Wilhelm and H. Delmas, Chem. Eng. Sci., 2001, 56, 1831–1840 CrossRef CAS.
- J. D. Seymour and R. B. Gupta, Ind. Eng. Chem. Res., 1997, 36, 3453–3457 CrossRef CAS.
- K. Ajay, P. R. Gogate, A. B. Pandit, D. Henzi and W. A. Marie, Ind. Eng. Chem. Res., 2004, 43, 1812–1819 CrossRef.
- A. Kawahara, M. Sadatomi, F. Matsuyama, H. Matsuura, M. Tominaga and M. Noguchi, Exp. Therm. Fluid Sci., 2009, 33, 883–894 CrossRef CAS.
- A. B. Walker, C. Tsouris, D. W. Depaoli and K. Thomas Klasson, Ozone: Sci. Eng., 2001, 23, 77–87 CrossRef CAS.
- M. Takahashi, J. Phys. Chem. B, 2005, 109, 21858–21864 CrossRef CAS PubMed.
- M. Ramezani, M. J. Legg, A. Haghighat, Z. Li, R. D. Vigil and M. G. Olsen, Chem. Eng. J., 2017, 319, 288–296 CrossRef CAS.
- P. Kováts, D. Thévenin and K. Zhringer, Int. J. Multiphase Flow, 2019, 123, 103174 CrossRef.
Footnote |
| † Electronic supplementary information (ESI) available. See DOI: 10.1039/d1ra00452b |
| This journal is © The Royal Society of Chemistry 2021 |

