 Open Access Article
Well-dispersed Pt/RuO2-decorated mesoporous N-doped carbon as a hybrid electrocatalyst for Li–O2 batteries†
Hyun-Gi Jo ,
Kue-Ho Kim and
Hyo-Jin Ahn
 *
*
Department of Materials Science and Engineering, Seoul National University of Science and Technology, Seoul 01811, Korea. E-mail: hjahn@seoultech.ac.kr; Fax: +82029736657; Tel: +82029706622
First published on 26th March 2021
Abstract
Despite their high energy density, the poor cycling performance of lithium–oxygen (Li–O2) batteries limits their practical application. Therefore, to improve cycling performance, considerable attention has been paid to the development of an efficient electrocatalyst for the oxygen reduction reaction (ORR) and oxygen evolution reaction (OER). Catalysts that can more effectively reduce the overpotential and improve the cycling performance for the OER during charging are of particular interest. In this study, porous carbon derived from protein-based tofu was investigated as a catalyst support for the oxygen electrode (O2-electrode) of Li–O2 batteries, wherein ORR and OER occur. The porous carbon was synthesized using carbonization and KOH activation, and RuO2 and Pt electrocatalysts were introduced to improve the electrical conductivity and catalytic performance. The well-dispersed Pt/RuO2 electrocatalysts on the porous N-doped carbon support (Pt/RuO2@ACT) showed excellent ORR and OER catalytic activity. When incorporated into a Li–O2 battery, the Pt/RuO2@ACT O2-electrode exhibited a high specific discharge capacity (5724.1 mA h g−1 at 100 mA g−1), a low discharge–charge voltage gap (0.64 V at 2000 mA h g−1), and excellent cycling stability (43 cycles with a limit capacity of 1000 mA h g−1). We believe that the excellent performance of the Pt/RuO2@ACT electrocatalyst is promising for accelerating the commercialization of Li–O2 batteries.
1. Introduction
The rapid development of portable energy storage and conversion systems in recent years has triggered extensive research on next-generation batteries.1–4 Rechargeable lithium–oxygen (Li–O2) batteries are attracting significant interest for application in electric vehicles owing to their high energy density (∼3500 W h kg−1).5–7 Despite the remarkable advances in Li–O2 battery technology, high overpotentials during charging and low cycling stability limit their practical application.8,9 In particular, the poor cycling performance of Li–O2 batteries is due to a declining charge transfer rate and deterioration of catalytic activity caused by the accumulation of Li2O2 on the oxygen electrode (O2-electrode) during the oxygen reduction reaction (ORR), which occurs during discharge (2Li+ + O2 + 2e− → Li2O2), and oxygen evolution reaction (OER), which occurs during the charging process (Li2O2 → 2Li+ + O2 + 2e−).10 Consequently, a significant advantage is gained when the O2-electrode of Li–O2 batteries bears a modified surface carbon structure that accommodates Li2O2 accumulation during the discharge process. In addition, it is essential to reduce the overpotential during the charging process by improving the electrical conductivity within the electrode and OER catalytic activity.11 In recent studies, various carbonaceous materials, such as graphene, reduced graphene oxide (rGO), carbon nanotubes (CNTs), and carbon cloth (CT), have been used as catalyst supports to improve the charge transport and reaction product accommodation of O2-electrode in Li–O2 batteries.12–16 However, these carbon materials require complex syntheses, and therefore, they are expensive. Biomass-based carbon materials are promising alternatives for applications in battery catalyst supports owing to their easy availability and low cost. For example, carbon materials extracted from various biomaterials, such as water-soluble starch, plant peel, and fruits, have been utilized as catalyst supports for O2-electrodes of Li–O2 batteries.17–21In this study, protein-based tofu was investigated as a raw material for activated carbon for use as a catalyst support. The N-doped carbon surface arising from the amino acids of the protein and porous structure generated by KOH activation have previously been shown to enhance the performance of Li–O2 batteries.22 Noble metals and metal oxides, such as Au, Pt, Pd, RuO2, and IrO, are popular catalysts for Li–O2 batteries owing to their high ORR and OER activity.23–27 However, the combination of Pt/RuO2 electrocatalysts and biomass-based carbon materials as the O2-electrode of Li–O2 batteries has not been investigated yet. We found that the presence of well-dispersed Pt/RuO2 electrocatalysts within the porous N-doped carbon support significantly enhanced the catalytic activity for ORR and OER. In addition, the proposed O2-electrode showed a high specific discharge capacity, low discharge–charge overpotential, and excellent cycling stability. This study investigated a Pt/RuO2 electrocatalyst decorated on porous N-doped carbon for application in the O2-electrode of Li–O2 batteries and demonstrated the enhancement in electrochemical performance and cycling stability.
2. Experimental details
2.1 Synthesis of Pt/RuO2@ACT
The Pt/RuO2-decorated porous carbon composite derived from tofu (Pulmuone Co., Ltd) was synthesized using a sequential carbonization, activation, and chemical reduction procedure. The tofu was dried in an oven at 100 °C for 8 h to remove the moisture, and then, it was pyrolyzed at 400 °C for 2 h in air to remove impurities. The pyrolyzed tofu powder was cooled down to room temperature and immersed subsequently in the mixture solution of 1![[thin space (1/6-em)]](https://www.rsc.org/images/entities/char_2009.gif) :
:![[thin space (1/6-em)]](https://www.rsc.org/images/entities/char_2009.gif) 1 v/v ratio of HF/HNO3 for 12 h, in order to remove metal components and soluble trace elements. The intermediates were washed by deionized water thrice, and then, they were dried in an oven at 100 °C for 12 h. The resultant samples were ground in ethanol by planetary ball milling at 1000 rpm for 12 h. The crushed powder and potassium hydroxide (KOH, SAMCHUN) were mixed in a weight ratio of 1
1 v/v ratio of HF/HNO3 for 12 h, in order to remove metal components and soluble trace elements. The intermediates were washed by deionized water thrice, and then, they were dried in an oven at 100 °C for 12 h. The resultant samples were ground in ethanol by planetary ball milling at 1000 rpm for 12 h. The crushed powder and potassium hydroxide (KOH, SAMCHUN) were mixed in a weight ratio of 1![[thin space (1/6-em)]](https://www.rsc.org/images/entities/char_2009.gif) :
:![[thin space (1/6-em)]](https://www.rsc.org/images/entities/char_2009.gif) 4 (Wcarbon/WKOH), and then carbonized at 800 °C for 2 h in nitrogen gas (N2, 99.999%) for KOH activation. Finally, the activated carbon derived from tofu was washed with hydrochloric acid (HCL, SAMCHUN) and deionized (DI) water to remove the reaction residue and dried in an 80 °C oven. To obtain RuO2 composited carbon, the following procedure was followed: a 0.28 mM ruthenium(III) chloride hydrate (RuCl3·H2O, Aldrich) solution was prepared and added to the activated carbon dispersed in water. Then, sodium borohydride (NaBH4, Aldrich) solution (100 mg mL−1) was added to produce an Ru(0) nanoparticle coating on the activated carbon. After stirring for 30 min, the samples were dried in an oven at 50 °C for 12 h after washing with DI water. To oxidize Ru nanoparticles to RuO2, heat treatment was performed at 300 °C for 1 h in air. Finally, a sample of RuO2-bearing carbon powder was also decorated with Pt nanoparticles, using a similar reduction method with platinum chloride hydrate (PtCl4·H2O, Aldrich) to achieve a Pt loading of 10 wt%. Through this procedure, composite samples were synthesized from the activated carbon derived from tofu (ACT) with RuO2 (hereafter denoted as ACT, RuO2@ACT, and Pt/RuO2@ACT, respectively).
4 (Wcarbon/WKOH), and then carbonized at 800 °C for 2 h in nitrogen gas (N2, 99.999%) for KOH activation. Finally, the activated carbon derived from tofu was washed with hydrochloric acid (HCL, SAMCHUN) and deionized (DI) water to remove the reaction residue and dried in an 80 °C oven. To obtain RuO2 composited carbon, the following procedure was followed: a 0.28 mM ruthenium(III) chloride hydrate (RuCl3·H2O, Aldrich) solution was prepared and added to the activated carbon dispersed in water. Then, sodium borohydride (NaBH4, Aldrich) solution (100 mg mL−1) was added to produce an Ru(0) nanoparticle coating on the activated carbon. After stirring for 30 min, the samples were dried in an oven at 50 °C for 12 h after washing with DI water. To oxidize Ru nanoparticles to RuO2, heat treatment was performed at 300 °C for 1 h in air. Finally, a sample of RuO2-bearing carbon powder was also decorated with Pt nanoparticles, using a similar reduction method with platinum chloride hydrate (PtCl4·H2O, Aldrich) to achieve a Pt loading of 10 wt%. Through this procedure, composite samples were synthesized from the activated carbon derived from tofu (ACT) with RuO2 (hereafter denoted as ACT, RuO2@ACT, and Pt/RuO2@ACT, respectively).
2.2 Characterizations
The morphologies and structures of the two samples were observed using field emission scanning electron microscopy (FE-SEM, Hitachi SU-8010) and transmission electron microscopy (TEM, MULTI-TEM, Tecnai G2). The crystal structures of the samples were examined using a high-resolution X-ray diffractometer (HR-XRD, Rigaku D/MAX Uitima III) with Cu Kα radiation over the range of 10–90° and step size of 0.01°. The chemical bonding states of the samples were analyzed by X-ray photoelectron spectroscopy (XPS, VG Multilab2000) with an Al Kα radiation X-ray source in 10−9 Pa. All the XPS data were standardized to the C 1s core level (284.6 eV).2.3 Electrochemical measurements
The ORR and OER catalytic activities of the samples were measured using a potentiostat/galvanostat (PGST302N, Eco Chemie Autolab) with a rotating disk electrode. The three-electrode system comprised a working electrode (glassy carbon, 3 mm diameter), reference electrode (Ag/AgCl, sat. KCl), and a counter electrode (Pt wire) for electrochemical measurements. All the samples were prepared in ink with a mixture containing 5 mg of each catalyst dispersed in 1 mL of 1![[thin space (1/6-em)]](https://www.rsc.org/images/entities/char_2009.gif) :
:![[thin space (1/6-em)]](https://www.rsc.org/images/entities/char_2009.gif) 1 v/v ratio of water/isopropanol containing 50 μL of 5 wt% Nafion solution; this was done through sonication and dispersion for 3 days. The working electrode was prepared by homogeneous dispensing of 5 μL of catalyst ink solution, which was dropped onto the surface of glassy carbon (3 mm diameter) and dried in an oven at 50 °C for 30 min. For the ORR and OER tests, the electrolyte was prepared, i.e., 100 mL of 0.1 M KOH, which was purged with high-purity O2 gas for 1 h before conducting the electrochemical measurement. The linear sweep voltammetry (LSV) measurements were carried out in the potential range of 0.3–1.9 V (vs. RHE) at a scan rate of 5 mV s−1 with rotating electrode at 1600 rpm. The Li–O2 battery measurements of all the O2-electrodes were performed using a coin-type cell (CR2032, Hohsen Corporation). The coin cell consisted of a carbon O2-electrode as a cathode, Li metal foil (Honjo Chemical, 99.8%) as an anode, porous polypropylene membrane (Celgard 2400) as a separator, and 1.0 M lithium bis(trifluoromethanesulfonyl)imide (LiTFSI) in tetraethylene glycol dimethyl ether (TEGDME) as the electrolyte. The cathode was prepared using a mixture of active materials (ACT, RuO2@ACT, and Pt/RuO2@ACT) and Ketjenblack (KB, ECP-600JD, Mitsubishi Chemical) as conducting material and poly(vinylidenedifluoride) (PVDF, Alfa Aesar) as a binder. These were dissolved in a weight ratio of 7
1 v/v ratio of water/isopropanol containing 50 μL of 5 wt% Nafion solution; this was done through sonication and dispersion for 3 days. The working electrode was prepared by homogeneous dispensing of 5 μL of catalyst ink solution, which was dropped onto the surface of glassy carbon (3 mm diameter) and dried in an oven at 50 °C for 30 min. For the ORR and OER tests, the electrolyte was prepared, i.e., 100 mL of 0.1 M KOH, which was purged with high-purity O2 gas for 1 h before conducting the electrochemical measurement. The linear sweep voltammetry (LSV) measurements were carried out in the potential range of 0.3–1.9 V (vs. RHE) at a scan rate of 5 mV s−1 with rotating electrode at 1600 rpm. The Li–O2 battery measurements of all the O2-electrodes were performed using a coin-type cell (CR2032, Hohsen Corporation). The coin cell consisted of a carbon O2-electrode as a cathode, Li metal foil (Honjo Chemical, 99.8%) as an anode, porous polypropylene membrane (Celgard 2400) as a separator, and 1.0 M lithium bis(trifluoromethanesulfonyl)imide (LiTFSI) in tetraethylene glycol dimethyl ether (TEGDME) as the electrolyte. The cathode was prepared using a mixture of active materials (ACT, RuO2@ACT, and Pt/RuO2@ACT) and Ketjenblack (KB, ECP-600JD, Mitsubishi Chemical) as conducting material and poly(vinylidenedifluoride) (PVDF, Alfa Aesar) as a binder. These were dissolved in a weight ratio of 7![[thin space (1/6-em)]](https://www.rsc.org/images/entities/char_2009.gif) :
:![[thin space (1/6-em)]](https://www.rsc.org/images/entities/char_2009.gif) 1
1![[thin space (1/6-em)]](https://www.rsc.org/images/entities/char_2009.gif) :
:![[thin space (1/6-em)]](https://www.rsc.org/images/entities/char_2009.gif) 2 in N-methyl-2-pyrrolidinone (NMP, Aldrich) and the resulting mixture was spray-coated onto a Ni substrate (Nickel foam, MTI Korea) as a current collector. The coated cathode (O2-electrode) was dried in an oven at 100 °C for 12 h, and the loading amount was 1 ± 0.1 mg, excluding the Ni substrate. All the electrodes were assembled in a glove box filled with high-purity argon (99.999%), and the O2 and H2O contents were controlled to less than 10 ppm. The assembled cells were aged for 12 h in an O2-filled case prior to battery measurements. The charge–discharge tests were performed using a battery cycler system (WBCS3000S, WonATech) in the potential range of 2.0–4.5 V (vs. Li/Li+) in an O2-filled case at 25 °C. The cycling performances of the samples were measured for up to 50 cycles at a current density of 100 mA g−1 with a capacity of 1000 mA h g−1. The weight percent of the loaded catalysts is defined as the weight of the normalized catalysts to the weight of the electrocatalysts and carbon (Wcatalysts/Wcatalysts+C).
2 in N-methyl-2-pyrrolidinone (NMP, Aldrich) and the resulting mixture was spray-coated onto a Ni substrate (Nickel foam, MTI Korea) as a current collector. The coated cathode (O2-electrode) was dried in an oven at 100 °C for 12 h, and the loading amount was 1 ± 0.1 mg, excluding the Ni substrate. All the electrodes were assembled in a glove box filled with high-purity argon (99.999%), and the O2 and H2O contents were controlled to less than 10 ppm. The assembled cells were aged for 12 h in an O2-filled case prior to battery measurements. The charge–discharge tests were performed using a battery cycler system (WBCS3000S, WonATech) in the potential range of 2.0–4.5 V (vs. Li/Li+) in an O2-filled case at 25 °C. The cycling performances of the samples were measured for up to 50 cycles at a current density of 100 mA g−1 with a capacity of 1000 mA h g−1. The weight percent of the loaded catalysts is defined as the weight of the normalized catalysts to the weight of the electrocatalysts and carbon (Wcatalysts/Wcatalysts+C).
3. Results and discussion
Fig. 1 shows a schematic of the synthesis procedure for Pt/RuO2@ACT. First, dried tofu (Fig. 1(a)) was pyrolyzed at 400 °C to synthesize carbon derived from tofu (CT) (Fig. 1(b)). Then, the CT was crushed by planetary ball milling and KOH@CT was obtained using KOH immersion (Fig. 1(c)). As shown in Fig. 1(d), the CT (ACT) was converted to an activated mesoporous structure after KOH treatment, which is attributed to the reactions described by the following equations (eqn (1–3)).28| 6KOH + 2C → 2K + 3H2 + 2K2CO3 | (1) |
| K2CO3 → K2O + CO2 | (2) |
| CO2 + C → 2CO | (3) |
Fig. S1† shows the specific surface areas and pore volume diameter distributions of CT and ACT obtained from Brunauer–Emmett–Teller (BET) and Barrett–Joyner–Halenda (BJH) measurements. In Fig. S1(a),† the CT sample shows a type I BET isotherm of a bulk structure with only micropores. However, the ACT sample showed a type-IV isotherm, indicating the presence of mesopores at high N2 pressure (P/P0 > 0.45).22 Fig. S1(b)† shows the pore diameter distribution and pore volume of the CT and ACT samples obtained through BJH measurements. The specific surface areas (SBET) and total pore volumes (p/p0 = 0.990) of the CT and ACT samples were 393.7 m2 g−1 and 0.48 cm3 g−1 and 2241.6 m2 g−1 and 1.38 cm3 g−1, respectively, as shown in Table S1.†
To further verify the composition of ACT prepared from biomass tofu, elemental analysis was performed through inductively coupled plasma atomic emission spectrometry (ICP-AES) measurements. The samples were prepared using a microwave high pressure digestion system (Multiwave 7000) and the C, H, O, N, S, and P atoms after acid treatment were investigated.29 In Table S2,† the protein-based tofu containing amino acid was mainly comprised carbon (79.79 wt%) and showed high oxygen (O, 7.81 wt%) and nitrogen (N, 1.79 wt%) contents. Since sulfur (S, 0.14 wt%) and phosphorus (P, 0.01 wt%) were detected in a very small amount, it is difficult to estimate a major cause for doping and performance improvement of ACT.30,31 We also conducted 700 MHz nuclear magnetic resonance (NMR) to confirm the chemical bonding state of ACT. The 13C solid-state MAS NMR spectra showed broad peaks at 190, 130, and 80 ppm, coinciding with the common functional groups of ACT (Fig. S2†). The resonant peak at 180 ppm was assigned to carboxylic acid groups.32 The peak centered at approximately 130 ppm was assigned to sp2 hybridized aromatic networks with heteroatoms, implying N-doped carbon.33 The lower peaks between 70 and 90 ppm were attributed to sp3 carbon bonded to heteroatoms.34 Therefore, the 13C solid-state MAS NMR results showed that the decomposition of amino acid and alkyl chain results in the formation of N-doped carbon along with an aromatic system.35,36 Thus, we confirmed the characterization of N-doped carbon derived from protein-based tofu. To obtain uniformly loaded RuO2 electrocatalysts on the ACT, the Ru precursor was applied using a chemical reduction and calcination method (Fig. 1(e)).37 Finally, Fig. 1(f) describes the further addition of Pt nanoparticles and the high ORR and OER catalytic activities of the resulting Pt/RuO2@ACT.38
Fig. 2 shows low (a–d) and high-resolution (e–h) FE-SEM images of KB, ACT, RuO2@ACT, and Pt/RuO2@ACT, respectively. For KB (Fig. 2(a and e)), a dense and planar morphology with a particle size of 54.6–66.1 nm was observed. Fig. 2(b and f) presents the porous structure of ACT with a pore size of 375.9–452.4 nm, generated by KOH activation. The CT before KOH activation showed a semi-block morphology with particle sizes of 1.74–2.25 μm, as shown in Fig. S2.† The pores generated on the carbon surface significantly improved the reaction product (Li2O2) accommodation during the discharging process of Li–O2 batteries.39 Fig. 2(c and g) shows the RuO2 nanoparticles, which were loaded onto the ACT using a Ru chemical reduction and calcination method. The Pt/RuO2@ACT sample (Fig. 2(d and h)) displayed well-dispersed Pt nanoparticles decorated onto the RuO2@ACT.
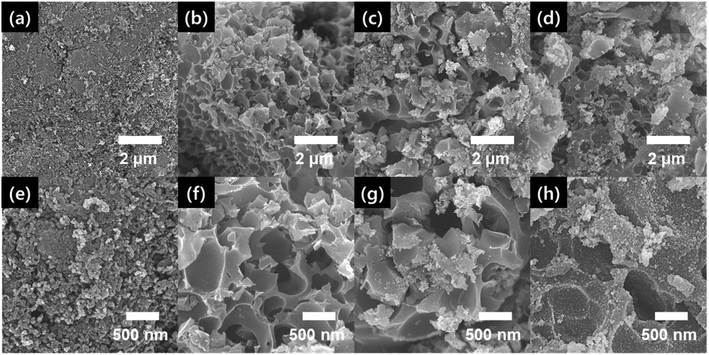 | ||
| Fig. 2 Low-resolution (a–d) and high-resolution (e–h) FESEM images of KB (a and e), ACT (b and f), RuO2@ACT (c and g), and Pt/RuO2@ACT (d and h). | ||
TEM and TEM-EDS analyses were performed to further investigate the structure and morphology of Pt/RuO2@ACT. Fig. 3 shows the low and high-resolution TEM and TEM-EDS mapping images of Pt/RuO2@ACT. As can be seen in Fig. 3(a), Pt/RuO2@ACT has a porous structure with pore size of 387−456 nm, coated with Pt and RuO2 nanoparticles. The high-resolution TEM image of Pt/RuO2@ACT showed well-distributed Pt/RuO2 catalyst nanoparticles on the surface of carbon support (Fig. 4(b)). As shown in Fig. S4(a),† uniform and well-dispersed RuO2 catalyst nanoparticles (22.8–27.2 nm in size) and Pt catalyst nanoparticles (5.6–6.1 nm in size) were observed. Fig. S4(b and c)† shows the lattice distance of 0.32 nm corresponding to the (110) plane of RuO2, and 0.227 and 0.198 nm corresponding to the (111) and (200) planes of Pt, respectively.38,40 Fig. 3(c) shows the TEM-EDS mapping results of C, N, Ru, and Pt on the surface of Pt/RuO2@ACT. The homogeneously distributed C and N indicate successful N-doping in the carbon structure from the amino acids present in the original tofu.41 The N-doping of carbon lattice can improve the electrical conductivity by providing p-electrons to the aromatic π-system and result in an increase in electron donor properties for electrocatalyst performance.38 TEM-EDS mapping also clearly identified the well-dispersed Pt and Ru nanoparticles on the porous carbon support, which can play an important role in determining the electrochemical discharge–charge properties of Li–O2 batteries.42 The presence of these well-dispersed Pt/RuO2 electrocatalysts on porous N-doped carbon did indeed result in an outstanding improvement in electrochemical performance.
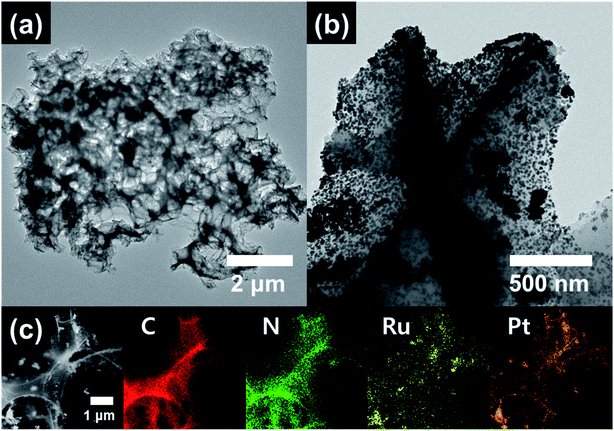 | ||
| Fig. 3 (a) Low- and (b) high-resolution TEM images and (c) TEM-EDS mapping images obtained from the Pt/RuO2@ACT. | ||
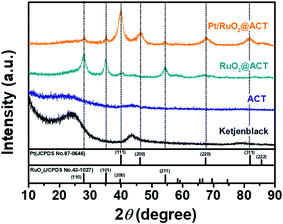
Fig. 4 shows the XRD patterns obtained to investigate the crystallinities of KB, ACT, RuO2@ACT, and Pt/RuO2@ACT. The KB and ACT showed two broad peaks at 24.5° and 43.7°, corresponding to the graphite (002) and (100) planes, respectively (JCPDS card number 41-1487).43 The main diffraction peaks of RuO2@ACT and Pt/RuO2 ACT were observed at 27.9°, 35.0°, 40.4°, and 54.2°, corresponding to the (110), (101), (200), and (211) planes of RuO2, respectively (JCPDS card number 43-1027).44 Pt/RuO2@ACT showed diffraction peaks at 39.9°, 46.2°, 67.8°, and 81.4°, corresponding to the (111), (200), (220), and (311) planes of metallic Pt phases, respectively (JCPDS card number 87-0646).38 To further analyze the chemical bonding state of Pt/RuO2@ACT, XPS measurements were performed, and the results are shown in Fig. 5.
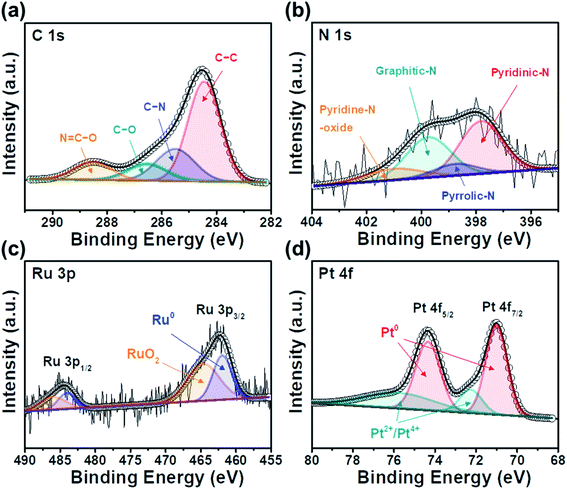
Fig. 5(a) shows four types of C 1s XPS core-level spectra, which are comprised C–C groups (284.5 eV), C–N groups (285.6 eV), C–O groups (286.4 eV), and N![[double bond, length as m-dash]](https://www.rsc.org/images/entities/char_e001.gif) C–O groups (288.5 eV), separated by deconvolution. The presence of peaks corresponding to the C–N, C–O, and N
C–O groups (288.5 eV), separated by deconvolution. The presence of peaks corresponding to the C–N, C–O, and N![[double bond, length as m-dash]](https://www.rsc.org/images/entities/char_e001.gif) C–O groups indicate that the C atoms of the C–C groups were replaced by N atoms, which is attributed to the surface functional groups of activated carbon.45 As shown in Fig. 5(b), the N 1s XPS profiles were divided into pyridinic-N (397.8 eV), pyrrolic-N (398.7 eV), graphitic-N (399.4 eV), and pyridine-N (401.2 eV). The observed N groups were generated from the amino acids of protein-based tofu.46 Pyridine-N and pyrrolic-N can provide p-electrons through an aromatic π system, thereby producing improved catalytic activity for carbon supports.47 Fig. 5(c) shows two doublet Ru 3p XPS core-level spectra, corresponding to Ru 3p3/2 and Ru 3p1/2. Peaks assigned to the metallic Ru groups (462.2 and 484.6 eV), which were deconvoluted from the higher energy components of RuO2 (464.3 and 486.1 eV), were observed, suggesting that the RuO2 phases are present in the Ru(IV) state.25,48 In addition, as shown in Fig. 5(d), the XPS core-level spectra of Pt 4f display two pairs of doublets for metallic Pt, corresponding to Pt 4f7/2 (70.1 eV) and Pt 4f5/2 (74.3 eV). The small doublets detected at 72.3 and 75.8 eV can be assigned to oxidized Pt species of PtO/Pt(OH)2, formed by reaction with water vapor and O2 in the air.49 These TEM, XRD, and XPS results demonstrate the successful synthesis of Pt/RuO2@ACT.
C–O groups indicate that the C atoms of the C–C groups were replaced by N atoms, which is attributed to the surface functional groups of activated carbon.45 As shown in Fig. 5(b), the N 1s XPS profiles were divided into pyridinic-N (397.8 eV), pyrrolic-N (398.7 eV), graphitic-N (399.4 eV), and pyridine-N (401.2 eV). The observed N groups were generated from the amino acids of protein-based tofu.46 Pyridine-N and pyrrolic-N can provide p-electrons through an aromatic π system, thereby producing improved catalytic activity for carbon supports.47 Fig. 5(c) shows two doublet Ru 3p XPS core-level spectra, corresponding to Ru 3p3/2 and Ru 3p1/2. Peaks assigned to the metallic Ru groups (462.2 and 484.6 eV), which were deconvoluted from the higher energy components of RuO2 (464.3 and 486.1 eV), were observed, suggesting that the RuO2 phases are present in the Ru(IV) state.25,48 In addition, as shown in Fig. 5(d), the XPS core-level spectra of Pt 4f display two pairs of doublets for metallic Pt, corresponding to Pt 4f7/2 (70.1 eV) and Pt 4f5/2 (74.3 eV). The small doublets detected at 72.3 and 75.8 eV can be assigned to oxidized Pt species of PtO/Pt(OH)2, formed by reaction with water vapor and O2 in the air.49 These TEM, XRD, and XPS results demonstrate the successful synthesis of Pt/RuO2@ACT.
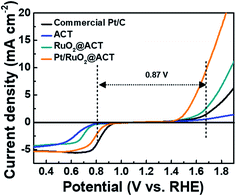
To investigate the electrochemical catalytic activities of the ACT, RuO2@ACT, and Pt/RuO2@ACT electrodes, LSV measurements were carried out (Fig. 6). In addition, a commercial Pt/C catalyst (20 wt% Pt on Vulcan XC-72R, E-TEK Co.) was used for comparison with the prepared electrode. In the region of the ORR polarization curve, Pt/RuO2@ACT shows an improved onset potential (Eonset) of 0.923 V, half-wave potential (E1/2) of 0.805 V, and limiting current density of −5.222 mA cm−2, which are comparable to those of the commercial Pt/C (Eonset of 0.948 V, E1/2 of 0.831 V, and limiting current density of −5.233 mA cm−2), as shown in Fig. S5.† In the OER polarization curves, the Pt/RuO2@ACT electrode showed a much higher OER catalytic activity than that shown by the other samples. This is likely because the excellent electrical conductivity of RuO2 and the well-dispersed Pt catalyst efficiently transports the electrons owing to a facilitated oxygen reaction in the N-doped activated carbon support.38 In contrast, the commercial Pt/C electrode exhibited poor OER catalytic activity, and the ACT electrode showed inactivity under the same conditions. During the discharge–charge process of Li–O2 batteries, the ORR and OER electrochemical kinetics are crucial; they are generally evaluated by the potential gap (EOER-ORR) between OER (at 10 mA cm−2) and ORR (at −2 mA cm−2).50 The Pt/RuO2@ACT electrode showed a potential gap of 0.87 V, which identifies it as a promising cathode candidate for high-performance Li–O2 batteries.51–53 Pt/RuO2@ACT O2-electrode was prepared using a spray coating method on Ni-mesh for Li–O2 batteries (Fig. S6(a–c)†).54,55 The structural and chemical properties of Pt/RuO2@ACT can induce excellent performance in the generation and decomposition of Li2O2 during the discharge–charge process.
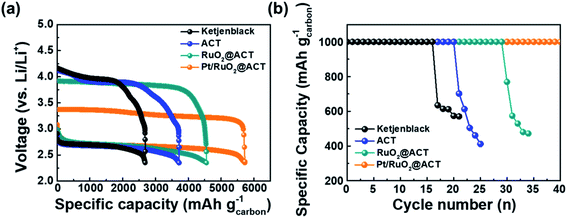
Fig. 7 shows the galvanostatic discharge–charge profiles and cyclability performance of KB, ACT, RuO2@ACT, and Pt/RuO2@ACT electrodes. The initial discharge–charge curves of the O2-electrodes between 2.35 and 4.35 V at a current density of 100 mA g−1 are shown in Fig. 7(a). The Pt/RuO2@ACT exhibited a much higher initial reversible specific capacity of 5724.1 mA h g−1 than those exhibited by KB (2686.8 mA h g−1), ACT (3716.5 mA h g−1), and RuO2@ACT (4556.8 mA h g−1). The discharge curves of all O2-electrodes showed similar discharging potentials (2.7 V vs. Li/Li+). However, the charge curves of RuO2@ACT and Pt/RuO2@ACT showed lower charging potentials than those showed by KB and ACT. In particular, Pt/RuO2@ACT showed the lowest charging potential range of 3.2–3.4 V, as well as a narrow discharge–charge voltage gap (0.64 V at 2000 mA h g−1) between the ORR and OER activities. This result may be attributed to the excellent ORR and OER catalytic activity of Pt/RuO2@ACT, which facilitates the decomposition of Li2O2 during the charging process.24 The cyclic stability of O2-electrodes was evaluated between 2.0 and 4.5 V at a current density of 100 mA g−1 under a specific capacity limit of 1000 mA h g−1 (Fig. 7(b)). The Pt/RuO2@ACT electrode exhibited excellent stability for over 40 cycles during the discharge–charge retention test than those exhibited by KB (16 cycles), ACT (20 cycles), and RuO2@ACT (29 cycles) electrodes. After the retention cycles, the reaction products (Li2O2) were not completely decomposed and therefore accumulated on the O2-electrode surface, reducing the electrical conductivity of the cathode.56 Thereafter, the ORR and OER catalytic activities were impaired, resulting in a sharp decrease in the specific capacity.
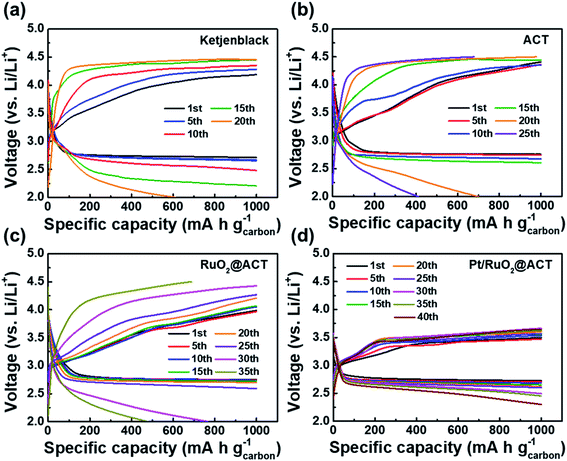
Fig. 8 shows the discharge–charge profiles of O2-electrodes under a specific capacity limitation of 1000 mA h g−1 at the 1st, 5th, 10th, 15th, 20th, 25th, 30th, 35th, and 40th cycles. As shown in Fig. 8(a), the KB O2-electrode maintained a stable discharge–charge voltage gap over 5 cycles. However, the charge overpotential gradually increased after 10 cycles, resulting in a sharp decrease in the specific capacity after 15 cycles. The ACT–O2-electrode exhibited a stable discharge–charge voltage gap up to 15 cycles, likely due to the increased surface area from the KOH activation process (Fig. 8(b)). However, the OER overpotential during the charging process rapidly increased after 15 cycles, resulting in a decreased specific capacity of 701.1 mA h g−1 for the 20th cycle. The RuO2@ACT O2-electrode showed a stable cycling performance up to 25 cycles with a constant voltage gap (Fig. 8(c)). This result can be attributed to the excellent OER catalytic activity of surface-coated RuO2, which can contribute to the decomposition of Li2O2.57 The Pt/RuO2@ACT O2-electrode exhibited excellent cycle stability up to 40 cycles and displayed the lowest discharge–charge voltage gap among all the samples (Fig. 8(d)). This long-term discharge–charge reversibility may be attributed to the well-dispersed Pt electrocatalyst, improving the OER activity of RuO2@ACT during the charging process.58 The Pt/RuO2@ACT electrode displayed enhanced round-trip cycling performance compared to the other electrodes, owing to the synergistic effect of high electrical conductivity and catalytic activity.
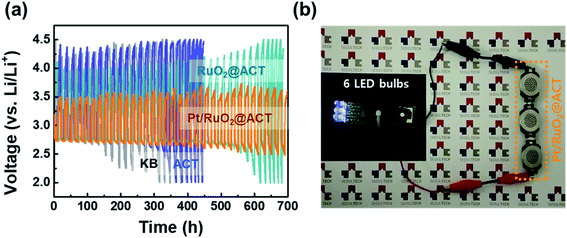
The discharge–charge reversibility of Li–O2 batteries is related to the voltage gap increment in the O2-electrodes during cycling performance. Fig. 9(a) shows the voltage (V) vs. time (h) profiles to evaluate the ohmic resistance of all the samples. The Pt/RuO2@ACT O2-electrode maintained a discharge–charge voltage gap up to 700 h, which demonstrates its superior cycling performance compared with KB, ACT, and RuO2@ACT electrodes. It was also found that the Pt/RuO2@ACT O2-electrode achieved at least 40 cycles in the Li–O2 batteries without unwanted irreversible reactions.59 Fig. S7(a and f)† show the pristine states of the KB and Pt/RuO2@ACT O2-electrodes, which show the uniformly loaded active materials onto the Ni foam. During the first discharge, the Li2O2 products were precipitated, covering the O2 electrode, and did not disappear completely after the subsequent charge process (see Fig. S7(c)†). After 20 cycles of discharge–charge, completely closed pores of the KB O2-electrode were visible, which induced critical degradation of Li–O2 battery operation. These results resulted in the low discharge/charge efficiency during the cycling of the KB O2-electrode and the low cycle stability of 15 cycles. Conversely, the Pt/RuO2 O2-electrode enabled the reversible formation and decomposition of Li2O2 after discharge and subsequent charge reactions. As shown in Fig. S7(i and j),† the Pt/RuO2@ACT O2-electrode exhibited a stable electrode structure after 20 cycles and did not close the pores of the O2-electrode. These results demonstrate the stable structure of Pt/RuO2@ACT O2-electrode, even after the long-term stability test.60–62 To demonstrate the practical applicability of Pt/RuO2@ACT Li–O2 batteries in commercial electronic devices, manufactured Li–O2 batteries were used as a power source (Fig. 9(b)). The outstanding electrochemical performance of the novel Pt/RuO2@ACT O2-electrode can be explained by the following factors. (i) The porous N-doped carbon extracted from protein-based tofu increased the electron distribution and the accommodation of reaction products (Li2O2). (ii) The high electrical conductivity of RuO2 contributed to the fast electron transfer during the discharge–charge processes. (iii) The well-dispersed Pt electrocatalyst nanoparticles produce a stable discharge–charge voltage gap owing to their excellent ORR and OER catalytic activity. Because of these properties, the Pt/RuO2@ACT O2-electrode is a promising candidate for Li–O2 batteries, with enhanced oxygen reaction catalyst performance.
4. Conclusion
Herein, Pt/RuO2@ACT was synthesized from tofu by carbonization and KOH activation followed by a catalytic reduction reaction process and was used as an O2-cathode catalyst for non-aqueous Li–O2 batteries. The well-dispersed Pt/RuO2 electrocatalysts on porous N-doped carbon exhibited superior catalytic activity than those exhibited by other catalysts for the ORR and OER (0.96 V at EOER-ORR). In addition, the Pt/RuO2@ACT O2-electrodes were incorporated into Li–O2 batteries and showed a high specific discharge capacity (5724.1 mA h g−1 at 100 mA g−1), low discharge–charge voltage gap (0.64 V at 2000 mA h g−1), and excellent cycling stability (43 cycles with a limit capacity of 1000 mA h g−1). This performance enhancement can be attributed to the high electrical conductivity and catalytic activity of well-dispersed Pt with RuO2 decorated onto porous N-doped carbon. This novel Pt/RuO2@ACT O2-electrode with excellent oxygen catalytic activity is a promising candidate for the improvement of Li–O2 batteries.Conflicts of interest
There are no conflicts to declare.Acknowledgements
This work was supported by the National Research Foundation of Korea (NRF) grant funded by the Korea government (MSIT) (No. 2019R1A2C1005836).References
- Z. Peng, S. A. Freunberger, Y. Chen and P. G. Bruce, Science, 2012, 337, 563–566 CrossRef CAS PubMed
.
- D. Aurbach, B. D. McCloskey, L. F. Nazar and P. G. Bruce, Nat. Energy, 2016, 1, 16128 CrossRef CAS
.
- D. Geng, N. Ding, T. S. A. Hor, S. W. Chien, Z. Liu, D. Wuu, X. Sun and Y. Zong, Adv. Energy Mater., 2016, 6, 1502164 CrossRef
.
- G. Girishkumar, B. McCloskey, A. C. Luntz, S. Swanson and W. Wilcke, J. Phys. Chem. Lett., 2010, 1, 2193–2203 CrossRef CAS
.
- N. Feng, P. He and H. Zhou, Adv. Energy Mater., 2016, 6, 1502303 CrossRef
.
- K. R. Yoon, G. Y. Lee, J. W. Jung, N. H. Kim, S. O. Kim and I. D. Kim, Nano Lett., 2016, 16, 2076–2083 CrossRef CAS PubMed
.
- J. Lu, L. Li, J. B. Park, Y. K. Sun, F. Wu and K. Amine, Chem. Rev., 2014, 114, 5611–5640 CrossRef CAS PubMed
.
- G. Zhang, L. Zhnag, S. Zhao, S. Lu, Y. Lu, H. Sun and L. Wang, RSC Adv., 2020, 10, 3853–3860 RSC
.
- Y. Yang, W. Yin, S. Wu, X. Yang, W. Xia, Y. Shen, Y. Huang, A. Cao and Q. Yuan, ACS Nano, 2016, 10, 1240–1248 CrossRef CAS PubMed
.
- F. Li, T. Zhang and H. Zhou, Energy Environ. Sci., 2016, 6, 1125–1141 RSC
.
- L. Zou, Y. Jiang, J. Cheng, Y. Chen, B. Chi, J. Pu and L. Jian, Electrochim. Acta, 2018, 262, 97–106 CrossRef CAS
.
- T. Li, H. Li, H. Li, Y. Xie and Z. Zhang, Electrochim. Acta, 2018, 262, 97–106 CrossRef
.
- X. Zhang, X. Chen, C. Chen, T. Liu, M. Liu, C. Zhang, T. Huang and A. Yu, RSC Adv., 2018, 8, 39829–39836 RSC
.
- W. Zhao, J. Wang, R. Yin, B. Li, X. Huang, L. Zhao and L. Qian, J. Colloid Interface Sci., 2020, 564, 28–36 CrossRef CAS PubMed
.
- H. Q. Wang, X. P. Fan, X. H. Zhang, Y. G. Huang, Q. Wu, Q. C. Pan and Q. Y. Li, RSC Adv., 2017, 7, 23328–23333 RSC
.
- J. Zhu, X. Ren, J. Liu, W. Zhang and Z. Wen, ACS Catal., 2015, 5, 73–81 CrossRef CAS
.
- Z. L. Jiang, H. Sun, W. K. Shi, J. Y. Cheng, J. Y. Hu, H. L. Guo, M. Y. Gao, H. Zhou and S. G. Sun, ACS Sustainable Chem. Eng., 2019, 7, 14161–14169 CrossRef CAS
.
- S. Jing, Y. Zhang, F. Chen, H. Liang, S. Yin and P. Tsiakaras, Appl. Catal., B, 2019, 245, 721–732 CrossRef CAS
.
- M. Wang, Y. Yao, Z. Tang, T. Zhao, F. Wu, Y. Yang and Q. Huang, ACS Appl. Mater. Interfaces, 2018, 10, 32212–32219 CrossRef CAS PubMed
.
- C. Zhao, G. Liu, N. Sun, X. Zhang, G. Wang, Y. Zhang, H. Zhang and H. Zhao, Chem. Eng. J., 2018, 334, 1270–1280 CrossRef CAS
.
- J. Shen, H. Wu, W. Sun, Q. Wu, S. Zhen, Z. Wang and K. Sun, J. Mater. Chem. A, 2019, 7, 10662–10671 RSC
.
- H. G. Jo and H. J. Ahn, Catalysts, 2020, 10, 1316 CrossRef CAS
.
- Y. C. Lu, H. A. Gasteiger and Y. S. Horn, J. Am. Chem. Soc., 2011, 133, 19048–19051 CrossRef CAS PubMed
.
- Y. Yang, W. Liu, Y. Wang, X. Wang, L. Xiao, J. Lu and L. Zhuang, Phys. Chem. Chem. Phys., 2014, 16, 20618–20623 RSC
.
- M. Zhang, L. Zou, C. Yang, Y. Chen, Z. Shen and C. Bo, Nanoscale, 2019, 11, 2855–2862 RSC
.
- R. A. Wong, C. Yang, A. Dutta, M. O, M. Hong, M. L. Thomas, K. Yamanaka, T. Ohta, K. Waki and H. R. Byon, ACS Energy Lett., 2018, 3, 592–597 CrossRef CAS
.
- M. Y. Oh, J. J. Lee, H. S. Park, T. Y. Kim, Y. S. Lee, V. Aravindan and K. S. Nahm, J. Ind. Eng. Chem., 2019, 80, 686–695 CrossRef CAS
.
- J. Wang and S. Kaskel, J. Mater. Chem., 2012, 22, 23710 RSC
.
- C. A. Bizzi, M. F. Pedrotti, J. S. Silva, J. S. Barin, J. A. Nobrega and E. M. M. Flores, J. Anal. At. Spectrom., 2017, 32, 1448–1466 RSC
.
- C. H. Choi, S. H. Park and S. I. Woo, J. Mater. Chem., 2012, 22, 12107–12115 RSC
.
- Y. Zhang, S. Liu, X. Zheng, X. Wang, Y. Xu, H. Tang, F. Kang, Q. H. Yang and J. Luo, Adv. Funct. Mater., 2017, 27, 1604687 CrossRef
.
- M. M. Titirici, M. Antonietti and N. Baccile, Green Chem., 2008, 10, 1204–1212 RSC
.
- J. C. C. Freitas, T. J. Bonagamba and F. G. Emmerich, Carbon, 2001, 39, 535–545 CrossRef CAS
.
- M. Ramalngam, C. Mani, S. Manickam and K. R. Srinivasalu, Eur. J. Inorg. Chem., 2019, 2019, 1904–1910 CrossRef
.
- K. Haddad, M. Jeguirim, S. Jellali, C. Guizani, L. Delmotte, S. Bennici and L. Limousy, Energy, 2017, 134, 10–23 CrossRef CAS
.
- K. Ai, Y. Liu, C. Ruan, L. Lu and G. Lu, Adv. Mater., 2013, 25, 998–1003 CrossRef CAS PubMed
.
- G. H. An, E. H. Lee and H. J. Ahn, Phys. Chem. Chem. Phys., 2016, 18, 14859–14866 RSC
.
- G. H. An, H. G. Jo and H. J. Ahn, J. Alloys Compd., 2018, 763, 250–256 CrossRef CAS
.
- J. H. Kim, A. G. Kannan, H. S. Woo, D. G. Jin, W. Kim, K. Ryu and D. W. Kim, J. Mater. Chem. A, 2015, 3, 18456 RSC
.
- T. Bhowmik, M. K. Kundu and S. Barman, ACS Appl. Mater. Interfaces, 2016, 8(42), 28678–28688 CrossRef CAS PubMed
.
- G. H. An, H. Kim and H. J. Ahn, Appl. Surf. Sci., 2019, 463, 18–26 CrossRef CAS
.
- J. Yi, W. H. Lee, C. H. Choi, Y. Lee, K. S. Park, B. K. Min, Y. J. Hwang and H. S. Oh, Electrochem. Commun., 2019, 104, 106469 CrossRef CAS
.
- G. H. An, D. Y. Lee and H. J. Ahn, J. Alloys Compd., 2017, 722, 60–68 CrossRef CAS
.
- H. Jang, A. Zahoor, J. S. Jeon, P. Kim, Y. S. Lee and K. S. Nahm, J. Electrochem. Soc., 2015, 162, A300–A307 CrossRef CAS
.
- V. R. Chitturi, M. Ara, W. Fawaz, K. Y. S. Ng and L. M. R. Arava, ACS Catal., 2016, 6, 7088–7097 CrossRef CAS
.
- G. H. An, Y. G. Lee and H. J. Ahn, J. Alloys Compd., 2018, 746, 177–184 CrossRef CAS
.
- G. Lu, Z. Li, W. Fan, M. Wang, S. Yang, J. Li, Z. Chang, H. Sun, S. Liang and Z. Liu, RSC Adv., 2019, 9, 4843–4848 RSC
.
- L. Shi, T. Zhao, A. Xu and Z. Wei, ACS Catal., 2016, 6, 6285–6293 CrossRef CAS
.
- D. Y. Sin, G. H. An and H. J. Ahn, J. Nanosci. Nanotechnol., 2016, 16, 10535–10540 CrossRef CAS
.
- H. Wu, W. Sun, J. Shen, D. W. Rooney, Z. Wang and K. Sun, Nanoscale, 2018, 10, 10221–10231 RSC
.
- C. Su, T. Yang, W. Zhou, W. Wang, X. Xu and Z. Shao, J. Mater. Chem. A, 2016, 4, 4516–4524 RSC
.
- L. Sharma, R. Gond, B. Senthilkumar, A. Roy and P. Barpanda, ACS Catal., 2020, 10, 43–50 CrossRef CAS
.
- J. Wang, S. Zhang, H. Zhong, N. A. Vante, D. Li, P. Tang and Y. Feng, Surfaces, 2019, 2, 229–240 CrossRef CAS
.
- R. Black, B. Adams and L. F. Nazar, Adv. Energy Mater., 2012, 2, 801–815 CrossRef CAS
.
- H. D. Lim, Y. S. Yun, S. Y. Cho, K. Y. Park, M. Y. Song, H. J. Jin and K. Kang, Carbon, 2017, 114, 311–316 CrossRef CAS
.
- J. R. Harding, Y. C. Lu, Y. Tsukada and Y. S. Horn, Phys. Chem. Chem. Phys., 2012, 14, 10540–10546 RSC
.
- L. Shi, A. Xu and T. Zhao, J. Phys. Chem., 2016, 120, 6356–6362 CAS
.
- K. Song, J. Jung, M. Park, H. Park, H. J. Kim, S. I. Choi, J. Yang, K. Kang, Y. K. Han and Y. M. Kang, ACS Catal., 2018, 8, 9006–9015 CrossRef CAS
.
- M. C. Kim, J. Y. So, S. H. Moon, S. B. Han, S. Choi, E. S. Kim, Y. K. Shin, J. E. Lee, D. H. Kwak, C. Lee, W. G. Bae and K. W. Park, J. Mater. Chem. A, 2018, 6, 9550–9560 RSC
.
- S. Xu, Y. Yao, Y. Guo, X. Zeng, S. D. Lacey, H. Song, C. Chen, Y. Li, J. Dai, Y. Wang, Y. Chen, B. Liu, K. Fu, K. Amine, J. Lu and L. Hu, Adv. Mater., 2018, 30, 1704907 CrossRef PubMed
.
- W. H. Ryu, T. H. Yoon, S. H. Song, S. Jeon, Y. J. Park and I. D. Kim, Nano Lett., 2013, 13, 4190–4197 CrossRef CAS PubMed
.
- T. Liu, J. J. Xu, Q. C. Liu, Z. W. Chang, Y. B. Yin, X. Y. Yang and X. B. Zhang, Small, 2017, 13, 1602952 CrossRef PubMed
.
Footnote |
| † Electronic supplementary information (ESI) available. See DOI: 10.1039/d1ra00740h |
| This journal is © The Royal Society of Chemistry 2021 |


