 Open Access Article
Coatings of magnetic composites of iron oxide and carbon nitride for photocatalytic water purification†
Isabel Köwitsch ab and
Michael Mehring
 *ab
*ab
aTechnische Universität Chemnitz, Fakultät für Naturwissenschaften, Institut für Chemie, Professur Koordinationschemie, Straße der Nationen 62, 09107 Chemnitz, Germany. E-mail: michael.mehring@chemie.tu-chemnitz.de
bCenter for Materials, Architectures and Integration of Nanomembranes (MAIN), Rosenbergstraße 6, 09126 Chemnitz, Germany
First published on 14th April 2021
Abstract
Magnetic composites of iron oxide (α-Fe2O3 and Fe3O4) and carbon nitride materials (CN) were synthesized via a microwave assisted hydrothermal method starting from iron salts and CN, which was obtained by thermal decomposition of dicyandiamide. The as-prepared composites with iron oxide loadings of 0.5 ω%–6 ω% were characterized by powder X-ray diffraction (PXRD), diffuse reflectance UV-vis spectroscopy, magnetization measurements, nitrogen adsorption measurements and thermogravimetric analyzes (TGA). The composites were examined for the degradation rate of an aqueous rhodamine B (RhB) solution under visible light irradiation. The magnetic composite α-Fe2O3(3 ω%)/CN enables 82% degradation of RhB within 90 min. Therefore, this material was selected for an immobilization approach and deposited using a spray coating technique on a magnetic polymer substrate. Coatings with loadings from 1.1 mg to 3.6 mg were compared with regard to their activity for the photocatalytic degradation of RhB under visible light irradiation. The substrate loaded with 0.4 mg cm−2 catalyst enables a RhB degradation of 61% within 8 h. Photocatalytic degradation of triclosan and ethinyl estradiol was also successful and both compounds were degraded with up to 46% of the initial concentration within 8 h. ICP-MS measurements of the pollutant solutions after photocatalytic treatment showed that leaching does not occur.
Introduction
The photocatalytic degradation of organic pollutants using semiconductors is an environmentally benign method for wastewater purification.1–3 Pollutants such as ethinyl estradiol and triclosan, which are used as biocides, increasingly enter into the ecosystems. For example, the contraceptive ethinyl estradiol was detected in wastewater in the USA, China and Australia and it is difficult to remove by conventional wastewater treatment plants. Triclosan is absorbed by the human skin and the oral mucosa and is suspected to influence the fecundity of humans and animals, affects the immune response and promotes the development of allergies, asthma and food sensitizations.4–6 Ethinyl estradiol may also influence the amphibian mating behavior.6 The admission of levels above safe thresholds of ethinyl estradiol could increase the risk of cancer and induce cardiovascular diseases in humans.4,5,7 Photocatalytic degradation processes using TiO2 were developed for the degradation of organic pollutants,8,9 but with a band gap of 3.2 eV TiO2 uses only 4% of the solar spectrum for photocatalytic reactions.8,10 Our work focuses on alternative materials such as carbon nitride materials (CN) with a band gap of 2.7–2.8 eV. Carbon nitride materials have received much attention recently because of their excellent chemical and temperature stability and their environmental sustainability for photocatalytic applications. Various forms of CN have been extensively examined for photocatalytic hydrogen evolution and photocatalytic water splitting, gas sensors and solar cells.11–17 They are promising candidates for photocatalytic wastewater treatment12,18,19 among others.3,10,15,20–24 Doping and exfoliation was demonstrated to enhance the degradation efficiencies of CN materials and alternatively the combination with other semiconductors was demonstrated to be successful.12,25–27 Selected examples for CN composites comprise MoS2/C3N4, Bi2WO6/C3N4, Ag/C3N4, Fe3O4/C3N4 and α-Fe2O3/C3N4.12,15,22,28,29 However, these investigations are based on dispersions of particles, and their use requires an additional costly process step for particle separation in any technologically relevant approach. Although, dispersions show generally significant higher activities than immobilized particles, it is essential to establish photocatalytic processes using immobilized photocatalysts.19,20,23,30–33 So far only a few studies focus on the immobilization of CN materials: for the photocatalytic removal of NO in air, the immobilization of carbon nitride on Al2O3 foam has been reported by Dong et al.34 The immobilization of photocatalysts such as TiO2/C3N4 composites for the photocatalytic degradation of methylene blue was presented by Boonprakob et al. and is based on a doctor blade coating technique on glass.35Herein, we present an alternative route to obtain photocatalytically active CN-based coatings. Therefore, composites composed of CN particles and iron oxides (α-Fe2O3 and Fe3O4) were synthesized. The combination of CN particles with magnetic iron oxides as magnetically separable dispersions for photocatalytic applications has been demonstrated recently.15,23 A common approach for iron oxide/CN composites is the hydrothermal synthesis.30–32,36,37 An alternative way to obtain such composites is the microwave assisted synthetic approach. This method reveals uniform and crystalline particles in shorter reaction times at lower temperatures.38,39 We describe the microwave assisted synthesis for iron oxide/CN composites, which were coated on a magnetic polymer matrix by a high volume low pressure (HVLP) spray coating technique. This coating technique is easy to handle, transferable to other photocatalyst materials and has low acquisition costs. The coatings were used to study the degradation rate of an aqueous RhB solution. Selected coated substrates were chosen to investigate the decomposition rate of the biocide triclosan and the medicinal drug ethinyl estradiol.
Results and discussion
The focus of this work is given to the formation of coatings of iron oxide/CN composites on magnetic substrates and their potential use for wastewater purification. Thus, we first discuss the synthesis and characterization of carbon nitride materials, iron oxides and the composites, thereafter the preparation of coatings and finally the catalytic activity of the coatings is described.Preparation and characterization of the photocatalysts
The carbon nitride material was obtained after decomposition of dried dicyandiamide at 550 °C for 4 h in a crucible, covered with a simple lid. Iron oxide particles were prepared by a microwave assisted synthesis, either starting from an aqueous solution of FeCl2·4H2O and Fe(NO3)3·9H2O (α-Fe2O3) or from FeCl2·4H2O (Fe3O4). After addition of KOH the solutions were transferred to a microwave reactor and heated for 1.5 h, respectively 2 h. To obtain iron oxide/CN composites, CN particles were added to the solutions. Different iron oxide loadings on the CN material particles were obtained by variation of the ratio iron precursor:CN. To determine the iron oxide loading of the resulting iron oxide/CN composites, thermogravimetric analyzes were carried out (Fig. 1).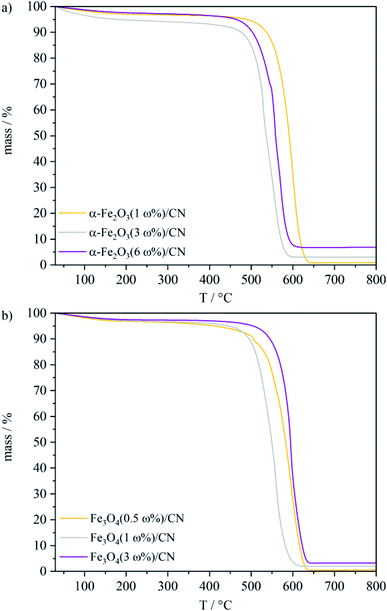 | ||
| Fig. 1 TGA curves of the as-prepared (a) α-Fe2O3/CN composite and (b) Fe3O4/CN composite particles under synthetic air. | ||
For the α-Fe2O3/CN composites, loadings of 1 ω%, 3 ω% and 6 ω% of α-Fe2O3 were obtained, and Fe3O4/CN composites with a Fe3O4 content of 0.5 ω%, 1 ω% and 3 ω% were isolated. The XRD patterns of the as-prepared iron oxides and the CN material are in good agreement with the literature ref. 40–42 (Fig. 2 and SI1†) and the phase purity of α-Fe2O3 and Fe3O4 is verified. The crystallite size of α-Fe2O3 and Fe3O4 is determined to 74 ± 18 nm and 45 ± 5 nm respectively according to the Scherrer equation. The reflexes for CN at 2θ = 12.9° and 2θ = 27.6° correspond to the (100) and (002) planes.40,43 For the iron oxide/CN composites (α-Fe2O3(3 ω%)/CN, α-Fe2O3(6 ω%)/CN, Fe3O4(3 ω%)/CN) the broad main reflexes of the iron oxides at 2θ = 33.1° and 2θ = 35.5° for α-Fe2O3 and at 2θ = 35.6° for Fe3O4 indicate that these particles are even of smaller crystallite size than the as-prepared iron oxide particles. However, for samples with iron oxide loadings lower than 3 ω% (SI1†) PXRD was not sensitive enough for characterization but TGA and magnetic behaviour support the successful composite formation.
 | ||
| Fig. 2 PXRD patterns of the as-prepared catalysts (a) α-Fe2O3/CN composites, α-Fe2O3 and (b) Fe3O4/CN composites and Fe3O4 (references: CN ICDD 00-066-0813,40 red bars; α-Fe2O3 ICDD 01-089-0597,42 blue bars; Fe3O4 ICDD 00-019-0629,41 black bars). | ||
Iron oxides, CN particles and the corresponding composites show absorption in the visible light region.12,15,23,37,44 The absorption edge of the CN material at 475 nm and the calculated band gap of 2.8 eV are in good agreement with reported data (Fig. 3a and SI2†).12,28 As expected on the basis of previous reports the black Fe3O4 particles absorb the whole spectrum of the irradiated light, which prevents the determination of the band gap by UV-vis.15 The calculated band gap of 2.1 eV for α-Fe2O3 and the absorption edge of 651 nm are in good agreement with literature data (Fig. 3a and SI2†).30 Due to the combination of the CN materials with α-Fe2O3 (Fig. 3a), a bathochromic shift is observed with increasing α-Fe2O3 loading. The absorption edges are in the range of 496 nm–545 nm. The baseline approach45 to determine the direct and indirect band gaps of the iron oxide/CN composites (SI2†) gave band gaps of 2.7 eV–2.8 eV for the α-Fe2O3/CN composites. For the Fe3O4/CN composites similar absorption curves are observed in the UV-vis spectra (Fig. 3b). The absorption edges for the composites with different Fe3O4 loading are in the range of 470 nm–480 nm and the band gaps are calculated to be 2.7 eV–2.8 eV (SI2†). The values of the composites do not change significantly as compared to the band gap of as prepared CN with 2.8 eV.
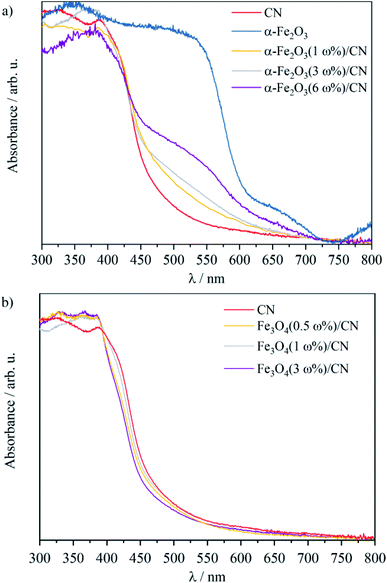 | ||
| Fig. 3 Diffuse UV-vis reflectance spectra of (a) α-Fe2O3/CN and (b) Fe3O4/CN composites and CN and α-Fe2O3. | ||
The specific surface areas are determined by nitrogen absorption measurements. A specific surface area of 20 m2 g−1 was obtained for α-Fe2O3 particles and 14 m2 g−1 for Fe3O4. The composites reveal surface areas of 22 m2 g−1 for α-Fe2O3(1 ω%)/CN, 21 m2 g−1 for α-Fe2O3(3 ω%)/CN and 23 m2 g−1 for α-Fe2O3(6 ω%)/CN. The Fe3O4/CN composites show surface areas of 39 m2 g−1 for Fe3O4(0.5 ω%)/CN, 48 m2 g−1 for Fe3O4(1 ω%)/CN and 22 m2 g−1 for Fe3O4(3 ω%)/CN. The data demonstrate that the functionalization with α-Fe2O3 results in a small increase in surface area compared to the pristine CN material, whose BET surface area is around 18 m2 g−1. Combination of CN with Fe3O4 gave larger BET surface areas than for α-Fe2O3/CN composites, which is indicative for the formation of smaller Fe3O4 particles as compared to α-Fe2O3 on CN.
To assess the potential of magnetism induced adhesion on the neodymium-containing substrate, the saturation magnetizations of the composites were determined. A value of 58.3 A m2 kg−1 is obtained for the as-prepared Fe3O4 and for α-Fe2O3 a value of 2.7 A m2 kg−1 was determined. The data correspond to literature values with saturation magnetization values of 30–60 A m2 kg−1 for Fe3O4 and 0.3–6.2 A m2 kg−1 for α-Fe2O3.46,47 For all composites, an increase in saturation magnetization with an increase of iron oxide loading is given. Values of 0.2 A m2 kg−1, 0.9 A m2 kg−1 and 2.0 A m2 kg−1 were obtained for CN particles loaded with 1 ω%, 3 ω% and 6 ω% α-Fe2O3, respectively. The loading with 0.5 ω%, 1 ω% and 3 ω% Fe3O4 gave compounds with magnetizations of 0.1 A m2 kg−1, 0.2 A m2 kg−1 and 0.5 A m2 kg−1.
The increase in saturation magnetization with increase of the corresponding iron oxide loading is approximately linear, which is as expected. The low saturation magnetization of the Fe3O4/CN materials as compared to α-Fe2O3/CN might be assigned to particle size effects (see PXRD, Fig. 2). As reported in literature, the magnetic properties of Fe3O4 nanoparticles are influenced by the particle and the domain size. The saturation magnetization increases with increasing particle size, regardless to domain structure and particle morphology.46,48,49 As expected to our assumption, the Fe3O4/CN composites show higher specific surface areas than the α-Fe2O3/CN composites. In addition, surface oxidation of Fe3O4 particles is reported to result in a significant decrease of the saturation magnetization.46,50,51 Similar observations were reported for magnetic oxidation-sensitive La0.8Sr0.2MnO3−δ particles.52
In order to make a selection for the composites which show the highest potential for adhesion to magnetic substrates, the magnetic properties were investigated qualitatively (Fig. 4). Composites with a α-Fe2O3 content of less than 3 ω% do not show pronounced magnetic behavior. For the Fe3O4/CN composites a loading of more than 1 ω% Fe3O4 is necessary to maintain magnetic properties. In conclusion composites with a Fe3O4 loading of more than 1 ω% and composites with more than 3 ω% α-Fe2O3 are suitable for the immobilization approach.
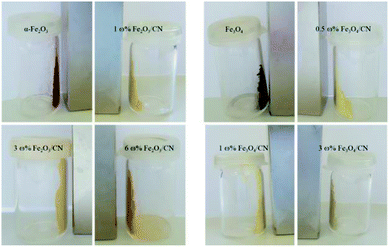 | ||
| Fig. 4 Magnetic behavior towards a neodymium magnet of α-Fe2O3, Fe3O4 and the corresponding iron oxide/CN composites. | ||
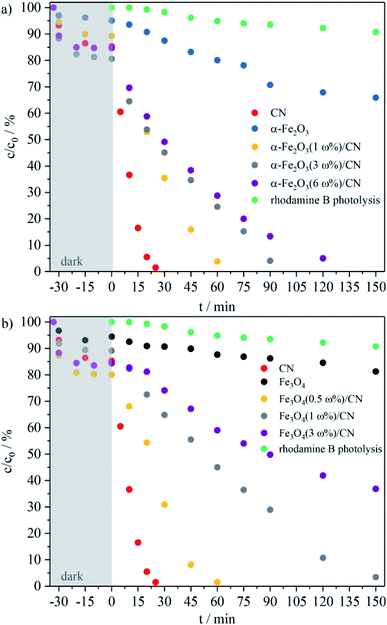
To evaluate the photocatalytic potential of the iron oxides, CN materials and the as-prepared composites, the degradation rate of an aqueous RhB (1 × 10⁻⁵ M) solution under visible light irradiation was studied (Fig. 5 and SI3†). Prior to irradiation the solutions were stirred for 30 min in the dark to establish the adsorption–desorption equilibrium. The CN material decomposes 85% RhB within 25 min. The α-Fe2O3 particles degrade 29% and the Fe3O4 particles 13% of the RhB in aqueous solution within 150 min of light irradiation. Due to the high photocatalytic degradation rates for the CN material as compared to the iron oxides, the iron content of composites of CN and α-Fe2O3, respectively Fe3O4, was chosen to be as low as possible, but high enough to retain magnetic behavior for the immobilization approach. α-Fe2O3(1 ω%)/CN shows a higher photocatalytic degradation rate for RhB than α-Fe2O3(3 ω%)/CN, and degrades 85% RhB within 60 min (Fig. 5a), but does not show any magnetic behavior. α-Fe2O3(3 ω%)/CN decomposes RhB within 120 min and is better suited than α-Fe2O3(6 ω%)/CN. The same applies for the Fe3O4/CN composites (Fig. 5b), where the composite Fe3O4(0.5 ω%)/CN enables a similar degradation rate as observed for the sample α-Fe2O3(1 ω%)/CN. A composite with a loading of 1 ω% Fe3O4 degrades 85% RhB within 150 min and with Fe3O4(3 ω%)/CN 48% of the initial concentration is decomposed.
The highest reaction rate constant is obtained for the CN particles with 2.7 × 10⁻³ s−1. The reaction rate constants of α-Fe2O3 and Fe3O4 are significant lower with values of 0.4 × 10⁻⁴ s−1 and 0.2 × 10⁻⁴ s−1, respectively, and the reaction rate constants for the composites are found in between these values (SI4†). All iron oxide/CN composites show lower values than CN, but higher reaction rate constants than the iron oxides themselves, which is as expected. For example, the composite Fe2O3(3.5 ω%)/CN shows a methyl orange degradation of 80% in 4 h, whereas the degradation rate with pure Fe2O3 is only about 5%.22 Similar observations were made for Fe3O4/CN composites. A RhB degradation rate of about 10% with Fe3O4 was increased to around 90% using a Fe3O4(15.2 ω%)/CN composite.15 However, evaluation of the literature data with the as-obtained values presented here is only possible qualitatively, since different catalyst concentrations, pollutants, pollutant concentrations and measurement setups were used.
With a deposition mass of less than 3 ω% α-Fe2O3 or less than 1 ω% Fe3O4 for the iron oxide/CN particles, the corresponding composites do not show magnetic behavior. Regarding the photocatalytic activity of the magnetic composites, α-Fe2O3(3 ω%)/CN shows the highest degradation rate for an aqueous RhB solution and is therefore selected for the immobilization approach.
Spray coating of magnetic α-Fe2O3/CN composites
To immobilize the as-prepared magnetic catalyst particles, a polymer substrate with embedded magnetic neodymium particles was used. A dispersion of α-Fe2O3(3 ω%)/CN in methanol was prepared and deposited on the substrates using a HVLP spray gun at a 100 psi working pressure. The substrate is heated at 80 °C to evaporate the solvent during the deposition process (Scheme 1). | ||
| Scheme 1 (a) Bare polymer substrate with embedded magnetic neodymium particles, (b) substrate coated with α-Fe2O3(3 ω%)/CN photocatalyst with an HVLP spray gun. | ||
For the degradation experiments of RhB, different amounts of the photocatalyst were deposited on the substrates. Fig. 6 shows the light microscope images of the samples α-Fe2O3(3 ω%)/CN-1 with a deposited mass of 1.1 mg, α-Fe2O3(3 ω%)/CN-2 with 2.2 mg catalyst and α-Fe2O3(3 ω%)/CN-3 with a mass of 3.6 mg catalyst. The deposition of a catalyst mass of 1.1 mg results in moderate coverage of the black substrate (Fig. 6a).
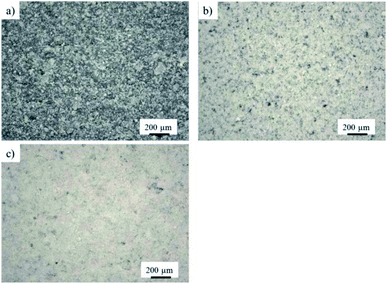 | ||
| Fig. 6 Light microscope images of coatings with different deposited masses (a) α-Fe2O3(3 ω%)/CN-1, (b) α-Fe2O3(3 ω%)/CN-2 and (c) α-Fe2O3(3 ω%)/CN-3, 5× magnification. | ||
Deposition of 2.2 mg of the catalyst reveals better but still incomplete coverage (Fig. 6b), while deposition of 3.6 mg results in coatings with an almost full coverage (Fig. 6c). The deposition method intrinsically results in rough surfaces in any case, which is beneficial for photocatalytic activity.
Photocatalytic degradation of organic pollutants using composite coatings
To evaluate the photocatalytic degradation rates of RhB for different amounts of deposited catalyst masses, the samples were placed in a photoreactor and 35 mL of a RhB solution (1 × 10⁻⁵ M) was irradiated using visible light (Fig. 7).The sample α-Fe2O3(3 ω%)/CN-1 showed the lowest degradation rate, most probably caused by the low coverage of the substrate (Fig. 6a). The sample α-Fe2O3(3 ω%)/CN-3 enabled a degradation of 61% RhB after 480 min irradiation time, while α-Fe2O3(3 ω%)/CN-2 generates a decomposition of 62% RhB. A similar RhB degradation of 56% is observed for a dispersion of α-Fe2O3(3 ω%)/CN (2.2 mg) (SI5†).
The reaction rate constants of all coatings follow the pseudo-first order kinetic (SI4†). The values of α-Fe2O3(3 ω%)/CN-2 and α-Fe2O3(3 ω%)/CN-3 are almost similar with 3.5 × 10⁻⁵ s−1 and significantly higher than the value for α-Fe2O3(3 ω%)/CN-1 with 0.8 × 10⁻⁵ s−1. As might be expected, the degree of coverage is the determining factor rather than the deposited amount.
The visible light spectra of the RhB degradation process indicate a photosensitive degradation mechanism (Fig. 8a). The slight hypsochromic shift from 554 nm to 551 nm after 480 min light irradiation is caused by the stepwise de-ethylation of the RhB molecule,53,54 which was observed for all three samples. The same mechanism is operating for the degradation of RhB with α-Fe2O3(3 ω%)/CN particles (Fig. 8b), where a shift of 26 nm was observed.
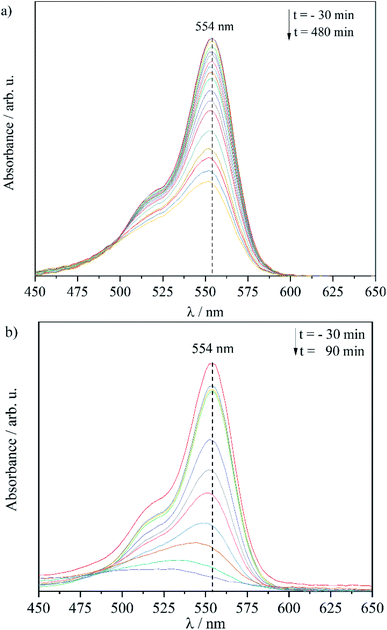 | ||
| Fig. 8 Visible light spectra of RhB while photodegradation process using (a) α-Fe2O3(3 ω%)/CN-2 and (b) α-Fe2O3(3 ω%)/CN particles as photocatalyst. | ||
The RhB solutions after photocatalytic degradation with catalyst films were analyzed with ICP-MS to determine the iron content and to evaluate, if material loss occurs during the photocatalytic experiments. In addition, a solution after a photolysis measurement of a blank substrate was analyzed. For the blank sample an iron content of 0.14 mg L−1 was determined. For sample α-Fe2O3(3 ω%)/CN-1 an iron content of 0.13 mg L−1, for sample α-Fe2O3(3 ω%)/CN-2 a value of 0.17 mg L−1 and for α-Fe2O3(3 ω%)/CN-3 an iron content of 0.12 mg L−1 was observed. The dissolved iron in the blank sample most probably results from the neodymium particles in the polymer matrix of the substrate.
EDX measurements showed, that these magnetic particles consist of 75 ω% iron, 12 ω% neodymium and 13 ω% tungsten, and a small amount of these particles was leached out from the polymer substrate during the photocatalytic measurement. With regard to the photolysis measurement and the layers loaded with catalyst, the iron values do not differ significantly. Thus, it is concluded that leaching from the coatings seems to be negligible. According to the guidelines for limit values for the iron content in water by the WHO and the European Union, the iron content of drinking water should not be higher than 0.2 mg L−1 while the iron content of ground water or surface water might range between 0.5–50 mg L−1.55 This limit values are not exceeded for any of the samples.
To allow a comparison of the different coatings with consideration of the different deposited masses, the activity of each sample was calculated. α-Fe2O3(3 ω%)/CN-2 showed the highest photocatalytic activity with 2.0 × 10⁻¹⁰ mol mg−1 min−1. For sample α-Fe2O3(3 ω%)/CN-1 an activity of 1.5 × 10⁻¹⁰ mol mg−1 min−1 and for α-Fe2O3(3 ω%)/CN-3 a value of 1.2 × 10⁻¹⁰ mol mg−1 min−1 was calculated. Therefore, α-Fe2O3(3 ω%)/CN-2 was chosen for further experiments.
In addition, light microscope images of the coatings after catalysis were taken (Fig. 9). The layers were washed with ethanol and dried. In comparison to the images which were taken after preparation of the samples, only α-Fe2O3(3 ω%)/CN-3 shows significant optical changes (Fig. 9c). Cracks and holes become visible in the layer, which can be explained by leaching during the washing and drying process. Exemplarily, a scotch tape test for α-Fe2O3(3 ω%)/CN-2 was performed to get a qualitative idea of the adhesion strength of the catalyst to the substrate (Fig. 9d). The film is not fully resistant to external forces, but the deposited particles remain mainly adhered to the substrate.
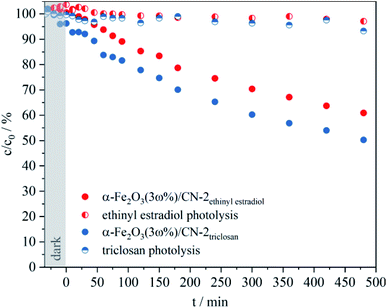
In addition to the investigations for the degradation of RhB using the catalyst coatings, the photocatalytic degradation of other organic compounds was investigated. To evaluate the photocatalytic degradation rate for these organic pollutants, α-Fe2O3(3 ω%)/CN-2 coatings were selected. The photolysis of aqueous solutions of triclosan and ethinyl estradiol with a concentration of 4 × 10⁻⁵ M showed only minor degradation (Fig. 10). Using the catalyst coatings, 46% of triclosan and 40% of ethinyl estradiol were degraded after 8 h irradiation time. The determination of the reaction rate constant (SI4†) also reflects the higher degradation rate for triclosan with a value of 2.3 × 10⁻⁵ s−1 compared to the value for EE2 with 1.8 × 10⁻⁵ s−1.
Considering the increased concentration of the pollutant solutions (4 × 10⁻⁵ M) compared to the concentration of the RhB solution (1 × 10⁻⁵ M), a three times higher photocatalytic activity for the degradation of triclosan (6.7 × 10⁻¹⁰ mol mg−1 min−1) and ethinyl estradiol (6.3 × 10⁻¹⁰ mol mg−1 min−1) with α-Fe2O3(3 ω%)/CN-2 was calculated. Therefore, the as-obtained α-Fe2O3(3 ω%)/CN catalyst might be considered for conventional wastewater treatment plants to reduce the concentration of disinfectants and contraceptives in drinking water.
Conclusion
An easy method to obtain coatings of magnetic iron oxide/CN composite via a HVLP spray coating process on neodymium-containing polymeric substrates is presented. The microwave assisted synthesis gave α-Fe2O3/CN and Fe3O4/CN within less than 2 h. The as-prepared composites show band gaps of 2.7–2.8 eV and are suitable for the photocatalytic degradation of organic pollutants. To evaluate the photocatalytic performance of CN materials, iron oxides and the corresponding composites, the materials were used to degrade RhB. The photocatalytic activity of the composites is significantly higher as compared to the iron oxides, but lower than pure CN. However, α-Fe2O3(3 ω%)/CN still shows a promising photocatalytic degradation rate and in addition exhibits magnetic behavior. It was therefore used for the immobilization approach on a magnetic substrate.Starting from dispersions α-Fe2O3(3 ω%)/CN composites were deposited by a HVLP spray coating technique on a magnetic polymer matrix. The coating α-Fe2O3(3 ω%)/CN-2 (2.2 mg) decomposes 62% of an aqueous RhB solution within 8 h. A higher amount of deposited catalyst mass did not enhance the degradation rate and a lower amount of catalyst results in an incomplete coverage of the substrate and thus lower degradation efficiencies. The obtained rough surface of the coatings is beneficial for high degradation rates. The analysis of the residual dye solutions after catalysis by ICP-MS showed, that leaching of iron from the coatings can be neglected. Photocatalytic degradation of triclosan and ethinyl estradiol was successful, which demonstrates the potential of the coatings to degrade different pollutant classes such as chlorinated phenols, xanthene dyes and estrogens. Dispersions of the catalyst particles enable higher photocatalytic degradation rates of aqueous pollutant solutions as compared to the coatings, but the immobilization approach makes cost-intensive separation steps redundant. In this way, organic pollutants that were previously difficult to remove by conventional techniques, might be removed from drinking water by photocatalytically active coatings using sunlight.
Experimental section
Chemicals
Dicyandiamide (99% Co. Alfa Aesar) was dried with P2O5 for 5 days under vacuum before usage. FeCl2·4H2O (Co. Merck), Fe(NO3)3·9H2O (Co. Merck) and KOH (Co. Merck) were used as received. The polymer matrix with embedded neodymium particles was received from dogeo GmbH.Catalyst preparation
The dried dicyandiamide is decomposed in a crucible with a lid at 550 °C for 4 h using a heating rate of 5 K min−1. The obtained yellow powder is grinded in a mortar and sieved to a particle size smaller than 100 μm. To prepare α-Fe2O3/CN composites, the CN materials are placed in a microwave vessel and dispersed in 5 mL distilled water under vigorous stirring. Then Fe(NO3)3·9H2O and FeCl2·4H2O are added and dissolved. After addition of KOH, dissolved in 5 mL distilled water, the vessel is placed in a microwave reactor (Co. CEM) for 2 h at 130 °C and a power of 200 W is applied. The as-obtained beige magnetic powder is collected by centrifugation, washed with distilled water several times and dried at 120 °C. For the preparation of the Fe3O4/CN composites, CN particles are dispersed in 5 mL distilled water in a microwave vessel. Then FeCl2·4H2O is dissolved and after addition of KOH in 5 mL distilled water, the vessel is placed in the microwave reactor for 1.5 h at 160 °C at 200 W. The as-obtained powder is washed and dried to give the Fe3O4/CN composites. For the synthesis of Fe3O4 and α-Fe2O3 particles, the parameters are chosen according to the above described method. The corresponding masses of the used starting materials are listed in Table 1.| Compound | FeCl2·4H2O/mg | Fe(NO3)3·9H2O/mg | KOH/mg | CN material/mg |
|---|---|---|---|---|
| Fe3O4 | 258 | — | 145 | — |
| Fe3O4(0.5 ω%)/CN | 3 | — | 2 | 199 |
| Fe3O4(1 ω%)/CN | 3 | — | 2 | 99 |
| Fe3O4(3 ω%)/CN | 16 | — | 9 | 194 |
| α-Fe2O3 | 83 | 337 | 187 | — |
| α-Fe2O3(1 ω%)/CN | 8 | 34 | 48 | 980 |
| α-Fe2O3(3 ω%)/CN | 23 | 95 | 53 | 910 |
| α-Fe2O3(6 ω%)/CN | 4 | 17 | 9 | 95 |
Spray coating
The spray coating process of α-Fe2O3(3 ω%)/CN composite is carried out with a HVLP (high volume low pressure) airbrush spray gun. The spray gun is equipped with a 0.5 mm nozzle and operates at a working pressure of 100 psi with a working distance of approximately 20 cm. During the coating process the substrate is placed on a heat plate with a temperature of 80 °C. The as-prepared particles are dispersed in methanol with a mass concentration of 3 g L−1 and sprayed on a 23 mm–25 mm polymer matrix with embedded magnetic neodymium particles. To determine the deposited masses, the samples were weighed after the spraying process. The samples were labelled according to their deposited masses, whereupon sample α-Fe2O3(3 ω%)/CN-1 shows a deposited mass of 1.1 mg, α-Fe2O3(3 ω%)/CN-2 2.2 mg catalyst and α-Fe2O3(3 ω%)/CN-3 with a mass of 3.6 mg catalyst.Evaluation of the photocatalytic activity
The photocatalytic activity of the as-prepared composite coatings was evaluated in a water cooled glass reactor (T = 15 °C) using the coated carrier material and 35 mL of an aqueous solution of 1 × 10⁻⁵ M RhB, 4 × 10⁻⁵ M triclosan and 4 × 10⁻⁵ M ethinyl estradiol (EE2). The concentrations of the pollutant solutions (triclosan, EE2) are higher compared to the RhB solution due to the different absorption coefficients. To allow reproducible and accurate traceability by UV-vis, higher concentrations have to be used for triclosan and EE2. The photoreactor is equipped with a 300 W xenon lamp (type Cermax® VQTM ME300BF, Co. Perkin Elmer, intensity of ∼1839 W m−2). A hot mirror filter (λ ≤ 700 nm) is located within a distance of 12.3 cm at one side of the reactor and directly illuminates an area of 4.5 cm2. A cut-off filter (λc (τi = 0.50) = 420 ± 6 nm, GG420, Co. Schott) is used to remove the UV light. Before illumination, the solutions are stirred for 30 min in the dark to establish the adsorption–desorption equilibrium of the dye at the catalyst surface, which was verified by UV-vis measurements. The progress of photodegradation was studied using in situ UV-vis spectroscopy. The illumination process is interrupted by stopping to stir and darkening the light beam by a cover prior to the UV-vis measurement. The interval of measurement is timed every 10 min for the first 30 min, every 15 min between 30 min to 90 min, every 30 min between 90 min and 180 min and every 60 min to the last measurement after 480 min. The concentration of the pollutant is determined by calculating the area under the UV-vis curve from 450 nm–600 nm for RhB, 200 nm–300 nm for triclosan and ethinyl estradiol. The photodegradation is plotted as a function of the irradiation time. The photocatalytic degradation using dispersions is carried out analogously, while 40 mL of 1 × 10⁻⁵ M RhB solution and 40 mg of the catalyst are used. The photocatalytic activity A is calculated according to the equation:here, c0 is the initial concentration of the pollutant solution, V is the volume of the solution, XPC is the conversion in moles at the time tPC and mCat is the catalyst mass. The determination of the photocatalytic activity for coatings is carried out by means of the conversion after 480 min irradiation time. The photocatalytic activity for dispersed particles is calculated using the determined degradation after 20 min irradiation time.
Materials characterization
Powder X-ray diffraction (XRD) was carried out with a STOE-STADI-P diffractometer equipped with a Ge(111)-monochromator. The X-ray source was CuKα1-radiation (40 kV, 40 mA). The crystallite size was estimated using the formula determined by the Scherrer equationwhere τ is the volume-weighted crystallite size in nanometers, K is the Scherrer constant, here taken as 1.0, λ is the X-ray wavelength, θ is the Bragg angle and β is the full width of diffraction line at half of the maximum intensity (FWHM; background subtracted). The FWHM is corrected for instrumental broadening using a LaB6 US National Institute of Standards and Technology (NIST). Diffuse reflectance UV-vis spectroscopy was performed using a Carry 60 UV-vis (Co. Agilent Technologies) equipped with a Barrelino™ (Co. Harrick Scientific Products) remote diffuse reflection probe. The band gap Eg of the semiconductor was estimated according to the equation
| (αhν)1/n = A(hν − Eg) |
Conflicts of interest
There are no conflicts to declare.Acknowledgements
We are grateful to the Sächsische AufbauBank and the Europäische Sozialfonds (ESF) for financial support (Project Number 100 327 773, grant recipient Isabel Köwitsch). We thank Prof. Dr Marc Armbrüster for access to the light microscope and Prof. Dr Marc Armbrüster and Nicolas Köwitsch for EDX measurements, Prof. Dr Olav Hellwig and Benny Böhm for magnetization measurements, Benjamin Hentschel for nitrogen absorption measurements, and Prof. Dr Werner A. Goedel for access to the TGA and Sebastian Scholz for the TGA measurements. The publication of this article was funded by Chemnitz University of Technology.References
- B. Ohtani, J. Photochem. Photobiol., C, 2010, 11, 157–178 CrossRef CAS.
- A. Sobczynski and A. Dobosz, Pol. J. Environ. Stud., 2001, 10, 195–205 CAS.
- A. V. G. Wankhade, G. S. Gaikwad, M. G. Dhonde, N. T. Khaty and S. R. Thakare, Res. J. Chem. Environ., 2013, 17, 84–94 Search PubMed.
- L. M. Weatherly and J. A. Gosse, J. Toxicol. Environ. Health, Part B, 2017, 20, 447–469 CAS.
- M. Adeel, X. Song, Y. Wang, D. Francis and Y. Yang, Environ. Int., 2017, 99, 107–119 CrossRef CAS PubMed.
- F. Hoffmann and W. Kloas, PLoS One, 2012, 7, e32097 CrossRef CAS PubMed.
- B. Stuart and M. Levy, Pediatr. Infect. Dis. J., 2000, 19, 120–122 CrossRef PubMed.
- M. M. Mahlambi, C. J. Ngila and B. B. Mamba, J. Nanomater., 2015, 2015, 1–29 CrossRef.
- U. I. Gaya and A. H. Abdullah, J. Photochem. Photobiol., C, 2008, 9, 1–12 CrossRef CAS.
- S. Kumar, S. Karthikeyan and A. Lee, Catalysts, 2018, 8, 74 CrossRef.
- H. Zou, X. Yan, J. Ren, X. Wu, Y. Dai, D. Sha, J. Pan and J. Liu, J. Materiomics, 2015, 1, 340–347 CrossRef.
- J. Fu, J. Yu, C. Jiang and B. Cheng, Adv. Energy Mater., 2018, 8, 1701503 CrossRef.
- Y. Wang, X. Wang and M. Antonietti, Angew. Chem., Int. Ed., 2012, 51, 68–89 CrossRef CAS PubMed.
- F. Goettmann, A. Fischer, M. Antonietti and A. Thomas, Angew. Chem., Int. Ed., 2006, 45, 4467–4471 CrossRef CAS PubMed.
- S. Kumar, S. T, B. Kumar, A. Baruah and V. Shanker, J. Phys. Chem. C, 2013, 117, 26135–26143 CrossRef CAS.
- K. Schwinghammer, B. Tuffy, M. B. Mesch, E. Wirnhier, C. Martineau, F. Taulelle, W. Schnick, J. Senker and B. V. Lotsch, Angew. Chem., Int. Ed., 2013, 52, 2435–2439 CrossRef CAS PubMed.
- C. Jia, L. Yang, Y. Zhang, X. Zhang, K. Xiao, J. Xu and J. Liu, ACS Appl. Mater. Interfaces, 2020, 12, 53571–53591 CrossRef CAS PubMed.
- J. Barrio, M. Volokh and M. Shalom, J. Mater. Chem. A, 2020, 8, 11075–11116 RSC.
- J. Zhu, P. Xiao, H. Li and S. A. Carabineiro, ACS Appl. Mater. Interfaces, 2014, 6, 16449–16465 CrossRef CAS PubMed.
- M. Schlesinger, M. Weber, S. Schulze, M. Hietschold and M. Mehring, ChemistryOpen, 2013, 2, 146–155 CrossRef CAS PubMed.
- N. Rao, J. Hazard. Mater., 2003, 101, 301–314 CrossRef CAS PubMed.
- K. C. Christoforidis, T. Montini, E. Bontempi, S. Zafeiratos, J. J. D. Jaén and P. Fornasiero, Appl. Catal., B, 2016, 187, 171–180 CrossRef CAS.
- M. Mishra and D.-M. Chun, Appl. Catal., A, 2015, 498, 126–141 CrossRef CAS.
- A. T. Montoya and E. G. Gillan, ACS Appl. Nano Mater., 2018, 1, 5944–5956 CrossRef CAS.
- J. Xu, L. Zhang, R. Shi and Y. Zhu, J. Mater. Chem. A, 2013, 1, 14766 RSC.
- K. Schwinghammer, M. B. Mesch, V. Duppel, C. Ziegler, J. Senker and B. V. Lotsch, J. Am. Chem. Soc., 2014, 136, 1730–1733 CrossRef CAS PubMed.
- Q. Zhang, Y. Peng, Y. Lin, S. Wu, X. Yu and C. Yang, Chem. Eng. J., 2021, 405, 126661 CrossRef CAS.
- L. Ge, C. Han, J. Liu and Y. Li, Appl. Catal., A, 2011, 409–410, 215–222 CrossRef CAS.
- Y. Qi, Q. Liang, R. Lv, W. Shen, F. Kang and Z. H. Huang, R. Soc. Open Sci., 2018, 5, 180187 CrossRef PubMed.
- S. Ren, C. Chen, Y. Zhou, Q. Dong and H. Ding, Res. Chem. Intermed., 2016, 43, 3307–3323 CrossRef.
- X. Yu, X. Yang and G. Li, J. Electron. Mater., 2017, 47, 672–676 CrossRef.
- L. Zhou, L. Wang, J. Zhang, J. Lei and Y. Liu, Eur. J. Inorg. Chem., 2016, 2016, 5387–5392 CrossRef CAS.
- L. Y. Huang, R. X. Zhang, X. J. Sun and X. N. Cheng, Key Eng. Mater., 2013, 575–576, 225–228 Search PubMed.
- F. Dong, Z. Wang, Y. Li, W. K. Ho and S. C. Lee, Environ. Sci. Technol., 2014, 48, 10345–10353 CrossRef CAS PubMed.
- N. Boonprakob, N. Wetchakun, S. Phanichphant, D. Waxler, P. Sherrell, A. Nattestad, J. Chen and B. Inceesungvorn, J. Colloid Interface Sci., 2014, 417, 402–409 CrossRef CAS PubMed.
- S. Ni, X. Wang, G. Zhou, F. Yang, J. Wang, Q. Wang and D. He, Mater. Lett., 2009, 63, 2701–2703 CrossRef CAS.
- G. Xi, B. Yue, J. Cao and J. Ye, Chem.–Eur. J., 2011, 17, 5145–5154 CrossRef CAS PubMed.
- V. Sreeja and P. A. Joy, Mater. Res. Bull., 2007, 42, 1570–1576 CrossRef CAS.
- H. Katsuki, J. Am. Ceram. Soc., 2001, 84, 2313–2317 CrossRef CAS.
- F. Fina, S. K. Callear, G. M. Carins and J. T. S. Irvine, Chem. Mater., 2015, 27, 2612–2618 CrossRef CAS.
- H. E. Swanson, H. F. McMurdie, M. C. Morris, E. H. Evans, in Standard X-ray Diffraction Powder Patterns, National Bureau of Standards Monograph 25 – Section 5, Washington D. C., 1967, p. 31 Search PubMed.
- V. A. Sadykov, L. A. Isupova, S. V. Tsybulya, S. V. Cherepanova, G. S. Litvak, E. B. Burgina, G. N. Kustova, V. N. Kolomiichuk, V. P. Ivanov, E. A. Paukshtis, A. V. Golovin and E. G. Avvakumov, J. Solid State Chem., 1996, 123, 191–202 CrossRef CAS.
- B. V. Lotsch, M. Doblinger, J. Sehnert, L. Seyfarth, J. Senker, O. Oeckler and W. Schnick, Chem.–Eur. J., 2007, 13, 4969–4980 CrossRef CAS PubMed.
- C. S. Biju, Nano-Struct. Nano-Objects, 2018, 13, 44–50 CrossRef CAS.
- P. Makula, M. Pacia and W. Macyk, J. Phys. Chem. Lett., 2018, 9, 6814–6817 CrossRef CAS PubMed.
- A. G. Kolhatkar, A. C. Jamison, D. Litvinov, R. C. Willson and T. R. Lee, Int. J. Mol. Sci., 2013, 14, 15977–16009 CrossRef PubMed.
- M. Tadic, N. Citakovic, M. Panjan, B. Stanojevic, D. Markovic, Đ. Jovanovic and V. Spasojevic, J. Alloys Compd., 2012, 543, 118–124 CrossRef CAS.
- Q. Li, C. W. Kartikowati, S. Horie, T. Ogi, T. Iwaki and K. Okuyama, Sci. Rep., 2017, 7, 9894 CrossRef PubMed.
- C. Caizer, in Handbook of Nanoparticles, ed. M. Aliofkhazraei, Springer International Publishing Switzerland, Switzerland, 2016, vol. 2, pp. 475–519 Search PubMed.
- T. Sato, T. Iljima, M. Seki and N. Inagaki, J. Magn. Magn. Mater., 1987, 65, 252–256 CrossRef CAS.
- O. Kubo, T. Ido, H. Yokoyama and Y. Koike, J. Appl. Phys., 1985, 57, 4280–4282 CrossRef CAS.
- S. Roy, I. Dubenko, D. D. Edorh and N. Ali, J. Appl. Phys., 2004, 96, 1202–1208 CrossRef CAS.
- Q. Wang, C. Chen, D. Zhao, W. Ma and J. Zhao, Langmuir, 2008, 24, 4338–7345 Search PubMed.
- T. Watanabe, T. Takizawa and K. Honda, J. Phys. Chem., 1977, 81, 1845–1851 CrossRef CAS.
- J. L. Lozán, H. Graßl, P. Hupfer, L. Karbe and C.-D. Schönwiese, in Warnsignal Klima: Genug Wasser für alle?, Universität Hamburg, Hamburg, 2011, vol. 3, pp. 249–256 Search PubMed.
- J. G. Tauc, R. Grigorovici and A. Vanou, Phys. Status Solidi, 1966, 15, 627–637 CrossRef CAS.
- G. Algara-Siller, N. Severin, S. Y. Chong, T. Bjorkman, R. G. Palgrave, A. Laybourn, M. Antonietti, Y. Z. Khimyak, A. V. Krasheninnikov, J. P. Rabe, U. Kaiser, A. I. Cooper, A. Thomas and M. J. Bojdys, Angew. Chem., 2014, 53, 7450–7455 CrossRef CAS PubMed.
- R. Morrish, R. Silverstein and C. A. Wolden, J. Am. Chem. Soc., 2012, 134, 17854–17857 CrossRef CAS PubMed.
- S. Rashidi Dafeh, P. Iranmanesh and P. Salarizadeh, Mater. Sci. Eng., C, 2019, 98, 205–212 CrossRef CAS PubMed.
- S. Khashan, S. Dagher, N. Tit, A. Alazzam and I. Obaidat, Surf. Coat. Technol., 2017, 322, 92–98 CrossRef CAS.
Footnote |
| † Electronic supplementary information (ESI) available. See DOI: 10.1039/d1ra00790d |
| This journal is © The Royal Society of Chemistry 2021 |

