 Open Access Article
Electrochemical investigation and amperometry determination iodate based on ionic liquid/polyoxotungstate/P-doped electrochemically reduced graphene oxide multi-component nanocomposite modified glassy carbon electrode†
Minoo Sharifi,
Somayeh Dianat * and
Amin Hosseinian
Department of Chemistry, Faculty of Sciences, University of Hormozgan, Bandar Abbas 79161-93145, Iran. E-mail: s.dianat@hormozgan.ac.ir; Tel: +98 76 33670121
First published on 1st March 2021
Abstract
A novel modified glassy carbon electrode (GCE) was successfully fabricated with a tetra-component nanocomposite consisting of (1,1′-(1,4-butanediyl)dipyridinium) ionic liquid (bdpy), SiW11O39Ni(H2O) (SiW11Ni) Keggin-type polyoxometalate (POM), and phosphorus-doped electrochemically reduced graphene oxide (P-ERGO) by electrodeposition technique. The (bdpy)SiW11Ni/GO hybrid nanocomposite was synthesized by a one-pot hydrothermal method and characterized by UV-vis absorption, Fourier transform infrared (FT-IR) spectroscopy, X-ray diffraction (XRD) analysis, thermogravimetric-differential thermal analysis (TGA/DTA), and transmission electron microscopy (TEM). The morphology, electrochemical performance, and electrocatalysis activity of the nanocomposite modified glassy carbon electrode ((bdpy)SiW11Ni/P-ERGO/GCE) were analyzed by field emission scanning electron microscopy (FE-SEM) coupled with energy-dispersive X-ray spectroscopy (EDS), cyclic voltammetry (CV), square wave voltammetry (SWV), and amperometry, respectively. Under the optimum experimental conditions, the as-prepared sensor showed high sensitivity of 28.1 μA mM−1 and good selectivity for iodate (IO3−) reduction, enabling the detection of IO3− within a linear range of 10–1600 μmol L−1 (R2 = 0.9999) with a limit of detection (LOD) of 0.47 nmol L−1 (S/N = 3). The proposed electrochemical sensor exhibited good reproducibility, and repeatability, high stability, and excellent anti-interference ability, as well as analytical performance in mineral water, tap water, and commercial edible iodized salt which might provide a capable platform for the determination of IO3−.
1. Introduction
Polyoxometalates (POMs) are a family of anionic nanoclusters consisting of early transition metals and oxygen atoms to form a closed 3-dimensional framework.1,2 POMs, especially Keggin-type POMs, have different applications in the fields of catalysis,3–6 medicine,7–9 and molecular materials10,11 due to their excellent redox character, unique molecular structure, electronic versatility, and easy preparation. One of the attractive properties of POMs is that the anionic cluster can undergo a fast, stepwise, reversible, and multi-electron transfer reaction while keeping the structural integrity.2,12–14 The multiple redox properties make them attractive candidates in surface modification, electroanalysis, and electrocatalysis.2,13–15Different methods have been developed to achieve chemically modified electrodes (CMEs) with POMs such as electrodeposition at a very negative potential,16,17 adsorption,18 entrapment into conducting,19,20 or non-conducting polymers matrixes,21,22 layer-by-layer self-assembly,23,24 Langmuir–Blodgett (LB) technique,25,26 preparation of self-assembled monolayer and multilayer thin-films,27 and bulk modification of carbon composites and carbon paste matrices.28 However, the electrocatalytic activity of POMs-modified electrodes is limited due to their low stability in aqueous solutions15,27,29 and low specific surface area.30
To achieve the enhanced stability of POMs, many studies have been focused on the design and construction of modifying and assemble POMs with suitable organic matrices, which is one of the most exciting fields in the materials chemistry.27,31–33 Recently, ionic liquids (ILs) have concerned more attention,34–36 due to owning highlight properties such as good aqueous solubility, high electrical conductivity, non-volatility, non-flammability, low toxicity, high thermal and electrochemical stabilities, and large electrochemical potential window.37
Furthermore, immobilization or dispersion of POMs on different supporting carbon materials has attracted significant attention due to their small background currents, wide potential windows, low-cost, excellent chemical stability, and a strong affinity for POMs.38–43
Graphene was discovered in 2004 as a new carbon nanostructure by Novoselov and Geim.44 Graphene is a two-dimensional (2D) crystal composed of a monolayer of sp2 hybridized carbon atoms arranged in a hexagonal packing structure.45 Graphene is the thinnest and strongest material known to exist in the world.46 Graphene has been widely studied in the nanotechnology and nanoscience applications due to exclusive properties such as good chemical stability, great specific surface area (SSA, about 2600 m2 g−1), high electron mobility, and good thermal conductivity.13 Graphene is a proper candidate for a POM support material to solve both high solubility and low surface area of POMs.47 Moreover, the interesting properties of POMs, particularly as catalysis,48,49 electrocatalysis,50,51 and capacitance52,53 can be improved by the large SSA and good conductivity of graphene. So far, many studies have been reported on POM/graphene nanocomposites, in which graphene oxide (GO) is applied as support and POMs are immobilized onto the reduced GO (RGO) through various reduction methods such as UV-photoreduction,54–57 and chemical reduction with the help of hazardous substances (e.g., hydrazine).58 However, these methods generally obtained powder POM/RGO nanocomposites that need to be deposited on the electrode surface using the drop-casting technique. This preparation method has intrinsic limitations such as low stability and lack of control of the film thickness.59,60 The self-assembly technique is the best method for the construction of the stable and uniform modified surfaces. In some research, POM/RGO nanocomposite is prepared through the layer-by-layer electrostatic assembly of POM/GO followed by the UV-photoreduction step.24,61 Lately, the electrochemical reduction of GO to RGO has attracted great attention due to its green and simple preparation method.59,60,62,63 Chen et al. deposited RGO on the surface of a glassy carbon electrode (GCE) by cyclic voltammetric (CV) reduction of a GO colloidal solution, which presented the high-resolution ability to the catechol and hydroquinone isomers.60 Weihua Guo et al. reported the preparation and electrocatalytic activity of Keggin-type heteropolymolybdate H4SiMo12O40 and chitosan-electrochemically RGO multilayer composite films on indium tin oxide electrode (ITO) for determination of S2O82− with excellent sensitivity and a low detection limit.59 Mai et al. reported the preparation of RGO/copper composite from a surfactant-free colloidal solution comprised of [CuIIEDTA]2− complexes and GO sheets by electrochemical reduction.62 Recently, many studies have confirmed that doping of heteroatoms can well modify the electronic structure and enhance the electrochemical properties of RGO. For instance, boron, nitrogen, phosphorus, and sulfur atoms doped into graphene can improve the electrical conductivity and electrocatalytic activity of RGO, which can be applied as high-performance supercapacitor electrode,64,65 lithium-ion batteries,66–69 fuel cells,70,71 and dye-sensitized solar cells.72 Although the electrochemical reduction method has many advantages in preparing of the P-doped graphene monolayer film modified electrode, few studies have been reported concerning the modified electrode with POM/P-ERGO and its derivatives prepared by this method. Using the electrochemical reduction method for the fabrication of the POM/P-ERGO modified electrode still has challenges.
In this study, a new organic–inorganic nanocomposite (1,1′-(1,4-butanediyl)dipyridinium)3 [SiW11O39Ni(H2O)]/GO has been processed on GCE through electrochemical reduction method ((bdpy)SiW11Ni/P-ERGO/GCE). For this purpose, (bdpy)SiW11Ni/GO nanohybrid compound was deposited on a GCE by one-step drop-casting, followed by the electrochemical reduction of GO through chronoamperometry at a constant potential of −1.5 V (vs. Ag/AgCl), for 60 s, in a phosphoric acid solution (0.1 mol L−1) containing bdpy (1.0 mmol L−1). (bdpy)SiW11Ni can interact with P-ERGO via Pδ+ and π-electrons of bdpy without affecting the electronic structure of POM. Consequently, the presence of bdpy provides an additional advantage for increasing the loading of POM and improving the stability of nanocomposite film due to the strong electrostatic attraction between [SiW11Ni]6− and positively charged bdpy. Then, electrochemical and electrocatalytic behaviors, selectivity, repeatability, reproducibility of the proposed sensor for iodate (IO3−) determination, and also the recovery in the mineral water, tap water, and a commercial edible iodized salt were investigated.
2. Experiment
2.1. Materials and reagents
The K6[SiW11O39Ni(H2O)]·nH2O (SiW11Ni) was synthesized according to the previous literature.73 Tungstosilicic acid hydrate (H4SiW12O40·nH2O, HSiW), potassium acetate (CH3COOK), nickel(II) nitrate hexahydrate (Ni(NO3)2·6H2O), 1,1′-(1,4-butanediyl)dipyridinium dibromide (bdpy) ionic liquid, glacial acetic acid (CH3COOH), phosphoric acid (H3PO4), sulfuric acid (H2SO4), graphite powder (<20 μm), ethanol (C2H5OH), methanol (CH3OH), hydrogen peroxide (H2O2), potassium permanganate (KMnO4), potassium hexacyanoferrate(III) (K3[Fe(CN)6]), and potassium iodate (KIO3) with analytical grade were commercially purchased from Sigma or Merck companies. All solutions were prepared with deionized water (18 MΩ cm (25 °C), Milli Q, Millipore Inc.).2.2. Apparatus
Attenuated total reflectance-Fourier transform infrared (ATR-FTIR) spectra were acquired on a Spectrum Two spectrometer-PerkinElmer in the 2400–400 cm−1 wavenumber range. UV-vis absorption spectra of the SiW11Ni, bdpy and (bdpy)SiW11Ni were recorded using a Unico SQ-4802 double beam UV-vis spectrophotometer in a 1 cm matched quartz cell. The crystalline structures of the SiW11Ni, bdpy, (bdpy)SiW11Ni, GO, and (bdpy)SiW11Ni/GO were investigated by an X-ray diffraction technique (XRD, Panalytical X'pert PRO, The Netherlands) using Cu Kα radiation. The thermal features of bdpy, SiW11Ni, and (bdpy)SiW11Ni/GO were evaluated using thermogravimetric/differential thermal analysis (TGA/DTA, Rheometric Scientific STA 1500) under air flow in the temperature range of 25–800 °C at a heating rate of 10 °C min−1. Transmission electron microscope (TEM, EM10C-100 kV series, Zeiss Co., Germany) was used to study and compare the morphology of the (bdpy)SiW11Ni/GO with GO. The morphology and elemental analysis of the bare GCE and (bdpy)SiW11Ni/P-RGO/GCE were analyzed by field emission scanning electron microscopy (FE-SEM, SIGMA VP, Zeiss Co., Germany), coupled with energy-dispersive X-ray spectrometry (EDS) and EDS-mapping.2.3. Electrochemical measurements
The electrochemical measurements were carried out using an Autolab potentiostat (P/GSTAT 302N, Metrohm Autolab Eco-Chemie Utrecht, The Netherlands) equipped with GPES, version 4.9. A conventional three-electrode system was employed containing bare or modified GCE (GR-2S/N, Iran, Tehran, diameter 2 mm), an Ag/AgCl (3 mol L−1 KCl) electrode (Metrohm, Switzerland), and a platinum rod (IV-EL/EB-2200, Ivium, Eindhoven, The Netherlands) as working, reference and counter electrodes, respectively. Prior to the electrochemical experiments, high-purity argon gas (99.999%) was purged into the electrolytic cell solutions for 10 minute and covered by the Ar-atmosphere during the experiments. All experiments were done at ambient temperature.2.4. Preparation of (bdpy)3[SiW11O39Ni(H2O)]·nH2O ((bdpy)SiW11Ni)
First, a solution of 14.0 g of HSiW (4.72 mmol) in 50 mL distilled water at 95 °C was prepared. Then, a hot solution of 1.1 g Ni(NO3)2·6H2O (6.05 mmol) in 10 mL distilled water was added drop by drop, followed by a solution of 15.0 g CH3COOK in 15 mL hot distilled water (pH regulated to 7 with acetic acid). The stirred solution was kept at 95 °C for one minute and was quickly filtered. Then, the filtrate was cooled to 50 °C, and an equal volume of methanol was added. In continuous, solid bdpy ionic liquid was gradually added into the solution until no more precipitate formed. Finally, the light green powders of (bdpy)SiW11Ni were filtered, well washed with ethanol and diethyl ether, and dried at room temperature (yield ∼ 85%).2.5. Preparation of (bdpy)SiW11Ni/GO
GO was obtained from graphite powder using modified Hummer's method.74 A suspension of 30 mg GO in 10 mL of distilled water was prepared, followed by sonication (30 min) to form a uniform suspension. Then 1.5 g of (bdpy)SiW11Ni (0.34 mmol) was added. After sonication (20 min), the mixture was poured into a 100 mL Teflon-lined stainless-steel autoclave. The autoclave was transferred to an oven at 180 °C for 24 h. The obtained black precipitation ((bdpy)SiW11Ni/GO) was washed with distilled water and dried at 60 °C for 12 h in a vacuum oven.2.6. Fabrication of (bdpy)SiW11Ni/P-ERGO/GCE
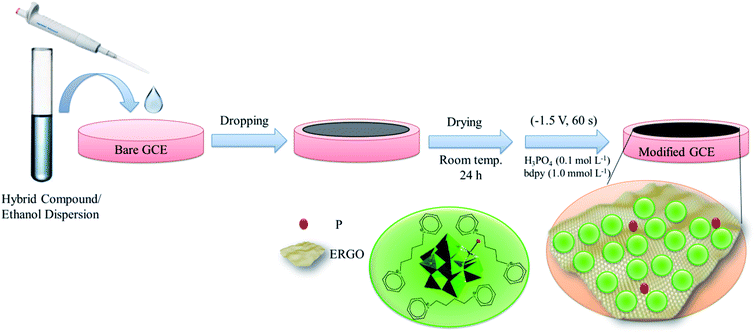
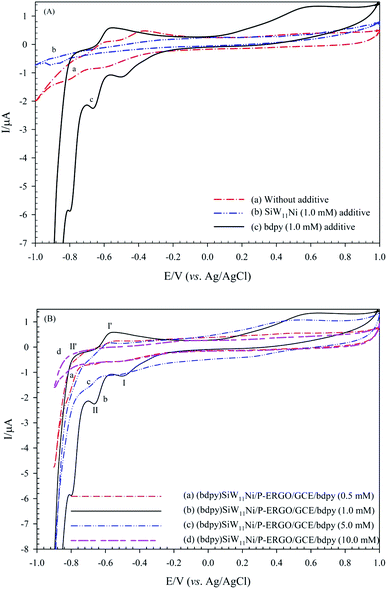
Before the electrode modification, the bare GCE was cleaned by polishing with 0.30 μm, 0.10 μm, and 0.05 μm α-Al2O3 slurries to elimination the adsorbed impurities. The polished electrode was sonicated in deionized water, ethanol, and deionized water bath, respectively, each for 5 minute. Then the GCE was treated with 0.5 mol L−1 H2SO4 solution by repeated cycling in the potential range from −1.0 to 1.0 V (vs. Ag/AgCl) until a stable CV was obtained, followed by the rinsing with deionized water and natural drying at room temperature. Next, 10 mg of as-prepared (bdpy)SiW11Ni/GO nanocomposite was dispersed in 5 mL of ethanol and sonicated for 30 minutes to get a homogenously dispersed solution. 5 μL of the (bdpy)SiW11Co/GO suspension was drop-casted on the cleaned bare GCE, and the solvent was removed under room temperature and washed with deionized water. Then, electrochemical reduction of GO to RGO was performed in 0.1 mol L−1 H3PO4 containing various concentrations of bdpy (0.5, 1.0, 5.0, and 10.0 mmol L−1) using chronoamperometry in the potential of −1.5 V at different times (30, 60, 90, and 120 s). A better analytical signal obtained in the presence of 1.0 mmol L−1 bdpy and at time 60 s. Hence, 1.0 mmol L−1 bdpy and time 60 s were used as optimum factors in the fabrication of the modified working electrode in all studies. For comparison, SiW11Ni/GCE, bdpy/GCE, (bdpy)SiW11Ni/GCE, and P-ERGO/GCE were prepared by the same method. The schematic illustration of the preparation procedure of the as-prepared modified electrode is shown in Scheme 1.2.7. Electrochemical procedure
The electrochemical measurements were carried out in a 90 mL electrochemical cell, containing 5 mL of HClO4 (0.1 mol L−1, pH 1.5) solution and various concentrations of IO3−. All the solutions within the cell were purged with high-pure argon for 10 minute before to the electrochemical analysis. The CV, square wave voltammetry (SWV), and amperometry techniques were used for the investigation of electrochemical behavior and electrocatalytic activity of the modified electrode in IO3− determination.3. Results and discussion
3.1. Characterization
The carbon, nitrogen, silicon, tungsten, and nickel content of (bdpy)SiW11Ni were analyzed by elemental analysis. Calculated values [%]: C: 13.96; N: 2.32; Si: 0.78; W: 56.02; Ni: 1.63. Experimental values [%]: C: 13.75; N: 2.38; Si: 0.72; W: 52.71; Ni: 1.67. The obtained results approve that experimental values agree with the theoretical values calculated based on formula (bdpy)3SiW11Ni. Moreover, the molar ratios of Si![[thin space (1/6-em)]](https://www.rsc.org/images/entities/char_2009.gif) :
:![[thin space (1/6-em)]](https://www.rsc.org/images/entities/char_2009.gif) W
W![[thin space (1/6-em)]](https://www.rsc.org/images/entities/char_2009.gif) :
:![[thin space (1/6-em)]](https://www.rsc.org/images/entities/char_2009.gif) Ni = 1
Ni = 1![[thin space (1/6-em)]](https://www.rsc.org/images/entities/char_2009.gif) :
:![[thin space (1/6-em)]](https://www.rsc.org/images/entities/char_2009.gif) 11.2
11.2![[thin space (1/6-em)]](https://www.rsc.org/images/entities/char_2009.gif) :
:![[thin space (1/6-em)]](https://www.rsc.org/images/entities/char_2009.gif) 1.1 prove that the Keggin structure of SiW11Ni has been retained throughout the functionalization with bdpy.
1.1 prove that the Keggin structure of SiW11Ni has been retained throughout the functionalization with bdpy.
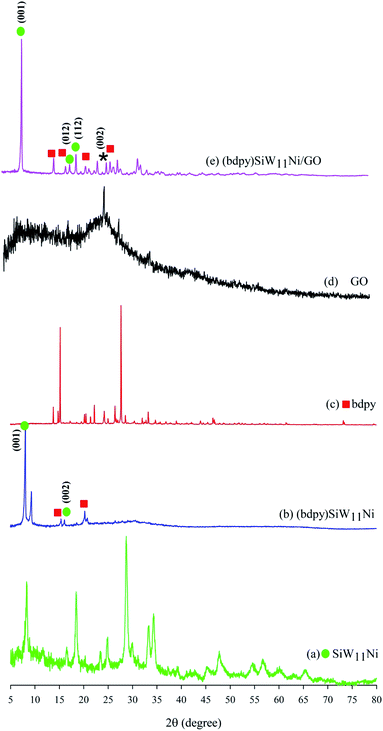
XRD analysis is done for the crystalline structure investigation of the (bdpy)SiW11Ni/GO. The XRD patterns of SiW11Ni, (bdpy)SiW11Ni, bdpy, GO, and (bdpy)SiW11Ni/GO are presented in Fig. 1. As displayed in Fig. 1b, (bdpy)SiW11Ni shows (001), and (002) diffraction peaks, which are located at 8.3°, and 16.5°, respectively of the SiW11Ni (Fig. 1a). Other obvious characteristic peaks, at 15.4°, and 20.2° can be credited to the bdpy ionic liquid (Fig. 1c). Fig. 1d is the XRD pattern of GO. Two relatively broad peaks are observed at 9.1° and 26.4°, which correspond to (001) and (002) reflections of GO and graphite existent in the structure of GO, respectively.75,76 In Fig. 1e, the characteristic XRD peaks of (bdpy)SiW11Ni/GO appeared at nearly similar locations without a significant shift in its peaks position compared to those of SiW11Ni. Additionally, the characteristic peaks at 26.4° (002), confirmed that (bdpy)SiW11Ni was immobilized on the GO surface. However, the peak (001) was not observed due to the overlap with the peak of SiW11Ni, which has a higher crystallinity.
The TGA/DTA diagrams for bdpy, SiW11Ni, and (bdpy)SiW11Ni/GO hybrid composite under the air atmosphere are shown in Fig. 2.
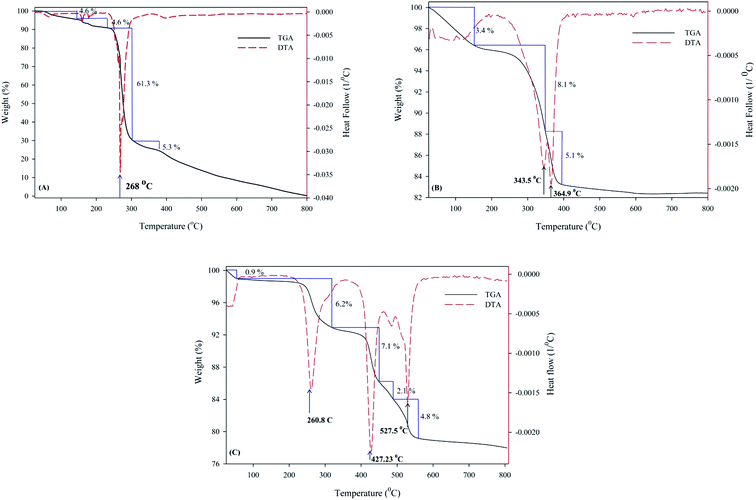 | ||
| Fig. 2 TGA-DTA curves of (A) bdpy, (B) SiW11Ni, and (C) (bdpy)SiW11Ni/GO in the temperature range of 25–800 °C at a heating rate of 10 °C min−1. | ||
As shown in Fig. 2A, bdpy shows a significant weight loss of about 61.3% at the temperature range of 250–320 °C (3rd peak of the DTA curve) that can be credited to the decomposition of pyridine rings.
The thermal analysis of SiW11Ni shows a slight weight loss (about 3.4%) at temperatures below 150 °C (1st peak of DTA), which may be related to eliminating adsorbed water molecules into SiW11Ni crystal lattice. A weight loss (about 13.2%) is observed in 150 to 384 °C temperature range during two steps (2nd and 3rd peak of DTA), which can be attributed to the removal water of crystallization from the crystal lattice of SiW11Ni. Above 400 °C, no significant change in mass is observed, indicating its high thermal stability up to 800 °C (Fig. 2B).
As shown in Fig. 2C, the thermal stability of the (bdpy)SiW11Ni/GO is entirely more than the parent bdpy but is slightly less than the original SiW11Ni. Below 250 °C, no major change in weight loss was observed which confirms that the amount of water in the hybrid material was reduced but not eliminated. A slight weight loss (0.9%) has appeared at 25–50 °C temperature range. Above 250 °C, two steps in weight loss 6.2% at 261 °C, and 14% at the temperature range of 331–557 °C are observed, correlated to the oxidative decomposition of bdpy, and GO, respectively.
The ATR-FTIR and UV-vis studies were also carried out, as shown in ESI (Fig. S1, Table S1, and Fig. S2).†
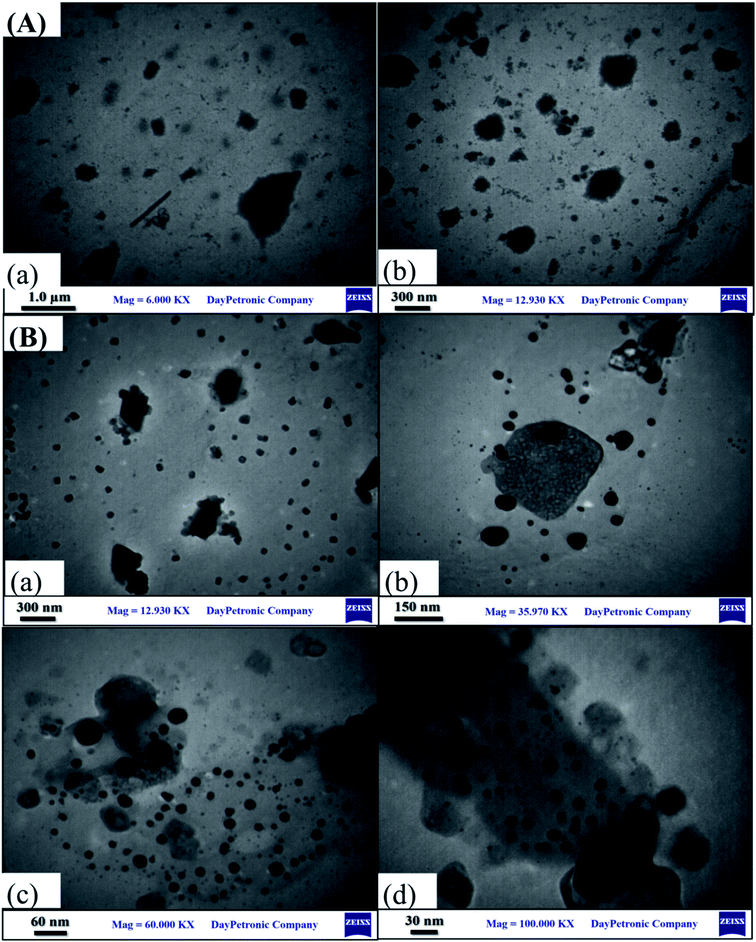
The TEM images of the GO and (bdpy)SiW11Ni/GO at different magnifications were presented in Fig. 3. TEM images of (bdpy)SiW11Ni/GO exhibit that (bdpy)SiW11Ni nanospheres were dispersed homogeneously on the GO surface. Indeed, such homogeneous dispersal of the (bdpy)SiW11Ni nanospheres on the surface of GO enhanced the electrochemical activity.
3.2. FE-SEM/EDS characterization of (bdpy)SiW11Ni/P-ERGO/GCE
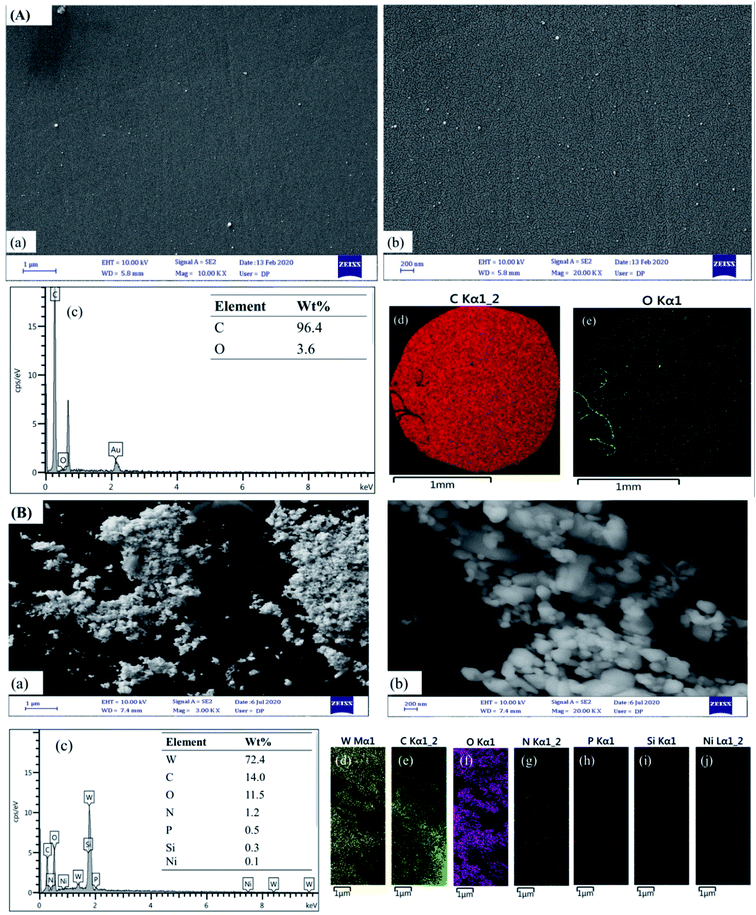
The surface morphology of the (bdpy)SiW11Ni/P-ERGO/GCE was characterized by FE-SEM. The FE-SEM images of the bare GCE (Fig. 4A(a and b)) have smooth and mirror surface, which was converted to heterogeneously and crudely surface after the modification with (bdpy)SiW11Ni/P-ERGO (Fig. 4B(a and b)). Furthermore, the EDS of the bare and modified GCE are displayed in Fig. 4A and B(c), respectively. The EDS spectra and elemental mappings approve the elemental composition, which confirms the presence of C, and O in the bare GCE (Fig. 4A(c–e)), and W, C, O, N, P, Si and, Ni elements on the (bdpy)SiW11Ni/P-ERGO/GCE (Fig. 4B(c–j)).3.3. Optimization of coating parameters
To gain a modified electrode with a rich electrochemical behavior, optimizing of experimental conditions is significantly necessary. Some essential factors, including type, and concentration of electrolyte additive were studied. These factors could have an impact on the electrochemical activity of the modified electrode. The following experiments were examined using CV in 0.1 mol L−1 H3PO4 supporting electrolyte at the potential of −1.5 V, and the deposition time 60 s.3.4. Electrochemical behavior of (bdpy)SiW11Ni/P-ERGO/GCE
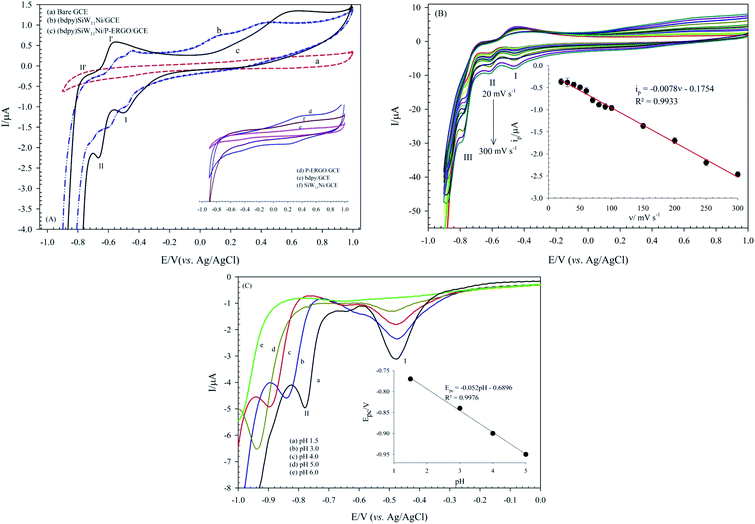
The electrochemical properties of the bare GCE, (bdpy)SiW11Ni/GCE, and (bdpy)SiW11Ni/P-ERGO/GCE were studied in 0.1 mol L−1 HClO4 electrolyte using CV technique (Fig. 6A(a–c) respectively). To better comparison, the CVs of the P-ERGO/GCE, bdpy/GCE, and SiW11Ni/GCE were displayed in inset of Fig. 6A(d–f) respectively.However, at the (bdpy)SiW11Ni/GCE, and (bdpy)SiW11Ni/P-ERGO/GCE appeared two pairs of pseudo-reversible peaks with the half-wave potentials (E1/2 = (Epa + Epc)/2) of −529 (I–I′), and −709 (II–II′) mV respectively, that correspond to the two sequential one-electron transfer processes of W6+ → W5+ → W4+. Also, as shown in Fig. 6A, there is a threefold increase of peak currents in the (bdpy)SiW11Ni/P-ERGO/GCE (curve (c)) compared to the (bdpy)SiW11Ni/GCE (curve (b)), and both factors confirm that the P-ERGO can promote the electron transfer between the GCE surface and the (bdpy)SiW11Ni in a more effective way. In contrast, at the bare GCE (curve (a)), bdpy/GCE (curve (e)), and SiW11Ni/GCE (curve (f)), no significant peak is observed under identical experimental conditions. At the P-ERGO/GCE (curve (d)), a broad redox peak appeared that was not in the potential range of electrochemical activity of (bdpy)SiW11Ni.
 | (1) |
3.5. Redox behavior of (bdpy)SiW11Ni/P-ERGO/GCE in presence of [Fe(CN)6]3−/4−
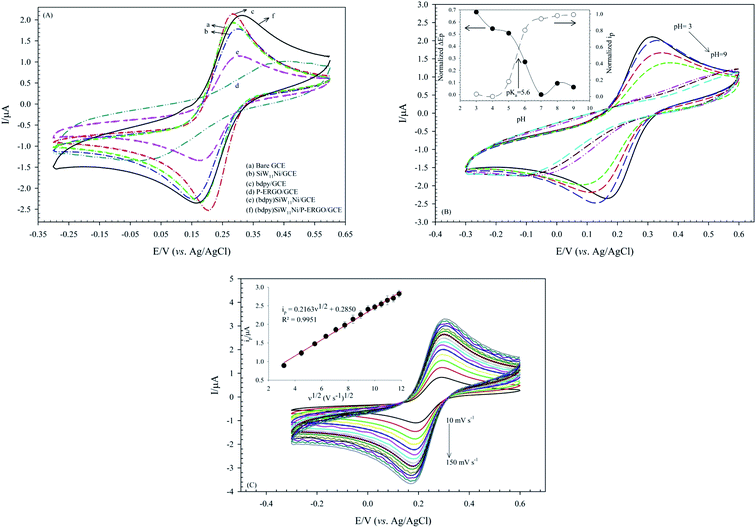
The interfacial electron transfer properties of the bare and modified GCEs were evaluated by [Fe(CN)6]3−/4− as a redox couple probe. The electron transfer kinetics of the Fe(CN)63−/4− at the interface of the modified GCEs depends on the electronic structure and thickness of the modifier.27 As shown in Fig. 7A, curve a displays an intact pair of redox peaks at the bare GCE with a ΔEp 102 mV and ipc 2.18 μA in Fe(CN)63−/4− solution in 10 mmol L−1 PBS (pH 3) containing 0.1 mol L−1 KCl. The immobilization of SiW11Ni or P-ERGO on the GCE leads to a significant increase in ΔEp and decrease of faradaic peak currents (ip) (Fig. 7A(b and d)). The SiW11Ni or P-ERGO film serves as a barrier layer and blocks the electron transfer between [Fe(CN)6]3−/4− and the surface of GCE. However, a smaller ΔEp supplemented by an increase of ip is found for the bdpy/GCE (Fig. 7A(c)). It indicates that the bdpy ionic liquid can improve the efficiency and rate of electron transfer at the GCE surface. The (bdpy)SiW11Ni/GCE shows a greater ΔEp than the bare GCE but smaller ΔEp than the parent SiW11Ni (Fig. 7A(e)). The better reversible behavior of (bdpy)SiW11Ni versus SiW11Ni can be credited to the presence of the bdpy ionic liquid, which owns excellent electrical conductivity.After modification of electrode by (bdpy)SiW11Ni/P-ERGO a meaning increase of ΔEp and decrease of ip compared with the bare GCE and also (bdpy)SiW11Ni due to the presence of P-ERGO can be observed in Fig. 7A(f). The obtained quantitative information from these voltammograms is illustrated in Table 1.
| Electrode | ΔE/mV ± SDa | ipc/μA ± SDa | ipa/μA ± SDa |
|---|---|---|---|
| a SD: standard deviation (from 3 data point). | |||
| Bare GCE | 102 ± 0.10 | 2.18 ± 0.12 | 2.04 ± 0.15 |
| SiW11Ni/GCE | 124 ± 0.11 | 2.01 ± 0.09 | 1.89 ± 0.06 |
| bdpy/GCE | 78 ± 0.09 | 2.20 ± 0.14 | 2.14 ± 0.08 |
| P-ERGO/GCE | 431 ± 2.21 | 0.60 ± 0.08 | 0.39 ± 0.04 |
| (bdpy)SiW11Ni/GCE | 115 ± 0.83 | 1.18 ± 0.21 | 1.05 ± 0.06 |
| (bdpy)SiW11Ni/P-ERGO/GCE | 130 ± 1.23 | 1.98 ± 0.09 | 1.75 ± 0.06 |
The obtained CVs of (bdpy)SiW11Ni/P-ERGO/GCE in 0.5 mmol L−1 [Fe(CN)6]3−/4− at different pHs (pH 3–9) are presented in Fig. 7B. As shown in Fig. 7B, with pH increasing, the ips decreases and the ΔEp increases, so that at pHs above 7, almost no peak is observed. This behavior is described as follows: pH-metric titration graphs using the drawing of variation of the ΔEp and ip of (bdpy)SiW11Ni/P-ERGO/GCE versus pH shows a surface pKa of 5.6, and resulting, a positive charge-state of the surface at lower pH values (inset of Fig. 7B). Therefore, it can be supposed that the decreases in ΔEp, as well as the increases in ips of the modified surface at acidic solutions have been affected by electrostatic interaction between the positively charged the surface of (bdpy)SiW11Ni/P-ERGO/GCE and [Fe(CN)6]3−/4− redox probe.
The effectively electroactive surface area of the (bdpy)SiW11Ni/P-ERGO/GCE was evaluated by performing CV measurement at the (bdpy)SiW11Ni/P-ERGO/GCE in 0.5 mmol L−1 [Fe(CN)6]3−/4− solution in 10.0 mmol L−1 PBS, pH 3 PBS, pH 3 containing 0.1 mol L−1 KCl at different scan rates in the range of 10–150 mV s−1 (Fig. 7C). According to the Randles–Sevcik equation,78,79 the surface area was calculated by eqn (2).
| ip = 2.69 × 10⁵n3/2AeffD1/20ν1/2Cp | (2) |
3.6. Electrocatalytic properties of (bdpy)SiW11Ni/P-ERGO/GCE
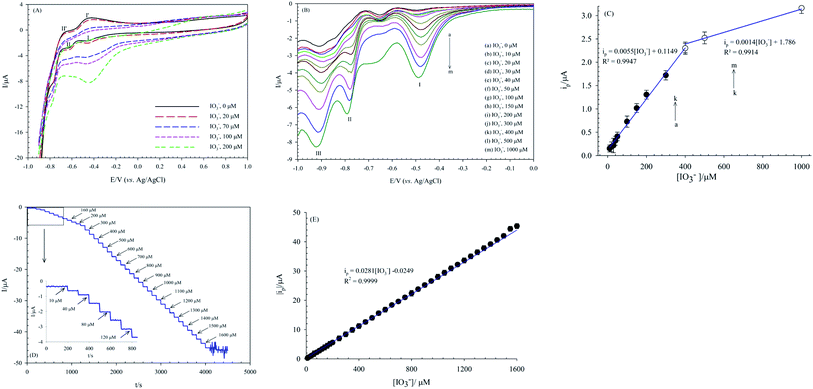
The electrocatalytic activity of the (bdpy)SiW11Ni/P-ERGO/GCE for IO3− electro-reduction was investigated by CV technique in 0.1 mol L−1 HClO4 aqueous solution (pH 1.5) containing different concentrations of IO3− (Fig. 8A). With the increasing concentrations of IO3−, the cathodic peak current at about −0.45 V (peak I) of the nanocomposite modified electrode gradually increased, whereas the corresponding oxidation peak current decreased, suggesting that (bdpy)SiW11Ni/P-ERGO/GCE would have a potential ability in the detection of IO3−. However, the CV method, due to essential defects such as low sensitivity and a high limit of detection (LOD), is insufficient for quantitative chemical analysis. Therefore, SWV and amperometry techniques, which benefit from low LOD and high sensitivity (small influence of background in analytical signal), were used for the sensitive measurement of IO3− at (bdpy)SiW11Ni/P-ERGO/GCE.The linear calibration range, LOD, and sensitivity of the suggested sensor for IO3− determination are compared with those in previous literatures80–91 (Table 2). The results proved that (bdpy)SiW11Ni/P-ERGO/GCE is an excellent platform for IO3− detection.
| Modified electrode | Sweep mode | Potential/V (vs. Ag/AgCl) | Linear range/μM | LOD/μM | Sensitivity/μA mM−1 | Ref. |
|---|---|---|---|---|---|---|
| a Poly(4-vinylpyridine).b N.R.—not recorded.c Ordered mesoporous carbon.d Carbon ionic liquid electrode.e Polybenzidine.f Polyaniline.g Poly(ethylenimine).h Poly(sodium-p-styrenesulfonate).i Indium tin oxide.j Clinoptilolite nanoparticles.k Carbon paste electrode.l Palladium nanoflowers.m Titanium oxide nanotubes. | ||||||
| PMo12-doped sol–gel film on GCE | Amperometry | −0.24 | 5–6000 | 1 | 8 | 80 |
| CoW11Co/PVPa/TiO2/GCE | Amperometry | −0.50 | 2–280 | 0.8 | N.R.b | 81 |
| Fe(III)P/MWCNTs/GCE | Amperometry | −0.15 | 10–4000 | 2.5 | 1.5 | 82 |
| P2Mo18/OMCc/GC | Amperometry | 0.00 | 1.13–6250 | 0.377 | 1.51 | 83 |
| PMo12 modified CILEd using [C8Py][PF6] | Amperometry | 0.08 | 10–1000 | 2.6 | 6.3 | 84 |
| GCE/MWCNTs/[C8Py][PF6]-PMo12 | Amperometry | 0.00 | 20–200 | 15 | 14 | 85 |
| Ag/PMo12/PBze/GCE | Amperometry | −0.03 | N.R. | 1.45 | 0.57 | 86 |
| Attapulgite/PANIf/PMo12/GCE | Amperometry | 0.00 | 2–520 | 0.53 | 300 | 87 |
| [PEIg/PSSh-Cu@AgNPs/PEI/P8W48]5/ITOi | Amperometry | −0.50 | 0.1–300 | 0.04 | 5.52 | 88 |
| Fe(II)-NClinj-CPEk | SWV | 0.47 | 4–100 | 0.64 | 67 | 89 |
| Carbon nanoparticles-poly(ortho-aminophenol)-modified electrode | Amperometry | N.R. | 500–6500 | 10 | 17.14 | 90 |
| PdNFl/TiO2NTm/Ti | Amperometry | −0.85 | 8.0–95.2 | 3.4 | 8.5 × 10³ | 91 |
| 95.2–666.6 | 5.0 × 10² | |||||
| 666.6–2065.0 | 1.0 × 10² | |||||
| (bdpy)SiW11Ni/P-ERGO/GCE | SWV | −0.47 | 10–400 | 2.4 × 10⁻³ | 5.50 | This work |
| 400–1000 | 9.3 × 10⁻² | 1.40 | ||||
| Amperometry | −0.40 | 10–1600 | 4.7 × 10⁻⁴ | 28.10 | ||
The electrocatalytic behavior of the nanocomposite modified GCE towards IO3− can be explained by the following mechanism, that is according to previous literature:80,81
| 3H4SiWV4WVI7Ni(H2O)O396− + IO3− → 3H2SiW2VW9VINi(H2O)O396− + I− + 3H2O | (3) |
| 3H6SiW6VW5VINi(H2O)O396− + IO3− → 3H4SiW4VW7VINi(H2O)O396− + I− + 3H2O | (4) |
3.7. Stability, repeatability, and reproducibility
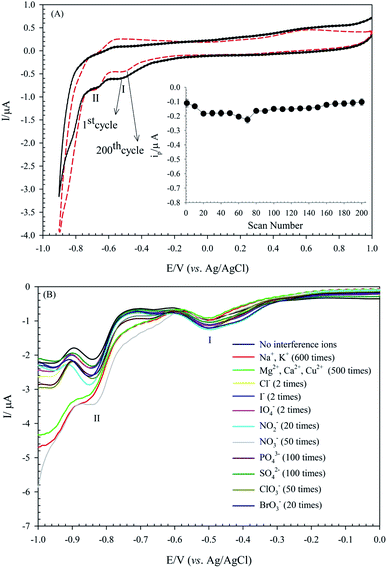
Achieving a high stability sensor or biosensor is one of the main goals of the analytical electrochemistry. The POMs-based modified electrodes are ordinarily stable in aqueous solutions in acidic pH. The stability of the (bdpy)SiW11Ni/P-ERGO/GCE was evaluated by recording successive CVs at the potential range of +1.0 to −0.9 V in 0.1 mol L−1 HClO4 solution at 50 mV s−1 and monitoring the changes in peak currents. As is shown in Fig. 9A, the cathodic peak I current of the modified electrode displays a small change with the current degradation of only 7.2% after 200 cycles.Furthermore, the long-term stability experiment using SWV was also performed by keeping the (bdpy)SiW11Ni/P-ERGO/GCE in the air at ambient conditions. The results showed that the peak I current of the modified electrode stayed at 96.12% of its primary current after ten days, 93.57% after 20 days, and 91.67% after one month, indicating the excellent long-term stability of the suggested sensor.
To validate the repeatability of the (bdpy)SiW11Ni/P-ERGO/GCE, four different voltammetry tests with one modified GCE surface were repeated in the presence of 500 μmol L−1 IO3−. Furthermore, four (bdpy)SiW11Ni/P-ERGO/GCEs were prepared under the same conditions to compare the response currents of IO3−. The values of relative standard deviation (RSD) of the response currents for the repeatability and reproducibility were 3.7% and 7.8%, respectively, which demonstrated that the modified electrode has excellent repeatability and reproducibility.
3.8. Interference study
The selective response is an essential characteristic for sensors that probe the sensor-selective response to an analyte in the presence of other species. For this purpose, the potential interferences for the IO3− detection on this sensor were studied by adding various potential interferents into HClO4 (0.1 mol L−1, pH 1.5) aqueous solution through the SWV method. The results are displayed in Table 3, and Fig. 9B. These results revealed an excellent selectivity of the (bdpy)SiW11Ni/P-ERGO/GCE nanocomposite to detect IO3− in complicated media.3.9. Analytical applications for real sample
The analytical applicability of the (bdpy)SiW11Ni/P-ERGO/GCE was validated by measuring IO3− content present in the mineral water (Dasani Mineral Water Co., Iran), tap water, and a commercial edible iodized salt (sample 1, 2, 3, respectively). The samples 1, and 2 were directly prepared in the HClO4 solution (0.1 mol L−1, pH = 1.5) without further treatment. For preparation of the sample 3, 15 mg of commercial iodized salt was dissolved in 100 mL deionized water. Then, it was diluted 27 times with 0.1 mol L−1 HClO4 (pH = 1.5) and then poured into the electrochemical cell without any pretreatment. The content of iodate in the solution was determined by the iodometric titration method as a standard method according to the procedure given in the previous literature.92 The measurements were performed using the standard addition method, by SWV in the potential range from 0 to −1.0 V, scan rate 50 mV s−1.The standard solutions of iodate were injected into the real samples to check the recovery percent of added iodate (found value/intrinsic value). The IO3− contents of iodized salt (sample 3) were compared with the values obtained by iodometric titration method as shown in Table 4, the obtained results are in good agreement with the results of the standard method with high accuracy and precision (recovery close to 100.00%). Therefore, the proposed modified electrode can be efficiently applied in detecting trace-level IO3− in real samples. The SWV of the (bdpy)SiW11Ni/P-ERGO/GCE for the determination of IO3− in these real samples was shown in the ESI (Fig. S3).†
| Sample | Originally/μM | Standard method | Spiked/μM | Found/μM | Recovery (%) ± SDa (n = 3) |
|---|---|---|---|---|---|
| a Standard deviation.b Mineral water, from local market.c Not detected.d Tap water.e Commercial edible iodized salt, from local market. | |||||
| 1b | NDc | — | 30.00 | 31.59 | 105.30 ± 1.2 |
| — | 70.00 | 69.02 | 98.60 ± 1.6 | ||
| 2d | ND | — | 20.00 | 21.12 | 105.60 ± 1.3 |
| — | 50.00 | 47.39 | 94.78 ± 1.4 | ||
| 3e | 50 | 56 | 50.00 | 109.80 | 109.80 ± 1.2 |
| 70.00 | 112.74 | 93.95 ± 1.5 | |||
4. Conclusions
A new hybrid organic–inorganic nanocomposite based on POMs and RGO has been fabricated, characterized, and reported as a capable electrocatalyst in the electrochemical detection of the iodate ion. The modified electrode revealed an excellent electrocatalytic activity towards the electro-reduction of iodate ion. The high stability, good repeatability and reproducibility, as well as simplicity of electrode preparation are the features of the proposed sensor. Furthermore, the modified electrode has specific characteristics such as low LOD (4.7 × 10⁻⁴ μmol L−1), high sensitivity (28.1 μA mM−1), good selectivity, and wide linear range (10–1600 μmol L−1) compared to other surfaces. Also, this sensor has been effectively applied for the monitoring of iodate in the real samples. All of these beneficial properties are favorable for high-performance iodate sensors.Conflicts of interest
There are no conflicts to declare.Acknowledgements
The authors gratefully acknowledge the financial support of this work by the Research Council of the University of Hormozgan.References
- Y. Tanaka, T. Hasegawa, T. Shimamura, H. Ukeda and T. Ueda, J. Electroanal. Chem., 2018, 828, 102–107 CrossRef CAS.
- L. Wang, T. Meng, J. Sun, S. Wu, M. Zhang, H. Wang and Y. Zhang, Anal. Chim. Acta, 2019, 1047, 28–35 CrossRef CAS.
- M. Chi, Z. Zhu, L. Sun, T. Su, W. Liao, C. Deng, Y. Zhao, W. Ren and H. Lü, Appl. Catal., B, 2019, 259, 118089 CrossRef CAS.
- Y. Jia, S. Sun, X. Cui, X. Wang and L. Yang, Talanta, 2019, 205, 120139 CrossRef CAS.
- L. Jing, J. Shi, F. Zhang, Y. Zhong and W. Zhu, Ind. Eng. Chem. Res., 2013, 52, 10095–10104 CrossRef CAS.
- Q. Huang, S. Ke, L. Qiu, X. Zhang and S. Lin, ChemCatChem, 2014, 6, 1531–1534 CrossRef CAS.
- S. Dianat, A. Bordbar, S. Tangestaninejad, S. Zarkesh-Esfahani, P. Habibi and A. A. Kajani, J. Iran. Chem. Soc., 2016, 13, 1895–1904 CrossRef CAS.
- S. Dianat, A.-K. Bordbar, S. Tangestaninejad, B. Yadollahi, R. Amiri, S.-H. Zarkesh-Esfahani and P. Habibi, J. Inorg. Biochem., 2015, 152, 74–81 CrossRef CAS.
- J. T. Rhule, C. L. Hill, D. A. Judd and R. F. Schinazi, Chem. Rev., 1998, 98, 327–358 CrossRef CAS.
- D.-Y. Du, J.-S. Qin, S.-L. Li, Z.-M. Su and Y.-Q. Lan, Chem. Soc. Rev., 2014, 43, 4615–4632 RSC.
- S. Omwoma, C. T. Gore, Y. Ji, C. Hu and Y.-F. Song, Coord. Chem. Rev., 2015, 286, 17–29 CrossRef CAS.
- A. Proust, B. Matt, R. Villanneau, G. Guillemot, P. Gouzerh and G. Izzet, Chem. Soc. Rev., 2012, 41, 7605–7622 RSC.
- Q. Wang, J. Khungwa, L. Li, Y. Liu, X. Wang and S. Wang, J. Electroanal. Chem., 2018, 824, 91–98 CrossRef CAS.
- F. Boussema, R. Haddad, Y. Ghandour, M. S. Belkhiria, M. Holzinger, A. Maaref and S. Cosnier, Electrochim. Acta, 2016, 222, 402–408 CrossRef CAS.
- S. Dianat, A. Hatefi-Mehrjardi, K. Mahmoodzadeh and S. Kakhki, New J. Chem., 2019, 43, 14417–14425 RSC.
- M. Ammam, J. Mater. Chem. A, 2013, 1, 6291–6312 RSC.
- Y. Z. Liu, W. Yao, H. M. Gan, C. Y. Sun, Z. M. Su and X. L. Wang, Chem.–Eur. J., 2019, 25, 16617–16624 CrossRef CAS.
- D. Martel, N. Sojic and A. Kuhn, J. Chem. Educ., 2002, 79, 349 CrossRef CAS.
- L. Adamczyk, J. Solid State Electrochem., 2017, 21, 211–222 CrossRef CAS.
- R. Ayranci, Y. Torlak, T. Soganci and M. Ak, J. Electrochem. Soc., 2018, 165, B638 CrossRef CAS.
- H. Yang, T. Song, L. Liu, A. Devadoss, F. Xia, H. Han, H. Park, W. Sigmund, K. Kwon and U. Paik, J. Phys. Chem., 2013, 117, 17376–17381 CAS.
- L. Ni, G. Yang, C. Sun, G. Niu, Z. Wu, C. Chen, X. Gong, C. Zhou, G. Zhao, J. Gu, W. Ji, X. Huo, M. Chen and G. Diao, Mater. Today Energy, 2017, 6, 53–64 CrossRef.
- L.-H. Gao, J.-F. Zhang, H.-L. Wang, X.-Y. Lin, J.-M. Qi and K.-Z. Wang, Electrochim. Acta, 2015, 166, 215–222 CrossRef CAS.
- H. Li, S. Pang, S. Wu, X. Feng, K. Müllen and C. Bubeck, J. Am. Chem. Soc., 2011, 133, 9423–9429 CrossRef CAS.
- C. P. Ponce, H. Y. Araghi, N. K. Joshi, R. P. Steer and M. F. Paige, Langmuir, 2015, 31, 13590–13599 CrossRef CAS.
- J. Ni, Q.-M. Fu, L. Liu, Z.-R. Gu, Z. Zhou, F.-B. Li, S.-X. Zhang, S.-Z. Liu and Z.-L. Du, Thin Solid Films, 2013, 537, 247–251 CrossRef CAS.
- S. Dianat, A. Hatefi-Mehrjardi and K. Mahmoodzadeh, New J. Chem., 2019, 43, 1388–1397 RSC.
- M. Blasco-Ahicart, J. Soriano-López, J. J. Carbó, J. M. Poblet and J.-R. Galan-Mascaros, Nat. Chem., 2018, 10, 24–30 CrossRef CAS.
- B. Suma, P. S. Adarakatti, S. K. Kempahanumakkagari and P. Malingappa, Mater. Chem. Phys., 2019, 229, 269–278 CrossRef CAS.
- W. Guo, X. Cao, Y. Liu, X. Tong and X. Qu, J. Electrochem. Soc., 2014, 161, B248 CrossRef.
- F.-Y. Yi, W. Zhu, S. Dang, J.-P. Li, D. Wu, Y.-h. Li and Z.-M. Sun, Chem. Commun., 2015, 51, 3336–3339 RSC.
- D.-C. Zhao, Y.-Y. Hu, H. Ding, H.-Y. Guo, X.-B. Cui, X. Zhang, Q.-S. Huo and J.-Q. Xu, Dalton Trans., 2015, 44, 8971–8983 RSC.
- J. M. Cameron, D. J. Wales and G. N. Newton, Dalton Trans., 2018, 47, 5120–5136 RSC.
- R. Wang, D. Jia and Y. Cao, Electrochim. Acta, 2012, 72, 101–107 CrossRef CAS.
- E. Rafiee and F. Mirnezami, J. Mol. Liq., 2014, 199, 156–161 CrossRef CAS.
- X. Wu, W. Wu, Q. Wu and W. Yan, Langmuir, 2017, 33, 4242–4249 CrossRef CAS.
- F. Faridbod, H. Rashedi, M. R. Ganjali, P. Norouzi and S. Riahi, Application of Room Temperature Ionic Liquids in Electrochemical Sensors and Biosensors, INTECH Open Access Publisher, 2011 Search PubMed.
- N. Thakur, S. Das Adhikary, M. Kumar, D. Mehta, A. K. Padhan, D. Mandal and T. C. Nagaiah, ACS Omega, 2018, 3, 2966–2973 CrossRef CAS.
- A. A. Ensafi, E. Heydari-Soureshjani, M. Jafari-Asl and B. Rezaei, Carbon, 2016, 99, 398–406 CrossRef CAS.
- D. M. Fernandes, M. Nunes, B. Bachiller-Baeza, I. Rodríguez-Ramos, A. Guerrero-Ruiz, C. Delerue-Matos and C. Freire, J. Solid State Electrochem., 2017, 21, 1059–1068 CrossRef CAS.
- J. Jiao, J. Zuo, H. Pang, L. Tan, T. Chen and H. Ma, J. Electroanal. Chem., 2018, 827, 103–111 CrossRef CAS.
- G. Bajwa, M. Genovese and K. Lian, ECS J. Solid State Sci. Technol., 2013, 2, M3046 CrossRef CAS.
- L. Hong, Y. Gui, J. Lu, J. Hu, J. Yuan and L. Niu, Int. J. Hydrogen Energy, 2013, 38, 11074–11079 CrossRef CAS.
- K. S. Novoselov, A. K. Geim, S. V. Morozov, D. Jiang, Y. Zhang, S. V. Dubonos, I. V. Grigorieva and A. A. Firsov, Science, 2004, 306, 666–669 CrossRef CAS.
- R. Tarcan, O. Todor-Boer, I. Petrovai, C. Leordean, S. Astilean and I. Botiz, J. Mater. Chem. C, 2020, 8, 1198–1224 RSC.
- G. He, H. Chen, J. Zhu, F. Bei, X. Sun and X. Wang, J. Mater. Chem., 2011, 21, 14631–14638 RSC.
- Y. Kim and S. Shanmugam, ACS Appl. Mater. Interfaces, 2013, 5, 12197–12204 CrossRef CAS.
- N. Mizuno and M. Misono, Chem. Rev., 1998, 98, 199–218 CrossRef CAS.
- A. Ucar, M. Findik, I. H. Gubbuk, N. Kocak and H. Bingol, Mater. Chem. Phys., 2017, 196, 21–28 CrossRef CAS.
- D. M. Fernandes, M. P. Araújo, A. Haider, A. S. Mougharbel, A. J. Fernandes, U. Kortz and C. Freire, ChemElectroChem, 2018, 5, 273–283 CrossRef CAS.
- J.-S. Li, Y. Wang, C.-H. Liu, S.-L. Li, Y.-G. Wang, L.-Z. Dong, Z.-H. Dai, Y.-F. Li and Y.-Q. Lan, Nat. Commun., 2016, 7, 1–8 Search PubMed.
- A. K. Cuentas-Gallegos, M. Lira-Cantú, N. Casañ-Pastor and P. Gómez-Romero, Adv. Funct. Mater., 2005, 15, 1125–1133 CrossRef CAS.
- J. Qin, F. Zhou, H. Xiao, R. Ren and Z.-S. Wu, Sci. China Mater., 2018, 61, 233–242 CrossRef CAS.
- H. Li, S. Pang, X. Feng, K. Müllen and C. Bubeck, Chem. Commun., 2010, 46, 6243–6245 RSC.
- H. Li, S. Pang, S. Wu, X. Feng, K. Müllen and C. Bubeck, J. Am. Chem. Soc., 2011, 133, 9423–9429 CrossRef CAS.
- J. Chen, S. Liu, W. Feng, G. Zhang and F. Yang, Phys. Chem. Chem. Phys., 2013, 15, 5664–5669 RSC.
- L. Cao, H. Sun, J. Li and L. Lu, Anal. Methods, 2011, 3, 1587–1594 RSC.
- D. Zhou and B.-H. Han, Adv. Funct. Mater., 2010, 20, 2717–2722 CrossRef CAS.
- W. Guo, X. Tong and S. Liu, Electrochim. Acta, 2015, 173, 540–550 CrossRef CAS.
- L. Chen, Y. Tang, K. Wang, C. Liu and S. Luo, Electrochem. Commun., 2011, 13, 133–137 CrossRef CAS.
- M. Jiang, D. Zhu, J. Cai, H. Zhang and X. Zhao, J. Phys. Chem., 2014, 118, 14371–14378 CAS.
- Y. Mai, M. Zhou, H. Ling, F. Chen, W. Lian and X. Jie, Appl. Surf. Sci., 2018, 433, 232–239 CrossRef CAS.
- M. Mirzaee, C. Dehghanian and K. S. Bokati, J. Electroanal. Chem., 2018, 813, 152–162 CrossRef CAS.
- K. Gopalakrishnan, S. Sultan, A. Govindaraj and C. Rao, Nano Energy, 2015, 12, 52–58 CrossRef CAS.
- D. Zhang, Y. Zhang, Y. Luo, Y. Zhang, X. Li, X. Yu, H. Ding, P. K. Chu and L. Sun, Nano Res., 2018, 11, 1651–1663 CrossRef CAS.
- R. Ding, J. Zhang, J. Qi, Z. Li, C. Wang and M. Chen, ACS Appl. Mater. Interfaces, 2018, 10, 13470–13478 CrossRef CAS.
- J. Wang, L. Shen, H. Li, X. Wang, P. Nie, B. Ding, G. Xu, H. Dou and X. Zhang, Electrochim. Acta, 2014, 133, 209–216 CrossRef CAS.
- N. Lingappan and D. J. Kang, Electrochim. Acta, 2016, 193, 128–136 CrossRef CAS.
- K. Bindumadhavan, P.-Y. Chang and R.-a. Doong, Electrochim. Acta, 2017, 243, 282–290 CrossRef CAS.
- Z.-J. Lu, S.-J. Bao, Y.-T. Gou, C.-J. Cai, C.-C. Ji, M.-W. Xu, J. Song and R. Wang, RSC Adv., 2013, 3, 3990–3995 RSC.
- S. Bag, B. Mondal, A. K. Das and C. R. Raj, Electrochim. Acta, 2015, 163, 16–23 CrossRef CAS.
- Z. Wang, P. Li, Y. Chen, J. He, J. Liu, W. Zhang and Y. Li, J. Power Sources, 2014, 263, 246–251 CrossRef CAS.
- T. Weakley and S. Malik, J. Inorg. Nucl. Chem., 1967, 29, 2935–2944 CrossRef CAS.
- D. C. Marcano, D. V. Kosynkin, J. M. Berlin, A. Sinitskii, Z. Sun, A. Slesarev, L. B. Alemany, W. Lu and J. M. Tour, ACS Nano, 2010, 4, 4806–4814 CrossRef CAS.
- S. Bykkam, K. Rao, C. Chakra and T. Thunugunta, Int. J. Adv. Biotechnol. Res., 2013, 4, 142 Search PubMed.
- N. Raghavan, S. Thangavel and G. Venugopal, Mater. Sci. Semicond. Process., 2015, 30, 321–329 CrossRef CAS.
- L. R. Faulkner and A. J. Bard, Electrochemical Methods: Fundamentals and Applications, John Wiley and Sons, 2002 Search PubMed.
- Z. Liu, M. Jin, J. Cao, J. Wang, X. Wang, G. Zhou, A. van den Berg and L. Shui, Sens. Actuators, B, 2018, 257, 1065–1075 CrossRef CAS.
- D. Zhu, H. Ma, Q. Zhen, J. Xin, L. Tan, C. Zhang, X. Wang and B. Xiao, Appl. Surf. Sci., 2020, 146721 CrossRef CAS.
- W. Song, X. Chen, Y. Jiang, Y. Liu, C. Sun and X. Wang, Anal. Chim. Acta, 1999, 394, 73–80 CrossRef CAS.
- Y. Li, W. Bu, L. Wu and C. Sun, Sens. Actuators, B, 2005, 107, 921–928 CrossRef CAS.
- A. Salimi, H. MamKhezri, R. Hallaj and S. Zandi, Electrochim. Acta, 2007, 52, 6097–6105 CrossRef CAS.
- M. Zhou, L.-p. Guo, F.-y. Lin and H.-x. Liu, Anal. Chim. Acta, 2007, 587, 124–131 CrossRef CAS.
- B. Haghighi and H. Hamidi, Electroanalysis, 2009, 21, 1057–1065 CrossRef CAS.
- B. Haghighi, H. Hamidi and L. Gorton, Electrochim. Acta, 2010, 55, 4750–4757 CrossRef CAS.
- A. Manivel, R. Sivakumar, S. Anandan and M. Ashokkumar, Electrocatalysis, 2012, 3, 22–29 CrossRef CAS.
- S. Zhang, P. He, W. Lei and G. Zhang, J. Electroanal. Chem., 2014, 724, 29–35 CrossRef CAS.
- J. Zuo, N. Gao, Z. Yu, L. Kang, K. P. O'Halloran, H. Pang, Z. Zhang and H. Ma, J. Electroanal. Chem., 2015, 751, 111–118 CrossRef CAS.
- M. Nosuhi and A. Nezamzadeh-Ejhieh, J. Electroanal. Chem., 2018, 810, 119–128 CrossRef CAS.
- J. Pishahang, H. B. Amiri and H. Heli, Sens. Actuators, B, 2018, 256, 878–887 CrossRef CAS.
- F. Koohi, H. R. Zare and Z. Shekari, Microchem. J., 2020, 159, 105425 CrossRef CAS.
- M. Vithanage, I. Herath, S. Achinthya, T. Bandara, L. Weerasundara, S. Mayakaduwa, Y. Jayawardhana and P. Kumarathilaka, Arch. Public Health, 2016, 74, 21 CrossRef.
Footnote |
| † Electronic supplementary information (ESI) available. See DOI: 10.1039/d1ra00845e |
| This journal is © The Royal Society of Chemistry 2021 |

