 Open Access Article
Pre-clinically evaluated visual lateral flow platform using influenza A and B nucleoprotein as a model and its potential applications†
Natpapas Wiriyachaiporn *a,
Siriwan Sirikaewa,
Nawakarn Chitchaiab,
Pareena Janchompooc,
Weerakanya Maneeprakorn
 a,
Suwussa Bamrungsap
 a,
Ekawat Pasomsubc and
Deanpen Japrung
 a
a
aNational Nanotechnology Center (NANOTEC), National Science and Technology Development Agency (NSTDA), PathumThani, 12120, Thailand. E-mail: natpapas@nanotec.or.th
bFaculty of Pharmacy, Thammasat University, Thailand
cDepartment of Pathology, Faculty of Medicine Ramathibodi Hospital, Mahidol University, Bangkok, Thailand
First published on 24th May 2021
Abstract
A visual colorimetric rapid screening system based on a lateral flow device for simultaneous detection and differentiation between influenza A and B nucleoprotein as a model was developed. Monoclonal antibodies, specific for either influenza A or B nucleoproteins, were evaluated for their reactivities and were used as targeting ligands. With the best antibody pairs selected, the system exhibited good specificity to both viruses without cross reactivity to other closely related respiratory viruses. Further semi-quantitative analysis using a strip reader revealed that the system is capable of detecting influenza A and B protein content as low as 0.04 and 1 ng per test, respectively, using a sample volume as low as 100 μL, within 10 minutes (R2 = 0.9652 and 0.9718). With a performance comparison to the commercial tests, the system demonstrated a four-to-eight-fold higher sensitivity. Pre-clinical evaluation with 101 nasopharyngeal swabs reveals correlated results with a standard molecular approach, with 89% and 83% sensitivity towards influenza A and B viruses, and 100% specificity for both viruses.
Introduction
The recent coronavirus outbreak has brought to our attention the impact of acute respiratory tract infections. Of these respiratory pathogens, influenza remains one of the most highly contagious respiratory illnesses, affecting people of all ages worldwide. Despite being distinguished by seasonal epidemics, affecting 5–15% of the world population, occasional pandemic outbreaks usually take place every 10–15 years. This is due to the emergence of new strains caused by mutation of the strains circulating in the community.1 It was reported that at least 3–5 million people have severe illnesses with complications and need further hospitalization, whilst there are approximately 250![[thin space (1/6-em)]](https://www.rsc.org/images/entities/char_2009.gif) 000–500
000–500![[thin space (1/6-em)]](https://www.rsc.org/images/entities/char_2009.gif) 000 deaths from influenza annually.2 This raises an awareness of economical and health burdens caused by both epidemic and pandemic influenza outbreaks. In order to apply a preventive and effective treatment strategy, early diagnosis is urgently needed.3
000 deaths from influenza annually.2 This raises an awareness of economical and health burdens caused by both epidemic and pandemic influenza outbreaks. In order to apply a preventive and effective treatment strategy, early diagnosis is urgently needed.3
Clinical diagnosis of respiratory illnesses based on clinical symptoms alone can be limited due to the overlapping symptoms of influenza-like illness (ILI) caused by different viral pathogens, including respiratory syncytial virus (RSV), rhinovirus, adenovirus, coronavirus, metapneumovirus, bocavirus, enterovirus, and parainfluenza virus.3,4 To screen and diagnose patients with influenza virus infection, a number of different laboratory techniques, including conventional viral culture approach, molecular assays, serological method, immunofluorescence staining, and rapid antigen diagnostic tests, have been used.5–7 Whilst viral culture and molecular assays provide the information regarding the identification of the outbreak strain and subtypes, serological method and immunofluorescence staining technique are useful for a detection and identification of antibodies to seasonal influenza viruses and the specific isolates. Although these techniques provide useful information, they are time-consuming techniques and their usefulness as a screening test often limited by the sophisticated step, expensive equipment, laboratory facilities, and expertise of the trained personnel.8 To overcome these limitations, rapid testing can be more useful as a screening tool to prevent the seasonal episodes, control the outbreaks, and prepare for the next pandemic.
Of those technologies developed for a rapid pathogen detection i.e. isothermal nucleic acid amplification, microfluidic, three-dimensional nanostructured substrates, and mobile handheld technologies,9–13 and lateral flow immunoassay, the latter technique has been used increasingly as POC and point-of-need applications,14 especially in low-resource settings where laboratory facilities are limited.15,16 These include the tests on biomarkers,17 infectious agents,18 and toxic compounds.19–21 The main advantage of lateral flow technique is its simplicity, rapidity, and inexpensiveness. Within the system, different labels have been employed to facilitate the detection;22 for example, including fluorescent-based system using fluorescent dyes/nanoparticles,23 SERS-based system using anisotropic metal nanoparticles,24 signal amplification-based system using enzyme as labels.25 However, these systems have limitations in requiring additional steps and instruments, restraining their POC applications.26 To achieve rapid screening purposes, simple system using gold nanoparticles (GNP) as labels has been extensively used for direct visual detection.27,28
Previously, rapid testing for screening respiratory pathogens, including influenza viruses, have been widely used. Differences in diagnostic sensitivity and specificity can be observed in difference assays. For example, Han et al., reported the pooled sensitivity and specificity of 0.84 and 0.97, respectively, for such tests based on lateral flow immunoassay technique.29 On the other hand, the tests can be valuable alternative method for a rapid screening due to its ease-of-use, rapidity, and applicability in POC applications. The test; therefore, can be helpful for diagnostic and treatment decision in clinical settings.30–32
Here, a visual colorimetric rapid screening system, based on lateral flow device for a simultaneous detection and differentiation between influenza A and B viruses as a model, was developed. To target the virus, influenza A and B nucleoproteins were selected as the target protein molecules. Of those influenza proteins, nucleoprotein is recognized as one of the most conserved proteins in the virus virion.33,34 Using an in-house treatment and assembly of lateral flow strip test, the selection of targeting ligands, and the use of GNP as reporters, the system provides a ready-to-use platform for a direct visualization within 10 minutes, without the need of extra resources. The performance of the system is evaluated for its sensitivity and specificity, compared to that obtained from the available commercial tests. Subsequently, the system is pre-clinically evaluated with clinical specimens, correlated to molecular approach, to assess its application as an influenza screening tool. With the use of lateral flow device for detecting multiple targets, the system can be developed and applied as a rapid screening tool for respiratory illnesses caused by other pathogens.
Results and discussion
Verification of protein antigens and antibodies
Principle of detection
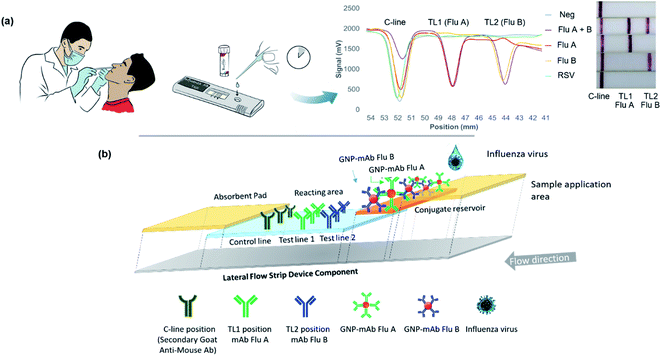
Schematic diagram depicted in Fig. 1a illustrated the application of the developed system for screening influenza A and B antigens in one test. The components of the system, which consisted of sample application area, conjugate reservoir area, signal detection area, and absorbent pad was also illustrated in Fig. 1b. The principle integrates a specific recognition between the target antigen and the selected mAb pair, and a separation of the target molecules through the mean of chromatography. To enable a simple and direct visualization, GNP was used as reporter molecules. Within the device, a specific capture of influenza A and B virus antigens was achieved simultaneously through antibody–antigen complexation. As a sample migrated along the device, the target proteins were recognized by the GNP–mAb conjugates functioned as the detector probe. The complexes were then flowed and captured by the mAb immobilized on the test line (T-line) position of the reacting area. The excess conjugates were then flowed along the device and captured by the secondary antibody on the control line (C-line) position. The presence of both T-line and C-line signal indicated a positive result, meanwhile the presence of the C-line only can be referred to as negative result.Characterization of the GNP–mAb conjugates
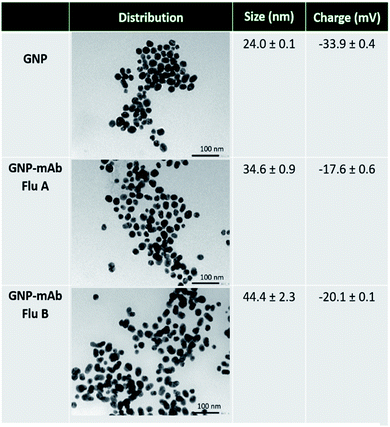
Monodispersed spherical GNP were synthesized and obtained. Transmission electron microscopy (TEM) and dynamic light scattering (DLS) analysis were used to characterize the particles. Fig. 2 reveals TEM images of the particles, demonstrating that the particles before and after conjugation to either mAb specific to influenza A or B virus were homogenously dispersed. Using DLS analysis, it is also shown that the average hydrodynamic size of the plain particles was 24.0 ± 0.1 nm, whilst the size of particles after conjugated to mAb specific to influenza A and mAb specific to influenza B were 34.6 ± 0.9 nm and 44.4 ± 2.3 nm, respectively. DLS data for the size distribution of GNP before and after antibody conjugation were shown in Fig. S2, ESI.† To further characterize the particles, the zeta potential of the particles was determined. While the plain particles displayed a negative zeta potential of −33.9 ± 0.4 mV, the particles after conjugated to mAb specific to influenza A and mAb specific to influenza B exhibited −17.6 ± 0.6 mV and −20.1 ± 0.1 mV, respectively. The increased in the size and charge of the particles after conjugation suggested that the conjugation was successful.Subsequently, the particles were characterized for the change in absorption spectrum. Fig. S3 (ESI†) showed the maximum of the absorption peak (Amax) at 526 nm of the plain particles. Further, the particles showed Amax at 532 and 534 nm after conjugated to mAb specific to influenza A and B, respectively. A small red-shift of the Amax indicated the successful of the conjugation. In the presence of high salt concentration, the conjugated particles were observed to be stable, as shown by an unchanged in colour. In contrast, the particles without the conjugation were shown to be aggregated, resulting in a change in color and a shift in Amax at 822 nm.
Performance of the system
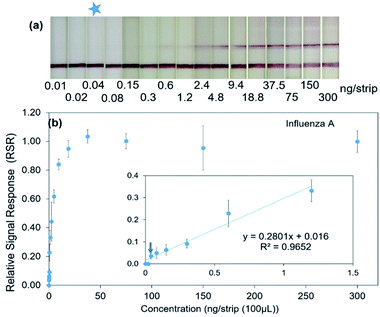
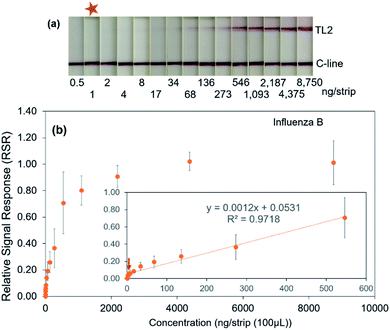
Further attempt to determine the limit of detection (LOD) for influenza A and B virus proteins was performed using influenza A and B proteins prepared in a 2-fold serial dilution ranged from 0–300 ng per test for influenza A protein and 0–8750 ng per test for influenza B protein, respectively. Fig. 3a shows the signal visualization at TL1 against influenza A protein concentration. Under optimal condition, it was showed that the TL1 signal decreased gradually when the protein was serially diluted until 0.04 ng per test (Fig. 3a). Similarly, the signal visualization upon the addition of influenza B proteins was also displayed with the limit of detection at 1 ng per test (Fig. 4a). In the absence of the target protein, only C-line signal was detected in both cases. In contrast, a high concentration of the target protein caused the formation of the sandwich immunocomplex between mAb–antigen, inducing the accumulation of GNP–mAb conjugates at the T-line. This subsequently enables direct signal visualization at the T-line position.
Subsequently to a direct visualization, semi-quantitative analysis using the reader was performed. Fig. 3b and 4b displayed the relationship between the target protein concentration and the relative signal response (RSR) for influenza A and B proteins, respectively. The linear relationship in the range of 0–1.2 ng per test (R2 = 0.9652) for influenza A protein is demonstrated (Fig. 3b, inset figure). Similarly, the system also exhibited the linear relationship when the influenza B protein was added in the range of 0–546 ng per test (R2 = 0.9718) (Fig. 4b, inset figure). The results showed that with a sample volume of 100 μL, the system was able to detect influenza A and B proteins as low as 0.04 and 1 ng, respectively.
Pre-clinical evaluation of the system
Further to the performance evaluation of the system, 101 clinical specimens, including 44 influenza negative, 45 influenza A positive, 12 influenza B positive samples, were used to evaluate the performance of the system, as described previously. No signal was detectable in all influenza negative samples. Of those 45 influenza A positive samples, distinct signals at TL1 and C-line positions was observed in 40 samples, matched with those tested by commercial fluorescence-based rapid test. The other 5 samples revealed a weak TL1 signal, leading to a cut-off as a negative result. With this analysis, the sensitivity and specificity of the test for screening influenza A virus were reported to be 89% and 100%, with a positive predictive value (PPV), a negative predictive value (NPV), and percent accuracy were reported to be of 100%, 90%, and 94% (Table 1 and Fig. S6, ESI†).| Test system performance (%) | |||||
|---|---|---|---|---|---|
| Sensitivity | Specificity | PPV | NPV | Accuracy | |
| Influenza A | 88.8 | 100 | 100 | 89.8 | 94.4 |
| Influenza B | 83.3 | 100 | 100 | 95.7 | 96.4 |
With respect to influenza B positive samples, it was reported that 10 out of 12 influenza B positive samples showed correlated results with those obtained from commercial fluorescent-based test and PCR method (molecular approach). The other two samples demonstrated weak TL2 signal, resulting in a negative result interpretation. This revealed the sensitivity and specificity of the developed tests for screening influenza B virus were reported to be 83% and 100%, respectively, while the PPV, NPV, and percent accuracy were reported to of 100%, 96%, and 96%, respectively (Table 1 and Fig. S6, ESI†).
It may be also worthwhile to further discuss the differences between the developed system and other systems. Previous studies reported different technologies used in detecting influenza virus. The most common technique used for influenza virus screening and detection is commonly shown to be molecular based approach, in which the technique is relied upon the amplification of the virus RNA. Regarding other rapid POC technologies, the technique is often integrated with other signal amplification technologies to enhance the sensitivity i.e. the use of gold nanoparticles, microfluidic chip, and fluorescent technologies.37–39 Despite the high sensitivity, these technologies are laborious techniques and often require highly-trained personnel and instrument during analysis and result visualization processes. Particularly, they are still time-consuming methods. With respects to these factors, lateral flow platform offers advantages in its simplicity, and rapidity, and sensitive for a rapid POC screening purposes.
Experimental
Materials and reagents
Primary mouse monoclonal antibodies against influenza A nucleoprotein and influenza B nucleoprotein, secondary anti-mouse monoclonal with and without alkaline phosphatase enzyme (ALP) conjugation antibodies, and all respiratory virus protein antigens including recombinant influenza A nucleoprotein, influenza B virus-infected Madin–Darby Canine Kidney (MDCK) Cell lysate, RSV, parainfluenza virus, and adenovirus proteins were supplied from Fitzgerald, MA, USA, East Coast Bio, TN, USA, and Meridian Life Sciences, TN, USA, and Seracare (MA, USA). Forty-percent acrylamide/bis solution (29![[thin space (1/6-em)]](https://www.rsc.org/images/entities/char_2009.gif) :
:![[thin space (1/6-em)]](https://www.rsc.org/images/entities/char_2009.gif) 1) was supplied from Bio-Rad Laboratories Inc. (CA, USA). Reagents used in sodium dodecyl sulfate–polyacrylamide gel electrophoresis (SDS–PAGE) and western blotting analyses including 5-bromo-4-chloro-3-indolyl phosphate (BCIP)/nitro blue tetrazolium (NBT), and device components were purchased from Merck Millipore (MA, USA). Bovine serum albumin (BSA), ammonium sulfate, β-mercaptoethanol, and coomassie brillant blue R250 solution were supplied from Sigma-Aldrich (MO, USA). All other chemicals and tested proteins were of analytical grade were supplied from Sigma-Aldrich (MO, USA), unless stated otherwise. Ultrapure water (18.25 MΩ cm) were obtained using Milli-Q system (Merck Millipore) and used throughout the experiments.
1) was supplied from Bio-Rad Laboratories Inc. (CA, USA). Reagents used in sodium dodecyl sulfate–polyacrylamide gel electrophoresis (SDS–PAGE) and western blotting analyses including 5-bromo-4-chloro-3-indolyl phosphate (BCIP)/nitro blue tetrazolium (NBT), and device components were purchased from Merck Millipore (MA, USA). Bovine serum albumin (BSA), ammonium sulfate, β-mercaptoethanol, and coomassie brillant blue R250 solution were supplied from Sigma-Aldrich (MO, USA). All other chemicals and tested proteins were of analytical grade were supplied from Sigma-Aldrich (MO, USA), unless stated otherwise. Ultrapure water (18.25 MΩ cm) were obtained using Milli-Q system (Merck Millipore) and used throughout the experiments.
Clinical specimens
Clinical nasopharyngeal swab samples used in the evaluation were provided from Virology Unit, Department of Pathology, Faculty of Medicine, Ramathibodi Hospital, Bangkok, Thailand. After sample collection, the swabs were collected in the UTM™ transport medium (Copan Diagnostics, CA, USA). The samples were collected with full ethical approval granted by the University Ethics Committee. One hundred and one nasopharyngeal swab samples were collected from 101 patients, who had influenza-like illness symptoms. Of these 101 samples, 45 samples were diagnosed as influenza A virus positive, 12 samples were diagnosed as influenza B virus positive, and 44 samples were diagnosed as both influenza A and B virus negative using commercial fluorescent rapid test and molecular approach (PCR), as reference tests. Regarding molecular approach, samples were subjected to nucleic acid extraction and amplification using MagDeA® Dx SV (Precision System Science, Chiba, Japan) and RealStar® Influenza Screen & Type RT-PCR kit 4.0 (Altona-Diagnostics GmbH, Hamburg, Germany), respectively. Subsequent to the screening using the reference tests, the samples were immediately stored at −80 °C until further use.Instruments
UV-Vis absorption spectra was recorded using a microplate reader (Power wave XS2, Bio-Tek, USA). Transmission electron microscopy (TEM) were taken on a JEM-2010 (JEOL, Japan). Surface charge of GNPs was determined by a Zetasizer (Malvern Instruments, UK). The CM4000 guillotine cutting module and the dispensing platform were obtained from BioDot (CA, USA). ESEQuant LR3 lateral flow device reader was obtained from Qiagen, Hilden, Germany.Verification of protein antigens and antibodies
Gold nanoparticles synthesis
Gold nanoparticles (GNP) with the absorption maxima (Amax) at 526 nm was prepared by citrate reduction method according to a protocol described previously.42 Briefly, 100 mL of 0.01% (w/v) tetrachloroauric acid was heated to reflux with continuous stirring, and 1 mL of 1% (w/v) trisodium citrate was rapidly added. The solution was boiled and stirred continuously until the color changed gradually from bright yellow to deep red. The reaction mixture was cooled and stored at 4 °C.Preparation of GNP–mAb conjugates
The preparation of GNP–mAb conjugates was performed by using passive adsorption method and can be described in the following procedures. Briefly, the stock suspension of spherical GNP was homogenized in sonication bath before diluted to different folds with ultrapure water. Determination of the optimal conditions was achieved using the method, as described previously.43 The mAb was conjugated to GNP to produce ‘the detector probe’. For large scale conjugate production, the procedure was described as follows: briefly, a desired amount of mAb was mixed gently with 1 mL of GNP solution (optical density, O.D., at 542 nm (Amax) = 1.0). Under continuous gentle mixing, the mixture was left to react for 30 min at RT, followed by the addition of 10% (w/v) BSA in 20 mM borate buffer, pH 9. After incubation, the conjugates were then collected by centrifugation at 4400 × g at 4 °C for 5 min before resuspending in 1% (w/v) BSA, in 20 mM borate buffer, pH 9. The final conjugates were then stored at 4 °C until used. In addition to TEM and DLS analysis, further characterization of the particles before and after conjugation was performed using induce particle aggregation method.43,44Fabrication and assembly of the lateral flow device
Fabrication and the assembly of all the components of the lateral flow device can be illustrated as shown in Fig. 1. The device consists of four main components including sample application pad, conjugate reservoir pad, reacting nitrocellulose membrane, and absorbent pad, which are assembled together in a plastic housing cassette. To prepare the reacting membrane, mAb used a capture antibody and secondary anti-mouse antibody in a desired amount were dispensed onto the reacting membrane to form the test- and control lines, respectively, with a distance of 5 mm from each other. With multiplexed lateral flow device, the mAb specific to the influenza A proteins and the mAb specific to the influenza B proteins were dispensed with a distance of 5 mm from each other and were designated as TL1 and TL2, respectively. For conjugate reservoir pad preparation, a desired volume of the conjugates was loaded on the conjugate reservoir pad. For lateral flow device assembly, all components were assembly in a manner as depicted in Fig. 1, with the overlapping between each component of 2 mm.Performance evaluation of the system and assay procedures
| RSR = (Tav)/(Pav) |
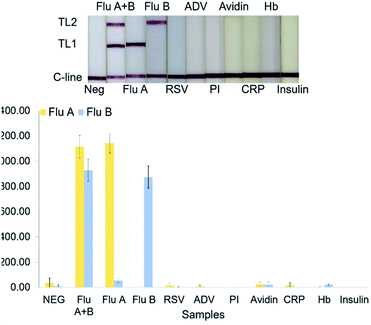
The specificity of the system was evaluated by using other respiratory virus proteins including either influenza A, influenza B, other respiratory viruses i.e., RSV, parainfluenza, and adenovirus virus, and other non-related proteins i.e., avidin, c-reactive protein, haemoglobin protein, and insulin proteins as samples. Assay procedure and the evaluation of specificity were performed in the same manner as described above.
Pre-clinical evaluation of the system
To evaluate the performance of the test system, nasopharyngeal swabs were used as the clinical specimens for evaluation. A total of 101 nasopharyngeal swabs, including 44 influenza virus negative samples, 45 influenza A virus positive samples, and 12 influenza B virus positive samples, were used as samples, as described previously. Prior to the sample application, the sample was mixed with an analysis buffer in a ratio of 1![[thin space (1/6-em)]](https://www.rsc.org/images/entities/char_2009.gif) :
:![[thin space (1/6-em)]](https://www.rsc.org/images/entities/char_2009.gif) 1. Subsequently, a volume of 100 μL of the mixed sample was applied onto a sample application window of the device cassette and allowed to process before the signal was visualized directly at 5 min. The performance of the system was correlated to other methods including commercial rapid antigen detection test and molecular approach (Fig. S7, ESI†).
1. Subsequently, a volume of 100 μL of the mixed sample was applied onto a sample application window of the device cassette and allowed to process before the signal was visualized directly at 5 min. The performance of the system was correlated to other methods including commercial rapid antigen detection test and molecular approach (Fig. S7, ESI†).
Pre-clinical evaluation of the test system performance was performed and correlated to those results obtained from commercial fluorescent-based test and molecular approach. To obtain sensitivity, specificity, positive and negative predictive values, and accuracy, true positive (TP), false negative (FN), true negative (TN), and false positive (FP) were used in the calculation as described previously45,46 (Fig. S7, ESI†).
Conclusions
In summary, a visual colorimetric rapid screening system based on lateral flow device for influenza A and B virus detection and differentiation using nucleoprotein as target molecules has been designed and developed as a model. Under optimal condition, the system is capable to detect the target molecules at ng per test level, with a detection limit of 0.04 and 1 ng per test for influenza A and B proteins, respectively. With the integration of a reader, it is shown that the results obtained from visual colorimetric method and the semi-quantitative analysis are in good alignment. The system also showed selectivity for its target proteins against other closely related respiratory virus proteins and other non-related proteins. The performance of the system is shown to be 4- to 8-fold higher sensitive than commercial tests, using colorimetric detection. With correlation to reference methods based on commercial fluorescence-based test and molecular approach, the specificity of 100% and the sensitivity of 89% and 83% for influenza A and B viruses, respectively were demonstrated. The potential advantages of such visual colorimetric rapid screening system based on lateral flow device can be of great importance for other screening applications, including a detection and differentiation for other related infectious agents, toxins, and other contaminants.Author contributions
Conceptualization: NW; Data curation: SS & NC; Formal analysis: NW, SS & NC; Funding acquisition: NW, WM & SB; Investigation: NW, SS, NC & PJ; Methodology: NW; Project administration: NW; Resources: NW, WM, SB, EP & DJ; Software: SS & NC; Supervision: NW; Validation: NW & SS; Visualization: NW & SS; Writing – original draft: NW; Writing – review & editing: NW.Conflicts of interest
There are no conflicts to declare.Acknowledgements
This work was supported by grant (P1750146) from NANOTEC, Thailand.References
- M. Jané, M. J. Vidal, N. Soldevila, A. Romero, A. Martínez, N. Torner, P. Godoy, C. Launes, C. Rius, M. A. Marcos and A. Dominguez, Sci. Rep., 2019, 9, 12853 CrossRef PubMed.
- A. D. Iuliano, K. M. Roguski, H. H. Chang, D. J. Muscatello, R. Palekar, S. Tempia, C. Cohen, J. M. Gran, D. Schanzer, B. J. Cowling, P. Wu, J. Kyncl, L. W. Ang, M. Park, M. Redlberger-Fritz, H. Yu, L. Espenhain, A. Krishnan, G. Emukule, L. van Asten, S. Pereira da Silva, S. Aungkulanon, U. Buchholz, M. A. Widdowson, J. S. Bresee and Global Seasonal Influenza-associated Mortality Collaborator Network, Lancet, 2018, 391, 1285–1300 CrossRef.
- A. F. Dugas, A. Valsamakis, M. R. Atreya, K. Thind, P. A. Manchego, A. Faisal, C. A. Gaydos and R. E. Rothman, Am. J. Emerg. Med., 2015, 33, 770–775 CrossRef PubMed.
- S. A. Call, M. A. Vollenweider, C. A. Hornung, D. L. Simel and W. P. McKinney, JAMA, J. Am. Med. Assoc., 2005, 293, 987–997 CrossRef CAS PubMed.
- K. A. Stellrecht, in Diagnostic Molecular Pathology, ed. B. C. William and J. T. Gregory, 2017, Molecular Testing for Respiratory Viruses, pp. 123–137, DOI:10.1016/B978-0-12-800886-7.00011-X.
- S. V. Vemula, J. Zhao, J. Liu, X. Wang, S. Biswas and I. Hewlett, Viruses, 2016, 8, 96 CrossRef PubMed.
- K. S. George, Methods Mol. Biol., 2012, 865, 53–69 CrossRef PubMed.
- M. Petric, L. Comanor and C. A. Petti, J. Infect. Dis., 2006, 194, S98–S110 CrossRef PubMed.
- H. Chen, A. Das, L. Bi, N. Choi, J. Moon, Y. Wu, S. Park and J. Choo, Nanoscale, 2020, 12, 21560–21570 RSC.
- H. Chen, S. Park, N. Choi, J. Moon, H. Dang, A. Das, S. Lee, D. Kim, L. Chen and J. Choo, Biosens. Bioelectron., 2020, 167, 112496 CrossRef CAS PubMed.
- H. Chen, K. Liu, Z. Li and P. Wang, Clin. Chim. Acta, 2019, 493, 138–147 CrossRef CAS PubMed.
- Y. Xu, M. Liu, N. Kong and J. Liu, Microchim. Acta, 2016, 183, 1521–1542 CrossRef CAS.
- X. Ding, M. G. Mauk, K. Yin, K. Kadimisetty and C. Liu, Anal. Chem., 2019, 91, 655–672 CrossRef CAS PubMed.
- W. C. Mak, V. Beni and A. P. F. Turner, Trends Anal. Chem., 2016, 79, 297–305 CrossRef CAS.
- O. Miočević, C. R. Cole, M. J. Laughlin, R. L. Buck, P. D. Slowey and E. A. Shirtcliff, Front. Public Health, 2017, 5, 133 CrossRef PubMed.
- H. Kim, D.-R. Chung and M. Kang, Analyst, 2019, 144, 2460–2466 RSC.
- X. Fu, J. Wen, J. Li, H. Lin, Y. Liu, X. Zhuang, C. Tian and L. Chen, Nanoscale, 2019, 11, 15530 RSC.
- X. Fu, Z. Cheng, J. Yu, P. Choo, L. Chen and J. Choo, Biosens. Bioelectron., 2016, 78, 530–537 CrossRef CAS PubMed.
- P. Tripathi, N. Upadhyay and S. Nara, Crit. Rev. Food Sci., 2018, 58, 1715–1734 CrossRef CAS PubMed.
- G. A. Posthuma-Trumpie, J. Korf and A. van Amerongen, Anal. Bioanal. Chem., 2009, 393, 569–582 CrossRef CAS PubMed.
- K. M. Koczula and A. Gallotta, Essays Biochem., 2016, 60, 111–120 CrossRef PubMed.
- D. Quesada-González and A. Merkoçi, Biosens. Bioelectron., 2015, 73, 47–63 CrossRef PubMed.
- S. Bamrungsap, C. Apiwat, W. Chantima, T. Dharakul and N. Wiriyachaiporn, Microchim. Acta, 2014, 181, 223–230 CrossRef CAS.
- Y. Wang, J. Sun, Y. Hou, C. Zhang, D. Li, H. Li, M. Yang, C. Fan and B. Sun, Biosens. Bioelectron., 2019, 141, 111432 CrossRef CAS PubMed.
- C. Parolo, A. de la Escosura-Muñiz and A. Merkoçi, Biosens. Bioelectron., 2013, 40, 412–416 CrossRef CAS PubMed.
- E. Fu, T. Liang, J. Houghtaling, S. Ramachandran, S. A. Ramsay, B. Lutz and P. Yager, Anal. Chem., 2011, 83, 7941–7946 CrossRef CAS PubMed.
- N. Wiriyachaiporn, W. Maneeprakorn, C. Apiwat and T. Dharakul, Microchim. Acta, 2015, 182, 85–93 CrossRef CAS.
- X. Huang, Z. P. Aguilar, H. Xu, W. Lai and Y. Xiong, Biosens. Bioelectron., 2016, 75, 166–180 CrossRef CAS PubMed.
- M. Han, T. Xie, J. Li, H. Chen, X. Yang and X. Guo, BioMed Res. Int., 2020, 2020, 3969868 Search PubMed.
- D. A. Green and K. StGeorge, J. Clin. Microbiol., 2018, 56, e00711–18 CAS.
- Centers for Disease Control and Prevention, https://www.cdc.gov/flu/professionals/diagnosis/clinician_guidance_ridt.htm, accessed on April 24, 2021.
- World Health Organization, http://apps.who.int/iris/bitstream/handle/10665/44304/9789241599283_eng.pdf;jsessionid=12044AD8127B58A34181F086DC1158B3?sequence=1, accessed on April 24, 2021.
- Y. Hu, H. Sneyd, R. Dekant and J. Wang, Curr. Top. Med. Chem., 2017, 17, 2271–2285 CAS.
- L. Sherry, M. Smith, S. Davidson and D. Jackson, J. Virol., 2014, 88, 12326–12338 CrossRef PubMed.
- E. N. Prokudina, N. P. Semenova, V. M. Chumakov, I. A. Rudneva and S. S. Yamnikova, Virus Res., 2001, 77, 43–49 CrossRef CAS PubMed.
- D. R. Londo, A. R. Davis and D. P. Nayak, J. Virol., 1983, 47, 642–648 CrossRef CAS PubMed.
- Y. Chi, Y. Ge, K. Zhao, B. Zou, B. Lin, X. Qi, Q. Bian, Z. Shi, F. Zhu, M. Zhou, L. Cui and C. Su, Sci. Rep., 2017, 7, 44924, DOI:10.1038/srep44924.
- Y.-D. Maa, Y.-S. Chena and G.-W. Lee, Sens. Actuators, B, 2019, 296, 126647 CrossRef.
- B. Huang, N. P. West, J. Vider, A. J. Cox, T. Constantino, B. J. Harrower, A. T. Pyke, J. McMahon, J. A. Northill, T. Riordan and D. Warrilow, Sci. Rep., 2017, 7, 18092 CrossRef PubMed.
- U. K. Laemmli, Nature, 1970, 227, 680–685 CrossRef CAS PubMed.
- T. Mahmood and P. C. Yang, N. Am. J. Med. Sci., 2012, 4, 429–434 CrossRef.
- G. Fren, Nat. Phys. Sci., 1973, 241, 20–22 CrossRef.
- S.-H. Paek, S.-H. Lee, J.-H. Cho and Y.-S. Kim, Methods, 2000, 22, 53–60 CrossRef CAS.
- S. Christau, T. Moeller, J. Genzer, R. Koehler and R. von Klitzing, Macromolecules, 2017, 50, 7333–7343 CrossRef CAS.
- A. Baratloo, M. Hosseini, A. Negida and G. El Ashal, Emergency, 2015, 3, 48–49 Search PubMed.
- U.S. Food and Drug Administration, https://www.fda.gov/regulatory-information/search-fda-guidance-documents/statistical-guidance-reporting-results-studies-evaluating-diagnostic-tests-guidance-industry-and-fda, accessed on April 18, 2021.
Footnote |
| † Electronic supplementary information (ESI) available. See DOI: 10.1039/d1ra01361k |
| This journal is © The Royal Society of Chemistry 2021 |

