 Open Access Article
Network pharmacology-based analysis for unraveling potential cancer-related molecular targets of Egyptian propolis phytoconstituents accompanied with molecular docking and in vitro studies†
Reham S. Ibrahim * and
Alaa A. El-Banna
Department of Pharmacognosy, Faculty of Pharmacy, Alexandria University, Alexandria, 21521, Egypt. E-mail: rehamsaid84@yahoo.com; reham.abdelkader@alexu.edu.eg; Tel: +201223821098
First published on 22nd March 2021
Abstract
Cancer is one of the predominant causes of death worldwide. The new trend nowadays is to exploit natural products with the hope of developing new anticancer agents with fewer side effects. Propolis is one of these natural products which showed effectiveness in cancer treatment. The aim of this study is to understand the multi-level mechanism of action of propolis constituents in cancer treatment using an integrated approach of network pharmacology-based analysis, molecular docking and in vitro cytotoxicity testing. An inhouse database of chemical constituents from Egyptian propolis was compiled and assessed for its ADME properties using the QikProp module in the Schrodinger software. STITCH, UniProt, STRING, KEGG and DAVID databases were used for construction of constituent-target gene, gene-pathway, and constituent-target gene-pathway networks with the aid of Cytoscape 3.8.2. The network pharmacology-based analysis showed that the hit propolis constituents related to cancer targets were genistein, luteolin, benzoic acid, quercetin and vanillic acid, whereas the main cancer-associated targets were CYP1A1, CYP19A1, ESR1, NOS3, CASP3 and AKT1. Twenty-four cancer-related pathways were recognized where the most enriched ones were pathways in cancer and estrogen signaling pathway. The most enriched biological processes involved in the mechanism of action of propolis constituents in cancer treatment were negative regulation of the apoptotic process and the metabolic process and negative regulation of cellular glucuronidation. Molecular docking analysis of the top hit compounds against the most enriched target proteins in the constructed networks was carried out using the Maestro interface of the Schrodinger software. Among hit compounds, quercetin and genistein exhibited the most stabilized interaction. Finally, confirmation of the potential anticancer activity of propolis was assured by in vitro cytotoxicity testing of propolis extract on human prostate cancer (DU-145), breast adenocarcinoma (MCF-7) and colorectal adenocarcinoma (Caco-2) cell lines. This study presents deeper insights about propolis molecular mechanisms of action in cancer for the first time using an integrated approach of network pharmacology, molecular docking and in vitro testing.
1. Introduction
Cancer is among the major causes of death worldwide. It is the second predominant reason for mortality following cardiovascular diseases.1 It is charged with one in eight deaths in the world, exceeding malaria, AIDS and tuberculosis collectively.2 The number of deaths due to cancer in the world is expected to rise from 7.1 million in 2002 to 11.5 million in 2030.3Many chemotherapeutic agents have been developed during the past five decades. Although these agents were beneficial in the treatment of cancer, they exhibited many adverse side effects.4 Therefore, scientific research is needed to improve these agents and develop new ones with no or fewer side effects. Because of this requirement, great attention is now paid to natural products as a promising treasure to discover safer and more effective anticancer agents.
Four categories of natural anticancer agents are marketed today, the vinca alkaloids, the epipodophyllotoxins, the taxanes and the camptothecin derivatives.4 Natural products still have great prospect to yield novel anticancer agents and one of these auspicious natural products is propolis.
Propolis is a resinous substance produced by honey bees via mixing their salivary and enzymatic secretions with plant sap and gums. It is called “bee glue” because it is used by bees to close up unwanted pores and cracks in their hives. It is also used by bees as an antiseptic to sanitize their hives against microbial infections.5 Propolis color and structure vary based on the plant and the geographical origins. It may be green, black, red, white and most commonly brown in color and hard or fragile in structure. There are many botanical origins of propolis, the most commonly identified are chestnut, pine, sweetgum, poplar, oak, birch, elm, coin vine, willow, acacia, eucalyptus, etc. The geographical origin includes many countries across the world such as Egypt, China, Thailand, India, Taiwan, Iraq, Greece, Tunisia, Turkey, Cuba, Croatia, Mexico, Portugal, Brazil and Caribbean countries.6
From a chemical perspective, the propolis chemome has a remarkable qualitative and quantitative divergence due to specificity of the surrounding flora at the collection site and accordingly geographic, climatic features and harvest seasons. Further, genetic differences among bee races account for this inherent variability, possibly owing to discrete preferences toward appropriate resin sources from various plant families.7
Literature survey revealed that propolis is rich in many active constituents mainly polyphenols, flavonoids, amino acids and minerals.8 Therefore, it exhibits a variety of health-promoting activities such as antioxidant, antimicrobial, skin emollient, anti-inflammatory, laxative, immunomodulator, antidiabetic, and anticancer activities.5 Owing to its positive human health consequences against degenerative diseases,9 propolis was recognized as a valuable therapeutic agent and extensively incorporated into commercial health-promoting formulations traditionally consumed worldwide.
The anticancer effect of propolis is its most astounding activity. It is mainly ascribed to its anti-oxidant potential, immune-boosting effect, antiproliferative activity, tumor vascularization inhibition, killing cancer stem cells, alteration of the neoplasm microenvironment, mitigation of chemotherapeutics side effects.10 Propolis is reported to be effective in the treatment of many types of cancer such as brain and spinal cord, breast, blood, head and neck, skin, pancreas, colon, kidney, liver and bladder cancers.6
Comprehension and illustration of the molecular mechanisms by which natural products act on molecular targets is very difficult because of the complex chemome of natural products and the possibility to act synergistically and on multiple targets at the same time. Lately, the explanation of the mechanism of actions of natural products in various diseases with the projection of target genes and pathways have been successfully illustrated by the use of network pharmacology analysis.11–15 This analysis is utilized to construct compound–target–gene–disease network that makes it easy to understand the multi-target mechanism of natural products constituents. Network pharmacology heighten the conception of “network target, multicomponent therapeutics” in a holistic approach comparable to the complexity of natural products metabolomes.16
The aim of this study is to comprehend the mechanism of the anticancer activity of propolis via the network pharmacology analysis. The identification of protein targets and the related pathways followed by gene enrichment analysis were conducted. Molecular docking analysis was performed on the identified hit compounds mostly related to cancer targets in order to investigate the molecular interactions of these compounds with the target genes. In vitro cytotoxicity testing on prostate, breast and colon cancer cell lines was further carried out to prove the potential anticancer activity of Egyptian propolis extract. This study represents deeper insights about propolis molecular mechanisms of action in cancer for the first time using an integrated approach of network pharmacology, molecular docking and in vitro testing.
2. Experimental
2.1. Compilation of an in-house database for Egyptian propolis
A database of 100 compounds was compiled from previous literature review on chemical composition of Egyptian propolis (Table S1†). The 2D structures of these compounds were confirmed using ChEMBL (https://www.ebi.ac.uk/chembl/) and PubChem (https://pubchem.ncbi.nlm.nih.gov/). Then the conversion of these structures to the SMILES format was accomplished using Schrodinger software (2017A).2.2. ADME and drug-likeness filtration
Filtration of propolis constituents imported from the database was carried out using Qikprop software (Schrodinger suite 2017A) by calculation of absorption, distribution, metabolism, and excretion (ADME) criteria and applying Lipinski's rule of five.17 In this study, compounds with projected oral bioavailability (OB) of less than 30 were excluded. In addition, compounds that satisfied less than three criteria from Lipinski's rule of five were also excluded.2.3. Network pharmacology-based analysis
2.4. Molecular docking studies
The Protein Data Bank (PDB) was used for retrieving the crystal structure of most enriched targets revealed from network pharmacology analysis, which are cytochrome P450 1A1 (6DWN), aromatase (3EQM), estrogen receptor (4J26), endothelial nitric oxide synthase (1M9K), caspase-3 (3DEI) and RAC-alpha serine/threonine-protein kinase (3O96). The selection of crystal structure of each protein was relied on best resolution available. Preparation of the proteins crystallographic structures was accomplished using protein preparation module of Schrodinger's Maestro molecular modeling suit (Schrödinger). Initially, preprocessing of the proteins was carried out by assigning bond orders and hydrogens in addition to creation of zero order bonds to metals and disulphide bonds, all the water molecules exceeding 5 Å from the active site were removed, assignment of hydrogen bonds was performed via PROPKA at PH = 7, then energy was minimized using OPLS 3 force field until the relative mean standard deviation (RMSD) of the minimized structure compared to the crystal structure was above 0.30 Å.22 Localization of the binding site for the docking experiments was assigned by the use of receptor grid generation module and the boxes enclosing the centroids of co-crystallized ligands were set as the grids. The compounds 3D structures were imported as SDF file into the LigPrep module of the Maestro molecular modeling package in order to obtain low energy structures of compounds. Adjustment of ionization states was carried out in order to produce all possible states at pH 7. Molecular docking simulations were achieved by the use of Glide docking program of Maestro molecular modeling package implementing extra-precision (XP-Glide) module. The ligand–target interactions including hydrogen bond, ion pair interactions, hydrophobic interactions and the binding modes of the identified compounds were visualized using Maestro interface.2.5. In vitro cytotoxicity assay on human prostate cancer (DU-145), breast adenocarcinoma (MCF-7) and colorectal adenocarcinoma (Caco-2) cell lines
3. Results and discussion
A database of 100 compounds was constructed from previous literature review on chemical composition of Egyptian propolis.3.1. ADME filtration of propolis constituents
Assessment of the ADME properties of the compounds was carried out via QikProp module which measures some physiochemical properties that project the drug-likeness of compounds. These physiochemical properties were summarized by Lipinski's rule of 5. In accordance with Lipinski's rule of 5, a compound of reported biological activity is considered active (having good absorption and/or permeation) if it has lower than ten hydrogen-bond acceptors (Hacc), lower than five hydrogen-bond donors (Hdon), 10 or fewer rotatable bonds (RBN), a molecular weight less than 500 Da and has a calculated log![[thin space (1/6-em)]](https://www.rsc.org/images/entities/char_2009.gif) P (ClogP) less than five.17 Only compounds obeying at least three of the above features were retained in the database.
P (ClogP) less than five.17 Only compounds obeying at least three of the above features were retained in the database.
In addition, the oral bioavailability of the gathered compounds was calculated.26 It indicates the extent of the orally administered drug dosage reaching the therapeutic site of action unchanged. Only compounds having OB ≥ 30% were kept in the database. All the compounds of the database (Table S1†) obeyed the specified criteria and thus were retained for further network pharmacology-based analysis.
3.2. Identification of cancer-associated target genes of propolis constituents via network pharmacology-based analysis
In order to recognize the cancer-associated target genes of propolis compounds, a compound–target network was constructed using the searching results gained from STITCH 5.0 database. STITCH is a large database that contains information about chemicals interactions. It contains interaction information for more than 68![[thin space (1/6-em)]](https://www.rsc.org/images/entities/char_2009.gif) 000 chemicals, including 2200 drugs, and connects them to 1.5 million genes across 373 genomes.27 UniProt database was utilized to know the role of each identified target gene and its relation to cancer. The Universal Protein Resource (UniProt) is a comprehensive resource for protein sequences and functional annotation, it contains information about more than 550
000 chemicals, including 2200 drugs, and connects them to 1.5 million genes across 373 genomes.27 UniProt database was utilized to know the role of each identified target gene and its relation to cancer. The Universal Protein Resource (UniProt) is a comprehensive resource for protein sequences and functional annotation, it contains information about more than 550![[thin space (1/6-em)]](https://www.rsc.org/images/entities/char_2009.gif) 000 proteins and their functions.28
000 proteins and their functions.28
In STITCH 5.0 database, there are “combined scores” for the interactions between chemicals and genes with stronger interactions exhibiting higher scores. In this study, only compounds having interaction score higher than 0.4 were retained (Table 1). The constructed constituent-target network was composed of 61 nodes (20 constituents and 41 targets) and 55 edges (Fig. 1) with an average of 2.222 targets for each constituent signifying the multi-target feature of the studied compounds.
| Short name of protein | Full name of protein | Interacting compound (s) (combined interaction score) |
|---|---|---|
| ABCG2 | Broad substrate specificity ATP-binding cassette transporter | Tectochrysin (0.7) |
| ACSM1 | Acyl-CoA synthetase medium-chain family member 1 | Benzoic acid (0.952) |
| ACSM2B | Acyl-CoA synthetase medium-chain family member 2B | Benzoic acid (0.958) |
| AKT1 | RAC-alpha serine/threonine-protein kinase | Genistein (0.96), chrysin (0.7) |
| ALAD | Delta-aminolevulinic acid dehydratase | Hydroxyvaleric acid (0.949) |
| AOX1 | Aldehyde oxidase 1 | Isovanillin (0.861) |
| AR | Androgen receptor | Genistein (0.959) |
| ASPA | Aspartoacylase | Triacetin (0.534) |
| CASP3 | Caspase-3 | Luteolin (0.947), myricetin (0.733) |
| CDK1 | Cyclin-dependent kinase 1 | Apigenin (0.949) |
| CDK2 | Cyclin-dependent kinase 2 | Luteolin (0.942) |
| CES1 | Carboxylesterase 1D | Benzoic acid (0.958) |
| CFTR | Cystic fibrosis transmembrane conductance regulator | Genistein (0.961), gluconate (0.442) |
| CYP19A1 | Aromatase | Genistein (0.962), chrysin (0.931), biochanin A (0.986), apigenin (0.837) |
| CYP1A1 | Cytochrome P450 1A1 | Genistein (0.988), galangin (0.981), chrysin (0.841), formononetin (0.722), genkwanin (0.7), ellagic acid (0.444) |
| CYP1B1 | Cytochrome P450 1B1 | Quercetin (0.975) |
| DAO | Diamine oxidase | Benzoic acid (0.993) |
| EGFR | Epidermal growth factor receptor | Luteolin (0.869) |
| ESR1 | Estrogen receptor alpha | Genistein (0.996), apigenin (0.961), benzoic acid (0.7) |
| ESR2 | Estrogen receptor beta | Genistein (0.996) |
| F12 | Coagulation factor XII | Ellagic acid (0.966) |
| FOS | Proto-oncogene c-Fos | Luteolin (0.944) |
| HCK | Tyrosine-protein kinase HCK | Quercetin (0.969) |
| HRSP12 | 2-Iminobutanoate/2-iminopropanoate deaminase | Benzoic acid (0.958) |
| JUN | Transcription factor AP-1 | Luteolin (0.946) |
| MAPK8 | Mitogen-activated protein kinase 8 | Luteolin (0.951) |
| MCL1 | Induced myeloid leukemia cell differentiation protein | Quercetin (0.987) |
| MMP9 | Matrix metalloproteinase-9 | Luteolin (0.949) |
| NOS3 | Nitric oxide synthase | Genistein (0.978), ellagic acid (0.828) |
| PIK3CG | Phosphatidylinositol 4,5-bisphosphate 3-kinase catalytic subunit gamma isoform | Myricetin (0.928) |
| PIM1 | Serine/threonine-protein kinase pim-1 | Quercetin (0.969) |
| PPARA | Peroxisome proliferator-activated receptor alpha | Naringenin (0.86) |
| PPARG | Peroxisome proliferator-activated receptor gamma | Genistein (0.964) |
| PRDX5 | Peroxiredoxin-5, mitochondrial | Benzoic acid (0.97) |
| SIRT1 | NAD-dependent protein deacetylase sirtuin-1 | Myricetin (0.943) |
| TMEM37 | Transmembrane protein 37 | p-Coumaric acid (0.517) |
| TMEM67 | Transmembrane protein 67 | Triacetin (0.4) |
| UGT1A10 | UDP glucuronosyltransferase family 1 member A10 | Vanillic acid (0.7) |
| UGT1A3 | UDP glucuronosyltransferase family 1 member A3 | Vanillic acid (0.7) |
| UGT1A7 | UDP glucuronosyltransferase family 1 member A7 | Vanillic acid (0.7) |
| UGT1A8 | UDP glucuronosyltransferase family 1 member A8 | Vanillic acid (0.7) |
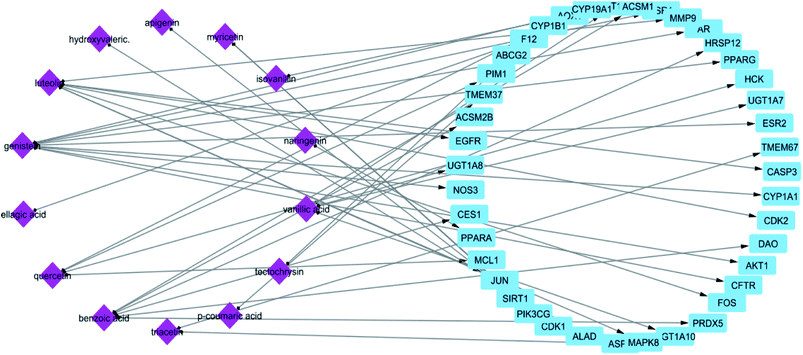 | ||
| Fig. 1 Network of compound–target gene interactions for propolis constituents by linking 20 compounds and 41 target proteins. | ||
From the constructed compound–target (C–T) network, it can be shown that the propolis flavonoidal constituents were predominant in the hit list where genistein (flavonoid) exhibited the highest C–T interaction percentage (19%), followed by luteolin (14%) (flavonoid), benzoic acid (14%) (aromatic carboxylic acid), quercetin (8%) (flavonoid), vanillic acid (6%) (phenolic acid), apigenin (6%) (flavonoid), myricetin (6%) (flavonoid), chrysin (5%) (flavonoid) and ellagic acid (5%) (polyphenol) (Fig. 2).
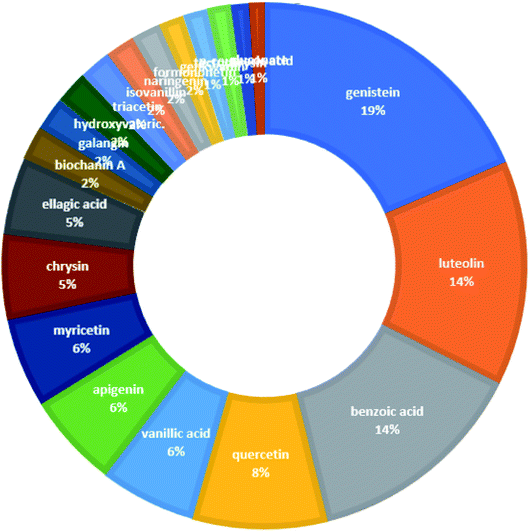 | ||
| Fig. 2 The distributions % of the compound–target gene (C–T) interactions on the propolis constituents. | ||
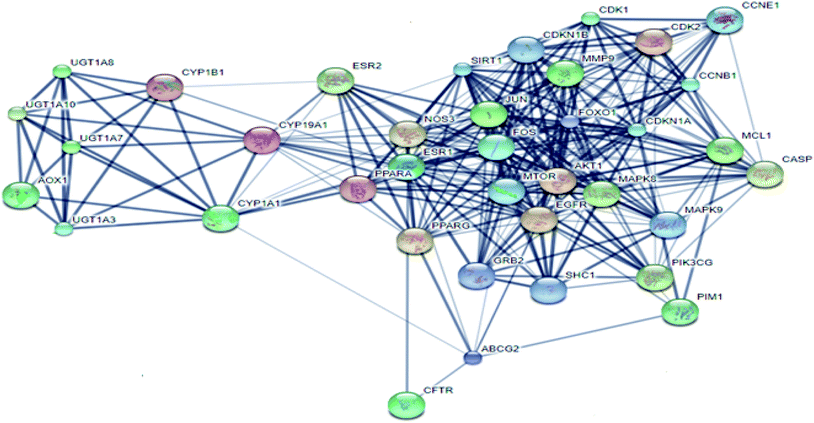
From Fig. 3, it can be concluded that the most enriched cancer-associated target genes which exhibited the highest percentage of interactions with the constituents in this network were CYP1A1 (10%), CYP19A1 (8%), ESR1 (5%), NOS3 (4%), CASP3 (4%) and AKT1 (4%). These are well-recognized cancer molecular targets where CYP1A1 plays an important role in the metabolism of the polycyclic aromatic hydrocarbons and in the oxidative metabolism of estrogens that might increase the risk of oxidative stress and cancer.29 Also, CYP19A1 (aromatase) plays a critical role in estrogen biosynthesis and thus may be related to the progression of breast cancer and other hormone-dependent cancers.30 In addition, ESR1 is the gene that encodes the estrogen receptor protein. Therefore, plays a role in pathogenesis of cancers.31 NOS-3 has also been suggested to modulate different cancer-related events such as angiogenesis, apoptosis, cell cycle, invasion and metastasis.32 Meanwhile, CASP3 is involved in the activation cascade of caspases responsible for apoptosis execution.33 Whereas, AKT1 regulates many processes including metabolism, proliferation, cell survival, growth and angiogenesis.34 Strong interactions were found between genes in protein–protein network (Fig. 4).
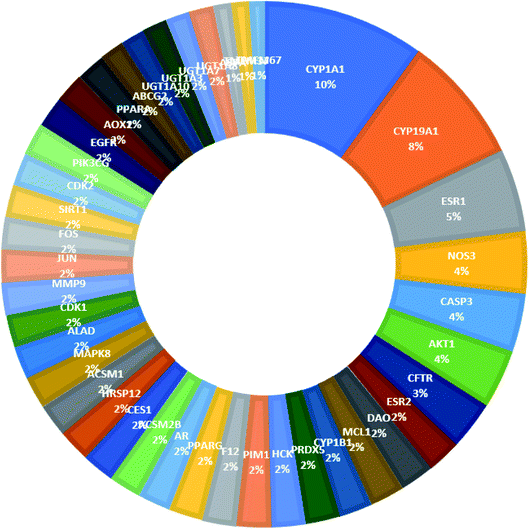 | ||
| Fig. 3 The distributions % of the compound–target gene (C–T) interactions on the identified cancer-related proteins. | ||
KEGG (Kyoto Encyclopedia of Genes and Genomes) is a database resource for understanding high-level functions and utilities of the biological system from molecular-level information, especially large-scale molecular datasets generated by genome sequencing and other high-throughput experimental technologies.35 KEGG pathways functional enrichment analysis was performed to recognize the signaling pathways and functions of identified target genes (Table 2). From KEGG pathways analysis (Table 2 and Fig. 5), it can be observed that the target genes interact with 24 cancer-associated pathways with the most enriched ones were pathways in cancer and estrogen signaling pathway which had the lowest false discovery rate and the largest number of observed gene count, followed by steroid hormone biosynthesis and microRNAs in cancer.
| Pathway ID | Pathway description | Observed gene count | False discovery rate | Matching proteins in network |
|---|---|---|---|---|
| 5200 | Pathways in cancer | 9 | 1.09 × 10⁻¹³ | AKT1, CASP3, EGFR, FOS, JUN, MAPK8, MMP9, PIK3CG, PPARG |
| 4915 | Estrogen signaling pathway | 9 | 5.48 × 10⁻¹³ | AKT1, EGFR, ESR1, ESR2, FOS, JUN, MMP9, NOS3, PIK3CG |
| 140 | Steroid hormone biosynthesis | 7 | 1.76 × 10⁻⁹ | CYP19A1, CYP1A1, CYP1B1, UGT1A10, UGT1A3, UGT1A7, UGT1A8 |
| 5206 | MicroRNAs in cancer | 7 | 5.94 × 10⁻⁹ | CASP3, CYP1B1, EGFR, MCL1, MMP9, PIM1, SIRT1 |
| 5205 | Proteoglycans in cancer | 6 | 8.09 × 10⁻⁸ | AKT1, CASP3, EGFR, ESR1, MMP9, PIK3CG |
| 5210 | Colorectal cancer | 6 | 1.33 × 10⁻⁷ | AKT1, CASP3, FOS, JUN, MAPK8, PIK3CG |
| 5204 | Chemical carcinogenesis | 6 | 3.07 × 10⁻⁷ | CYP1A1, CYP1B1, UGT1A10, UGT1A3, UGT1A7, UGT1A8 |
| 4010 | MAPK signaling pathway | 6 | 2.24 × 10⁻⁶ | AKT1, CASP3, EGFR, FOS, JUN, MAPK8 |
| 5215 | Prostate cancer | 5 | 2.58 × 10⁻⁶ | AKT1, AR, EGFR, MMP9, PIK3CG |
| 4151 | PI3K-Akt signaling pathway | 5 | 1.58 × 10⁻⁵ | AKT1, EGFR, MCL1, NOS3, PIK3CG |
| 5224 | Breast cancer | 4 | 1.95 × 10⁻⁵ | AKT1, EGRF, ESR1, ESR2 |
| 5218 | Melanoma | 3 | 0.00014 | AKT1, EGFR, PIK3CG |
| 5214 | Glioma | 3 | 0.000186 | AKT1, EGFR, PIK3CG |
| 5221 | Acute myeloid leukemia | 3 | 0.00023 | AKT1, PIK3CG, PIM1 |
| 5203 | Viral carcinogenesis | 3 | 0.000282 | CASP3, JUN, PIK3CG |
| 5213 | Endometrial cancer | 3 | 0.000318 | AKT1, EGFR, PIK3CG |
| 5223 | Non-small cell lung cancer | 3 | 0.000511 | AKT1, EGFR, PIK3CG |
| 4913 | Ovarian steroidogenesis | 3 | 0.000541 | CYP19A1, CYP1A1, CYP1B1 |
| 5211 | Renal cell carcinoma | 3 | 0.000808 | AKT1, JUN, PIK3CG |
| 4210 | Apoptosis | 3 | 0.000876 | AKT1, CASP3, PIK3CG |
| 5202 | Transcriptional misregulation in cancer | 2 | 0.00416 | MMP9, PPARG |
| 5220 | Chronic myeloid leukemia | 2 | 0.00508 | AKT1, PIK3CG |
| 5222 | Small cell lung cancer | 2 | 0.00701 | AKT1, PIK3CG |
| 5219 | Bladder cancer | 2 | 0.00877 | EGFR, MMP9 |
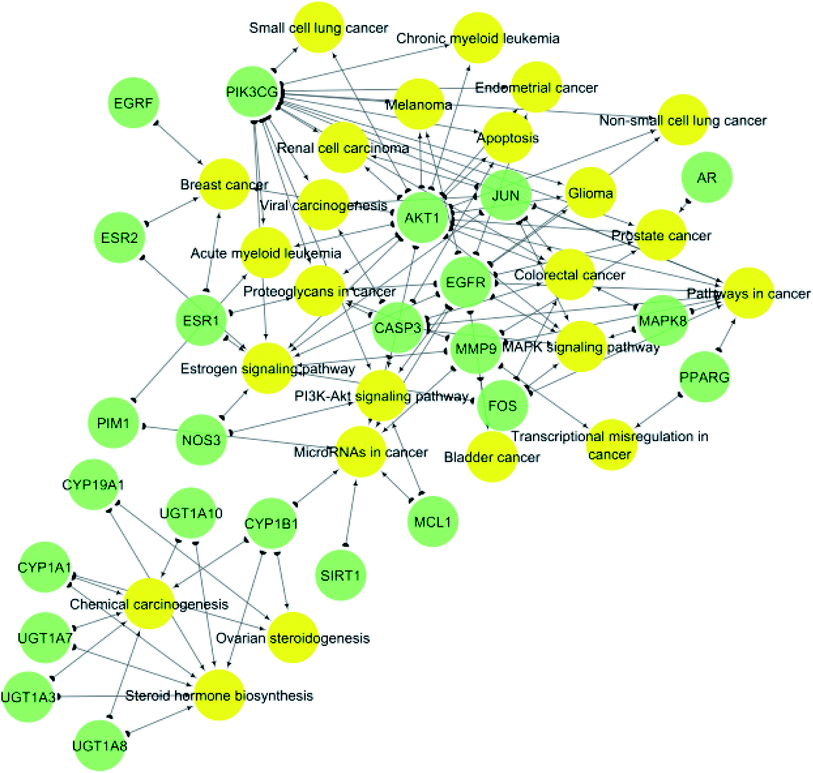 | ||
| Fig. 5 Gene–pathway network (genes are presented in green color, pathways are presented in yellow color). | ||
Merging compound–target and target–pathway networks was carried out to obtain the compound–target–pathway network that revealed the multiple interaction nature of the studied propolis constituents together with the identified cancer-associated genes where each node in the network had an average number of interactions of 1.8 (Fig. 6).
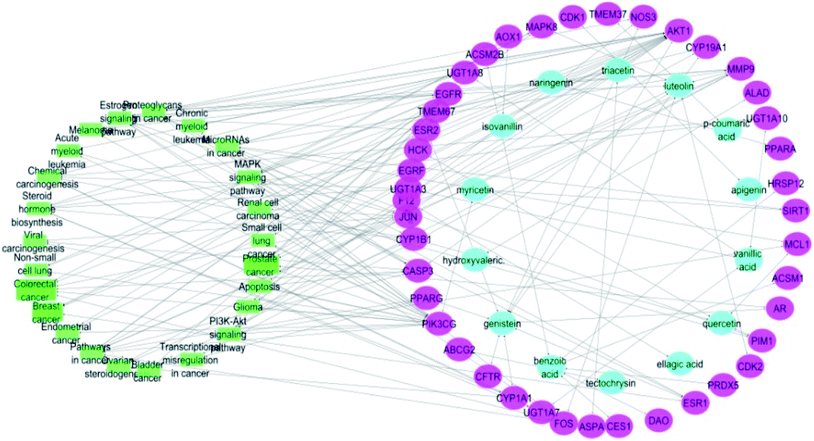 | ||
| Fig. 6 Compound–target–pathway network (compounds are represented in blue color, targets are presented in pink color and pathways are presented in green color). | ||
In order to validate the results gained from network pharmacology-based analysis, the PubMed was reviewed for studies relating the hit constituents to the different cancer treatment pathways (Table 3). For instance, genistein was found to induce apoptosis in prostate, breast, lung, and pancreas cancer cells by inhibition of NF-kappaB and Akt signaling pathways.36 In addition, luteolin was reported to arrest the growth of colon adenocarcinoma cells by inactivation of the PI3K/Akt and ERK1/2 pathways via a reduction in insulin-like growth factor-I receptor (IGF-IR) signaling.37 Meanwhile, benzoic acid derivatives were proved to inhibit murine bladder cancer cells growth and metastasis through inhibition of TNFα/NFκB and iNOS/NO pathways.38 Moreover, quercetin was declared to suppress the viability and proliferation of breast cancer cells by activation of both apoptosis and necroptosis signaling pathways.39 Also, vanillic acid was proclaimed to inhibit the growth of human colon cancer cells by suppression of hypoxia-inducible factor 1 (HIF-1) expression via inhibition of mTOR/p70S6K/4E-BP1 and Raf/MEK/ERK pathways.40
| Compound | Model | Reference | Mechanism |
|---|---|---|---|
| Genistein | Breast cancer cells (MDA-MB-435 and MDA-MB-231) | PMID: 33249095 | Inhibited secreted OPN expression leading to reduced colony formation rate, migration and invasion of MDA-MB-435 and MDA-MB-231 cancer cells. It also activated the MAPK pathway by phosphorylating MEK½ and ERK½ and increased silent mating type information regulation 2 homolog 1 (SIRT1) expression in these cells |
| Breast cancer cells | PMID: 18492603 | Inhibited the proto-oncogene HER-2 protein tyrosine phosphorylation | |
| PC-3 (prostate), MDA-MB-231 (breast), H460 (lung), and BxPC-3 (pancreas) cancer cells | PMID: 16061678 | Inhibited the activation of NF-kappaB and Akt signaling pathways that lead to apoptosis | |
| Human cervical carcinoma cells (HeLa) | PMID: 31766427 | Modulated the expression of several genes involved in the cell cycle regulation, migration, inflammation, phosphatidylinositol 3-kinase (PI3K) and mitogen activated kinase-like protein (MAPK) pathway including CCNB1, TWIST1, MMP14, TERT, AKT1, PTPRR, FOS and IL1A | |
| Human leukemia HL-60 cancer cell | PMID: 30618158 | Decreased cell number through G2/M phase arrest and the induction of cell apoptosis through ER stress- and mitochondria-dependent pathways in HL-60 cells | |
| Luteolin | HCT-15 colon adenocarcinoma cell line | PMID: 24099426 | Induced growth arrest by inhibiting Wnt/β-catenin/GSK-3β signaling pathway. It also induced apoptosis by caspase-3 mediated manner |
| HT-29 colon adenocarcinoma cell line | PMID: 22269172 | Downregulated the activation of the PI3K/Akt and ERK1/2 pathways via a reduction in IGF-1R signaling leading to apoptosis | |
| SW480 and Caco-2 colon cancer cell lines | PMID: 15203384 | Induced cell cycle arrest at G2/M phase | |
| Caco-2 colon cancer cell line | PMID: 20659486 | Showed a protective effect against H2O2-induced DNA damage | |
| Human colon carcinoma cell line Caco-2 (BS TCL 87) | PMID: 26580959 | Exerted toxic effects on colon cancer cells by inhibiting both S1P biosynthesis and ceramide traffic | |
| Human gastric cancer cell line BGC-823 | PMID: 28789432 | Induced apoptosis through suppressing the MAPK and PI3K signaling pathways | |
| MDA-MB-231 breast cancer cells | PMID: 31611756 | Induced apoptosis through the caspase cascade and PARP inactivation | |
| Benzoic acid | Murine bladder cancer cell line MB49 | PMID: 31877271 | Benzoic acid derivatives inhibited tumor growth and metastasis through inhibition of TNFα/NFκB and iNOS/NO pathways |
| Quercetin | Human cervical carcinoma HeLa cells | PMID: 31366565 | Blocked the PI3K, MAPK and WNT pathways by modulating the expression of several proteins leading to the inhibition of cell proliferation, cell cycle arrest, DNA damage and apoptosis in cervical cancer (HeLa) cells |
| MCF-7 breast cancer cells | PMID: 28814095 | Suppressed viability and proliferation of MCF-7 cells by activation of both apoptosis and necroptosis signaling pathways. Apoptosis was induced via increasing expression of Bax and caspase-3 and decreasing expression of Bcl-2 genes. Necroptosis was induced by increasing expression of RIPK1 and RIPK3 | |
| Human prostate cancer cell lines (LNCaP, DU-145, and PC-3) | PMID: 29898731 | Exerted its anti-cancer effects by modulating ROS, Akt, and NF-κB pathways | |
| Human pancreatic cancer cell line MIA Paca-2 | PMID: 31590760 | Induced apoptosis and chemosensitivity through RAGE/PI3K/AKT/mTOR pathways | |
| AGS human gastric cancer cells | PMID: 30152185 | Induced cell morphological changes and reduced total viability via apoptotic cell death in AGS cells | |
| Increased reactive oxygen species (ROS) production, decreased the levels of mitochondrial membrane potential, and increased the apoptotic cell number in AGS cells | |||
| Decreased anti-apoptotic protein of Mcl-1, Bcl-2, and Bcl-x but increased pro-apoptotic protein of Bad, Bax, and Bid | |||
| Increased the gene expressions of TNFRSF10D (tumor necrosis factor receptor superfamily, member 10d, decoy with truncated death domain), TP53INP1 (tumor protein p53 inducible nuclear protein 1), and JUNB (jun B proto-oncogene) but decreased the gene expression of VEGFB (vascular endothelial growth factor B), CDK10 (cyclin-dependent kinase 10), and KDELC2 (KDEL [Lys-Asp-Glu-Leu] containing 2) that are associated with apoptosis pathways | |||
| Vanillic acid | Human colon cancer HCT116 cells | PMID: 30678221 | Suppressed HIF-1α expression via inhibition of mTOR/p70S6K/4E-BP1 and Raf/MEK/ERK pathways |
| Human prostate cancer cell lines (LNCaP, DU145, GM-0637, BPH-1, and TRAMP cell lines) | PMID: 12869308 | Vanillic acid methyl ester suppressed Akt/NFKB cell survival signaling pathway therefore it can be used for treatment of prostate cancer | |
| B16BL6 melanoma cells | PMID: 32722030 | Induced STAT3-mediated autophagy to inhibit cancer growth | |
| benzo(a)pyrene induced lung cancer in Swiss albino mice | PMID: 31468657 | It had an efficient preventive action against B(a)P-induced lung cancer, and this is attributed to its free-radical scavenging antioxidant activities | |
| 7,12-Dimethylbenz(a)anthracene-induced hamster buccal pouch carcinogenesis | PMID: 30488845 | Increased the phase I (cytochrome P450 and cytochrome b5) and decreased phase II (GSH, GR, and DT-diaphorase) detoxification enzymes in DMBA treated hamsters |
3.3. Gene ontology (GO) enrichment analysis for targets
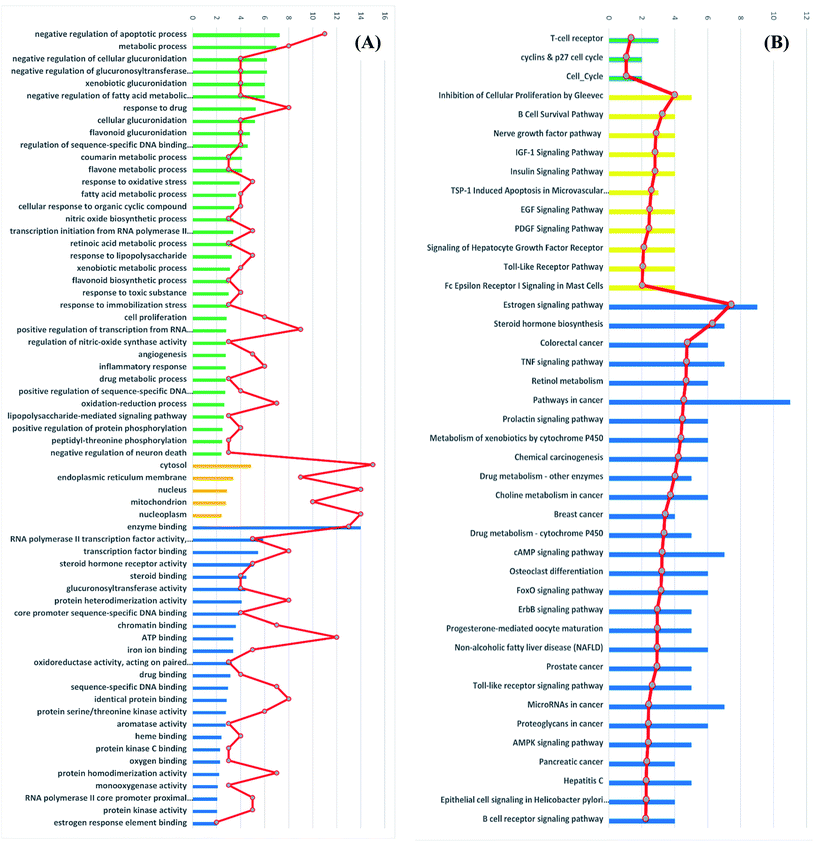
Gene ontology (GO) describes gene products with three independent categories: biological process, cellular component, and molecular function,41 which may produce multiple GO terms assigned to one query sequence. Gene ontology enrichment analysis of the identified 41 target genes was carried out using DAVID bioinformatics resources with the selection of Homo sapiens limit annotation. DAVID is a web-accessible program that combines functional genomic annotations with intuitive graphical summaries. Lists of gene or protein identifiers are rapidly annotated and summarized according to shared categorical data for gene ontology, protein domain, and biochemical pathway membership. DAVID assists in the interpretation of genome-scale datasets by facilitating the transition from data collection to biological meaning.42 From Fig. 7A it can be concluded that the most enriched biological processes were negative regulation of apoptotic process, metabolic process and negative regulation of cellular glucuronidation. As shown in Table 3, apoptosis or programmed cell death pathway involved three cancer-associated target genes; AKT1, CASP3 and PIK3CG interacting with propolis compounds. Where, Akt1 is the principal Akt isoform regulating apoptosis in limiting cytokine concentration.43 Caspase-3 is a frequently activated death protease, catalyzing the specific cleavage of many key cellular proteins.44 Moreover, inhibition of PIK3CG activation could enhance cancerous cells apoptosis. It is reported that PIK3CG is also a potential target for the treatment of few malignant tumors such as acute lymphoblastic leukemia, medulloblastoma and Kaposi sarcoma.45The most significant molecular functions were enzyme binding, RNA polymerase II transcription factor activity and transcription factor binding. Meanwhile, the most involved cellular components were cytosol, endoplasmic reticulum membrane and nucleus (Fig. 7A).
Moreover, the GO enrichment analysis using DAVID bioinformatics resources recognized 3 BBID pathways including T-cell receptor and cyclin and p27 cell cycle, 11 BIOCARTA pathways involving inhibition of cellular proliferation, nerve growth factor pathway and TSP-1 induced apoptosis and 28 KEGG pathways including estrogen signaling pathways, colorectal cancer, breast cancer and prostate cancer (Fig. 7B). All recognized pathways possessed P-value less than or equal to 0.01.
3.4. Molecular docking studies of hit compounds in the active sites of the most enriched cancer-associated target genes
The Glide module of the Schrodinger suite software was used for calculating the docking XP G scores of propolis hit compounds genistein, luteolin, benzoic acid, quercetin and vanillic acid against the active sites of the most enriched cancer-associated target genes CYP1A1, CYP19A1, ESR1, NOS3, CAPS3 and AKT1. From Table 4, it can be observed that quercetin had the lowest XP G score against cytochrome P450 1A1, estrogen receptor, caspase-3 and RAC-alpha serine/threonine-protein kinase. Whereas, genistein exhibited the most stabilized interaction with aromatase and endothelial nitric oxide synthase.| Cytochrome P450 1A1 (6DWN) | Aromatase (3EQM) | Estrogen receptor (4J26) | Endothelial nitric oxide synthase (1M9K) | Caspase-3 (3DEI) | RAC-alpha serine/threonine-protein kinase (3O96) | |
|---|---|---|---|---|---|---|
| Genistein | −10.968 | −9.634 | −10.428 | −7.951 | −7.615 | −8.583 |
| Lueolin | −11.551 | −8.521 | −10.703 | −7.107 | −6.747 | −10.114 |
| Benzoic acid | −5.395 | −3.564 | −5.646 | −7.126 | −2.907 | −4.194 |
| Quercetin | −11.606 | −8.765 | −11.074 | −7.434 | −8.056 | −10.452 |
| Vanillic acid | −6.277 | −5.170 | −7.070 | −7.840 | −4.466 | −5.236 |
The 2D and 3D interaction diagrams of quercetin in the active site of cytochrome P450 1A1 (PBD ID 6DWN) (Fig. 8A) revealed the formation of two hydrogen bonds between 3′ and 4′ hydroxyl groups and Asn222 and a stacking pi–pi interaction between the aromatic ring B of the flavone moiety and Phe224. Charged negative interactions were also observed with Asp313 and Asp320 in addition to hydrophobic interactions with Ile386, Ala317, Leu496, Phe319, Leu217, Phe258, Ile115, Leu312 and Phe123. Moreover, there were polar interactions with Ser122, Thr321 and Thr497.46
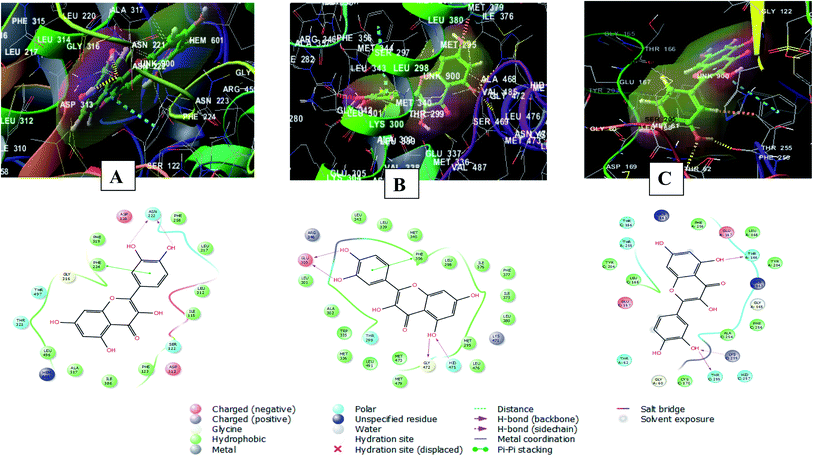 | ||
| Fig. 8 2D and 3D interaction diagrams of (A) quercetin in the active site of cytochrome P450 1A1 (PBD ID 6DWN) (B) quercetin in the active site of estrogen receptor (PDB ID 4J26) (C) quercetin in the active site of caspase-3 (PDB ID 3DEI). | ||
Meanwhile, the interaction of quercetin with estrogen receptor (PDB ID 4J26) involved four hydrogen bonds between 5, 3′, 4′ hydroxyl groups and Glu305, Gly472 and Hid475. In addition to a stacking pi–pi interaction between the aromatic ring B of the flavone moiety and Phe356. There were also hydrophobic interactions with Met336, Trp335, Met340, Leu339, Leu343, Leu 301, Ala302, Leu 298, Ile376, Leu380, Ile373, Phe377, Met295 and Leu476![[thin space (1/6-em)]](https://www.rsc.org/images/entities/char_2009.gif) 47 (Fig. 8B).
47 (Fig. 8B).
Furthermore, quercetin interacted with caspase-3 (PDB ID 3DEI) using three hydrogen bonds between 3′ and 5 hydroxyl groups and Thr255, Lys259 and Thr166. In addition to polar interactions with Thr62, Thr166 and Thr255 and hydrophobic interaction with Tyr204, Cys170, Phe256, Leu168, Tyr204, Phe256 and Leu168. There was also a charged negative interaction with Glu167![[thin space (1/6-em)]](https://www.rsc.org/images/entities/char_2009.gif) 48 (Fig. 8C).
48 (Fig. 8C).
Whereas, the stabilization of quercetin interaction with RAC-alpha serine/threonine-protein kinase (PDB ID 3O96) was through the formation of four hydrogen bonds between 5, 7, 3′ and 4′ hydroxyl groups and Gln79, Thr211and Ser205, and a pi–pi stacking interaction between the aromatic ring A of the flavone moiety and Trp80. There were also polar interactions with Thr81, Thr82 and Asn54 and hydrophobic interactions with Tyr263, Leu264, Ile84, Val270, Tyr272, Leu210, Ala212, and Ile290. In addition to positively charged interaction with Lys268 and negatively charged interaction with Asp292![[thin space (1/6-em)]](https://www.rsc.org/images/entities/char_2009.gif) 49 (Fig. 9A).
49 (Fig. 9A).
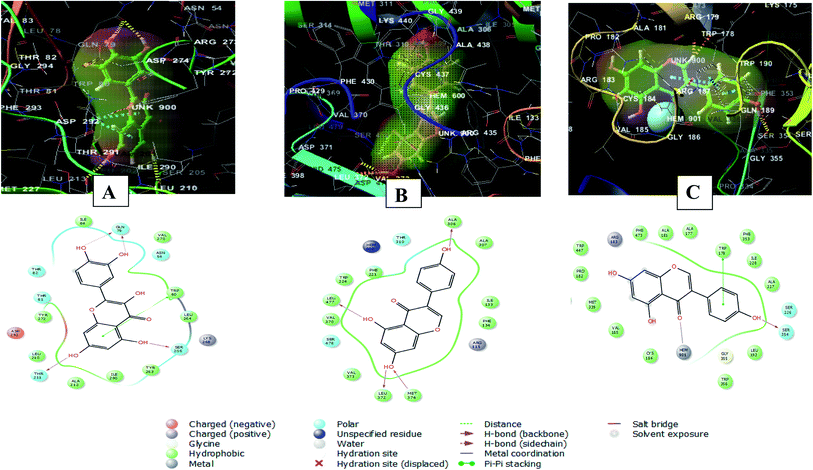 | ||
| Fig. 9 2D and 3D interaction diagrams of (A) quercetin in the active site of with RAC-alpha serine/threonine-protein kinase (PDB ID 3O96) (B) genistein in the active site of aromatase (PDB ID 3EQM) (C) genistein in the active site of endothelial nitric oxide synthase (PDB ID 1M9K). | ||
On the other hand, the interaction of genistein with aromatase (PDB ID 3EQM) involved four hydrogen bonds between 5, 7, 4′ hydroxyl groups and Ala 306, Leu477, Leu372 and Met374 residues. There were also hydrophobic interactions with Phe134, Ile133, Ala307, Trp224, Phe221, Val370 and Val 373 and polar interaction with Ser478 and Thr310. In addition to a charged positive interaction with Arg115![[thin space (1/6-em)]](https://www.rsc.org/images/entities/char_2009.gif) 50,51) (Fig. 9B). While the interaction of genistein with endothelial nitric oxide synthase (PDB ID 1M9K) was stabilized via the formation of a hydrogen bond between 4′ hydroxyl group and Ser354 and a pi–pi stacking interaction between the aromatic ring A of the flavone moiety and Trp178. In addition to the formation of coordination reaction with Hem901 and hydrophobic interactions with Leu193, Ala227, Ile228, Phe353, Phe473, Ala181, Met339, Trp447, Cys184. There were also a charged positive interaction with Arg183 and polar interaction with Ser226
50,51) (Fig. 9B). While the interaction of genistein with endothelial nitric oxide synthase (PDB ID 1M9K) was stabilized via the formation of a hydrogen bond between 4′ hydroxyl group and Ser354 and a pi–pi stacking interaction between the aromatic ring A of the flavone moiety and Trp178. In addition to the formation of coordination reaction with Hem901 and hydrophobic interactions with Leu193, Ala227, Ile228, Phe353, Phe473, Ala181, Met339, Trp447, Cys184. There were also a charged positive interaction with Arg183 and polar interaction with Ser226![[thin space (1/6-em)]](https://www.rsc.org/images/entities/char_2009.gif) 52 (Fig. 9C).
52 (Fig. 9C).
3.5. In vitro anticancer activity of propolis extract on human prostate (DU-145), breast (MCF-7) and colorectal (Caco-2) cancer cell lines
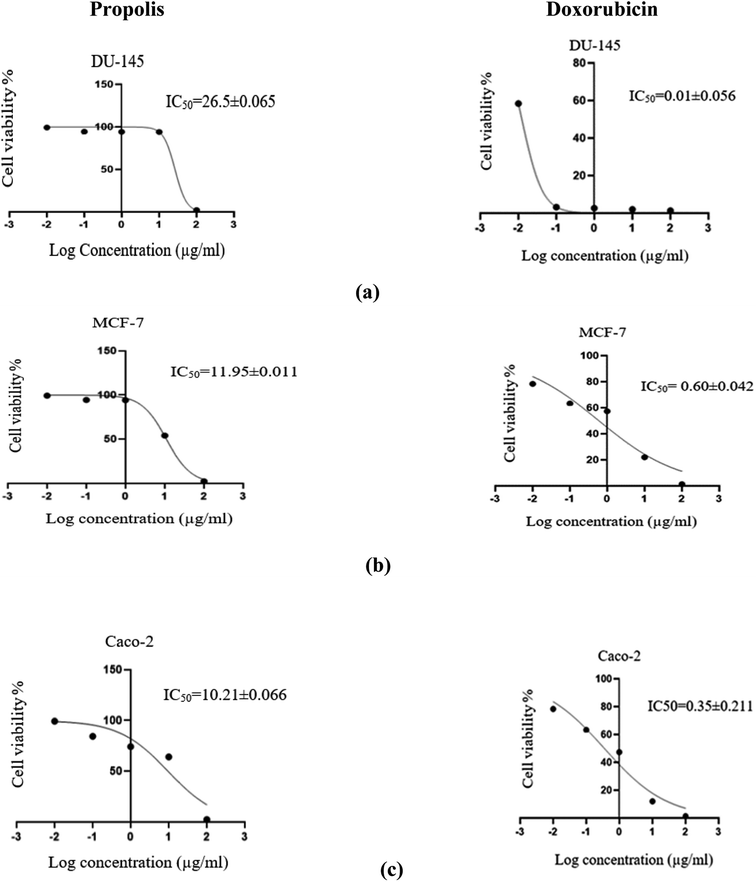
The propolis extract was subjected to in vitro anticancer activity testing on human prostate (DU-145), breast (MCF-7) and colorectal (Caco-2) cancer cell lines. The results shown in Fig. 10 indicated the high propolis potency against the studied cancer types, where it showed IC50 values equal to 26.5 ± 0.06, 11.95 ± 0.01 and 10.213 ± 0.07 μg mL−1 in human prostate (DU-145), breast (MCF-7) and colorectal (Caco-2) cancer cell lines, respectively. These results are concordant with the literature survey summarized in Table 3 demonstrating the activity of propolis constituents against the studied cancer cell lines where luteolin was found to induce G2/M cell-cycle arrest in human colon cancer cell lines.53 Whereas quercetin was reported to suppress viability and proliferation of MCF-7 cells by activation of both apoptosis and necroptosis signaling pathways.54 It was also found to exert anticancer effect on DU-145 cells by modulating ROS, Akt, and NF-κB pathways.55 The Egyptian propolis extract exhibited more potent cytotoxic activity than well-known cytotoxic agents such as platinum nanocatalysts56 and even propolis from other regions such as Moroccan and Indian propolis.57,58 DAVID pathway analysis of prostate (Fig. S1†), breast (Fig. S2†) and colorectal (Fig. S3†) cancer illustrates the potential targets and pathways of Egyptian propolis chemical constituents. The red ovals indicate the targets where the molecules interact and the pink rectangles indicate the targeted pathways.4. Conclusion
Due to the complex metabolome of natural products and the high cost of in-laboratory screening of their role and mechanism of action in various diseases, the network pharmacology-based analysis is regarded as a valuable mean to accomplish this task easily and more conveniently. In this study, the network pharmacology-based analysis of propolis showed that the hit propolis constituents related to cancer targets were genistein, luteolin, benzoic acid, quercetin and vanillic acid. Whereas, the main cancer-associated targets were CYP1A1, CYP19A1, ESR1, NOS3, CASP3 and AKT1. Twenty-four cancer-related pathways were recognized where the most enriched ones were pathways in cancer and estrogen signaling pathway. Among hit compounds, molecular docking studies revealed that quercetin had the lowest binding energy with cytochrome P450 1A1, estrogen receptor, caspase-3 and RAC-alpha serine/threonine-protein kinase. Whereas, genistein exhibited the most stabilized interaction with aromatase and endothelial nitric oxide synthase. This study represents a thorough explanation of the proposed mechanism of action of propolis constituents in cancer and suggests this natural product as a potential source of phytoconstituents that can be implemented for cancer prevention or treatment. Further extensive in vivo and clinical studies are required to confirm the anti-cancer potential of the concluded top hit natural compounds.Conflicts of interest
There are no conflicts to declare.References
- WHO, Preventing chronic diseases: a vital investment, https://www.who.int/chp/chronic_disease_report/en/, accessed February 16, 2021 Search PubMed.
- S. F. Sener and N. Grey, J. Surg. Oncol., 2005, 92, 1–3 CrossRef PubMed.
- C. D. Mathers and D. Loncar, PLoS Med., 2006, 3, e442 CrossRef PubMed.
- A. G. Desai, G. N. Qazi, R. K. Ganju, M. El-Tamer, J. Singh, A. K. Saxena, Y. S. Bedi, S. C. Taneja and H. K. Bhat, Curr. Drug Metab., 2008, 9, 581–591 CrossRef CAS PubMed.
- S. I. Anjum, A. Ullah, K. A. Khan, M. Attaullah, H. Khan, H. Ali, M. A. Bashir, M. Tahir, M. J. Ansari, H. A. Ghramh, N. Adgaba and C. K. Dash, Saudi J. Biol. Sci., 2019, 26, 1695–1703 CrossRef CAS PubMed.
- S. Patel, J. Diet. Suppl., 2016, 13, 245–268 CrossRef CAS PubMed.
- V. Bankova, M. Popova and B. Trusheva, Phytochemistry, 2018, 155, 1–11 CrossRef CAS PubMed.
- V. C. Toreti, H. H. Sato, G. M. Pastore and Y. K. Park, J. Evidence-Based Complementary Altern. Med., 2013, 2013, 1–13 CrossRef PubMed.
- M. Shahinozzaman, N. Taira, T. Ishii, M. Halim, M. Hossain and S. Tawata, Molecules, 2018, 23, 2479 CrossRef PubMed.
- C. Meneghelli, L. S. D. Joaquim, G. L. Q. Félix, A. Somensi, M. Tomazzoli, D. A. da Silva, F. V. Berti, M. B. R. Veleirinho, D. d. O. S. Recouvreux, A. C. de Mattos Zeri, P. F. Dias and M. Maraschin, Microvasc. Res., 2013, 88, 1–11 CrossRef CAS PubMed.
- B. Gogoi, D. Gogoi, Y. Silla, B. B. Kakoti and B. S. Bhau, Mol. BioSyst., 2017, 13, 406–416 RSC.
- M. Liao, H. Shang, Y. Li, T. Li, M. Wang, Y. Zheng, W. Hou and C. Liu, Phytomedicine, 2018, 45, 93–104 CrossRef CAS PubMed.
- J. Ma, J. Huang, S. Hua, Y. Zhang, Y. Zhang, T. Li, L. Dong, Q. Gao and X. Fu, J. Ethnopharmacol., 2019, 231, 152–169 CrossRef CAS PubMed.
- A. S. P. Pereira, M. J. Bester and Z. Apostolides, Mol. Diversity, 2017, 21, 809–820 CrossRef CAS PubMed.
- A. Upadhyay, P. Agrahari and D. K. Singh, Int. J. Pharmacol., 2014, 10, 289–298 CAS.
- A. L. Hopkins, Nat. Chem. Biol., 2008, 4, 682–690 CrossRef CAS PubMed.
- C. A. Lipinski, Drug Discovery Today: Technol., 2004, 1, 337–341 CrossRef CAS PubMed.
- X.-Q. Shi, S.-J. Yue, Y.-P. Tang, Y.-Y. Chen, G.-S. Zhou, J. Zhang, Z.-H. Zhu, P. Liu and J.-A. Duan, J. Ethnopharmacol., 2019, 235, 227–242 CrossRef PubMed.
- U. Chandran and B. Patwardhan, J. Ethnopharmacol., 2017, 197, 250–256 CrossRef PubMed.
- E. Shawky, A. A. Nada and R. S. Ibrahim, RSC Adv., 2020, 10, 27961–27983 RSC.
- M. Hong, Y. Zhang, S. Li, H. Y. Tan, N. Wang, S. Mu, X. Hao and Y. Feng, Molecules, 2017, 22, 1–11 Search PubMed.
- H. M. Dawood, R. S. Ibrahim, E. Shawky, H. M. Hammoda and A. M. Metwally, J. Ethnopharmacol., 2018, 224, 359–372 CrossRef CAS PubMed.
- L. Kubiliene, V. Laugaliene, A. Pavilonis, A. Maruska, D. Majiene, K. Barcauskaite, R. Kubilius, G. Kasparaviciene and A. Savickas, BMC Complementary Altern. Med., 2015, 15, 1–7 CrossRef CAS PubMed.
- R. M. Allam, A. M. Al-Abd, A. Khedr, O. A. Sharaf, S. M. Nofal, A. E. Khalifa, H. A. Mosli and A. B. Abdel-Naim, Toxicol. Lett., 2018, 291, 77–85 CrossRef CAS PubMed.
- P. Skehan, R. Storeng, D. Scudiero, A. Monks, J. Mcmahon, D. Vistica, J. T. Warren, H. Bokesch, S. Kenney and M. R. Boyd, J. Natl. Cancer Inst., 1990, 82, 1107–1112 CrossRef CAS PubMed.
- H. Tang, S. He, X. Zhang, S. Luo, B. Zhang, X. Duan, Z. Zhang, W. Wang, Y. Wang and Y. Sun, J. Evidence-Based Complementary Altern. Med., 2016, 2016, 1–10 Search PubMed.
- M. Kuhn, C. von Mering, M. Campillos, L. J. Jensen and P. Bork, Nucleic Acids Res., 2008, 36, D684–D688 CrossRef CAS PubMed.
- R. Apweiler, A. Bairoch, C. H. Wu, W. C. Barker, B. Boeckmann, S. Ferro, E. Gasteiger, H. Huang, R. Lopez, M. Magrane, M. J. Martin, D. A. Natale, C. O'Donovan, N. Redaschi and L. S. L. Yeh, Nucleic Acids Res., 2017, 45, D158–D169 CrossRef PubMed.
- H. M. Naif, M. A. I. Al-Obaide, H. H. Hassani, A. S. Hamdan and Z. S. Kalaf, Frontiers in Public Health, 2018, 6, 1–7 CrossRef PubMed.
- J. R. Long, N. Kataoka, X. O. Shu, W. Wen, Y. T. Gao, Q. Cai and W. Zheng, Cancer Epidemiol., Biomarkers Prev., 2006, 15, 2115–2122 CrossRef CAS PubMed.
- C. Thomas and J. Å. Gustafsson, Nat. Rev. Cancer, 2011, 11, 597–608 CrossRef CAS PubMed.
- L. Ying and L. J. Hofseth, Cancer Res., 2007, 67, 1407–1410 CrossRef CAS PubMed.
- N. O’donovan, J. Crown, H. Stunell, A. D. K. Hill, E. Mcdermott, N. O’higgins, M. J. Duffy and S. Vincent’, Clin. Cancer Res., 2003, 9, 738–742 Search PubMed.
- M. Song, A. M. Bode, Z. Dong and M. H. Lee, Cancer Res., 2019, 79, 1019–1031 CrossRef CAS PubMed.
- M. Kanehisa and S. Goto, Nucleic Acids Res., 2000, 28, 27–30 CrossRef CAS PubMed.
- Y. Li, F. Ahmed, S. Ali, P. A. Philip, O. Kucuk and F. H. Sarkar, Cancer Res., 2005, 65, 6934–6942 CrossRef CAS PubMed.
- D. Y. Lim, H. J. Cho, J. Kim, C. W. Nho, K. W. Lee and J. H. Y. Park, BMC Gastroenterol., 2012, 12, 1–10 CrossRef PubMed.
- J. Girouard, D. Belgorosky, J. Hamelin-Morrissette, V. Boulanger, E. D'Orio, D. Ramla, R. Perron, L. Charpentier, C. van Themsche, A. M. Eiján, G. Bérubé and C. Reyes-Moreno, Biochem. Pharmacol., 2020, 176, 1–15 CrossRef PubMed.
- L. Khorsandi, M. Orazizadeh, F. Niazvand, M. R. Abbaspour, E. Mansouri and A. Khodadadi, Bratislava Medical Journal, 2017, 118, 123–128 CrossRef CAS PubMed.
- J. Gong, S. Zhou and S. Yang, Int. J. Mol. Sci., 2019, 20, 1–18 Search PubMed.
- M. Ashburner, C. A. Ball, J. A. Blake, D. Botstein, H. Butler, J. M. Cherry, A. P. Davis, K. Dolinski, S. S. Dwight, J. T. Eppig, M. A. Harris, D. P. Hill, L. Issel-Tarver, A. Kasarskis, S. Lewis, J. C. Matese, J. E. Richardson, M. Ringwald, G. M. Rubin and G. Sherlock, Nat. Genet., 2000, 25, 25–29 CrossRef CAS PubMed.
- G. Dennis Jr, B. T. Sherman, D. A. Hosack, J. Yang, W. Gao, H. C. Lane and R. A. Lempicki, Genome Biol., 2003, 4, R60.1–R60.11 CrossRef.
- B. D. Green, A. M. Jabbour, J. J. Sandow, C. D. Riffkin, D. Masouras, C. P. Daunt, M. Salmanidis, G. Brumatti, B. A. Hemmings, M. A. Guthridge, R. B. Pearson and P. G. Ekert, Cell Death Differ., 2013, 20, 1341–1349 CrossRef CAS PubMed.
- A. G. Porter and R. U. Jänicke, Cell Death Differ., 1999, 6, 99–104 CrossRef CAS PubMed.
- J. Chang, L. Hong, Y. Liu, Y. Pan, H. Yang, W. Ye, K. Xu, Z. Li and S. Zhang, Cancer Manage. Res., 2020, 12, 2641–2651 CrossRef CAS PubMed.
- V. P. Androutsopoulos, A. Papakyriakou, D. Vourloumis, A. M. Tsatsakis and D. A. Spandidos, Pharmacol. Ther., 2010, 126, 9–20 CrossRef CAS PubMed.
- N. v. Puranik, P. Srivastava, G. Bhatt, D. J. S. John Mary, A. M. Limaye and J. Sivaraman, Sci. Rep., 2019, 9, 1–11 CAS.
- B. Muthukala, K. Sivakumari and K. Ashok, Int. J. Curr. Pharm. Res., 2015, 7, 13–16 CAS.
- X. Bai, Y. Tang, Q. Li, Y. Chen, D. Liu, G. Liu, X. Fan, R. Ma, S. Wang, L. Li, K. Zhou, Y. Zheng and Z. Liu, Sci. Rep., 2021, 11, 1–25 CrossRef PubMed.
- M. van Dijk, A. M. ter Laak, J. rg D. Wichard, L. Capoferri, N. P. E. Vermeulen and D. P. Geerke, J. Chem. Inf. Model., 2017, 57, 2294–2308 CrossRef CAS PubMed.
- E. D. Lephart, Enzyme Res., 2015, 2, 1–11 Search PubMed.
- H. Si, J. Yu, H. Jiang, H. Lum and D. Liu, Endocrinology, 2012, 153, 3190–3198 CrossRef CAS PubMed.
- W. Wang, P. C. VanAlstyne, K. A. Irons, S. Chen, J. W. Stewart and D. F. Birt, Nutr. Cancer, 2004, 48, 106–114 CrossRef CAS PubMed.
- L. Khorsandi, M. Orazizadeh, F. Niazvand, M. R. Abbaspour, E. Mansouri and A. Khodadadi, Bratislava Medical Journal, 2017, 118, 123–128 CrossRef CAS PubMed.
- A. B. Ward, H. Mir, N. Kapur, D. N. Gales, P. P. Carriere and S. Singh, World Journal of Surgical Oncology, 2018, 16, 1–12 CrossRef PubMed.
- P. G. González-Larraza, T. M. López-Goerne, F. J. Padilla-Godínez, M. A. González-López, A. Hamdan-Partida and E. Gómez, ACS Omega, 2020, 5, 25381–25389 CrossRef PubMed.
- S. Touzani, W. Embaslat, H. Imtara, A. Kmail, S. Kadan, H. Zaid, I. Elarabi, L. Badiaa, B. Saad and Y. Kabir, BioMed Res. Int., 2019, 1–11 Search PubMed.
- M. K. Choudhari, R. Haghniaz, J. M. Rajwade and K. M. Paknikar, Evidence-Based Complementary and Alternative Medicine, 2013, pp. 1–10 Search PubMed.
Footnote |
| † Electronic supplementary information (ESI) available. See DOI: 10.1039/d1ra01390d |
| This journal is © The Royal Society of Chemistry 2021 |

