 Open Access Article
Creative Commons Attribution 3.0 Unported Licence
3D mesoporous structure assembled from monoclinic M-phase VO2 nanoflakes with enhanced thermochromic performance†
Liboro Hundito Molloro *ab,
Shouqin Tain
 a,
Neway Belachew
 b,
Kwadwo Asare Owusuc and
Xiujian Zhao
 *a
*a
aState Key Laboratory of Silicate Materials for Architectures, Wuhan University of Technology (WUT), No. 122, Luoshi Road, Wuhan 430070, P. R. China. E-mail: liborotg@yahoo.com; opluse@whut.edu.cn
bDepartment of Chemistry, Debre Berhan University, P.O. Box 445, Debre Berhan, Ethiopia
cState Key Laboratory of Advanced Technology for Materials Synthesis and Processing, Wuhan University of Technology (WUT), No. 122, Luoshi Road, Wuhan 430070, P. R. China
First published on 13th April 2021
Abstract
Monoclinic M-phase VO2 is a promising candidate for thermochromic materials due to its abrupt change in the near infrared (NIR) transmittance along with the metal-to-insulator transition (MIT) at a critical temperature ∼68 °C. However, low luminous transmittance (Tlum), poor solar energy modulation ability (ΔTsol), and high phase transition temperature (Tc) can limit the application of VO2 for smart windows. To overcome these limitations, 3D mesoporous structure can be employed in VO2 films. Herein, 3D mesoporous structures assembled from monoclinic M-phase VO2 nanoflakes with a pore size of about 2–10 nm were synthesized by a hydrothermal method using Ensete ventricosum fiber (EF) as a template followed by calcination at 450 °C. The prepared film exhibited excellent thermochromic performance with balanced Tlum = 67.3%, ΔTsol = 12.5%, and lowering Tc to 63.15 °C. This is because the 3D mesoporous structure can offer the uniform dispersion of VO2 nanoflakes in the film to enhance Tlum, ensure sufficient VO2 nanoflakes in the film for high ΔTsol and lower Tc. Therefore, this work can provide a green approach to synthesize 3D mesoporous structures assembled from monoclinic M-phase VO2 nanoflakes and promote their application in smart windows.
1. Introduction
The demand for energy-efficient smart windows utilizing thermochromic materials is constantly increasing due to their potential to dramatically reduce the energy consumption of the buildings by modulating the transmission of light and heat.3–7 Vanadium dioxide (VO2) has been widely investigated for smart windows because of its excellent thermochromic properties.8–10 In particular, monoclinic M-phase VO2 undergoes a metal-to-insulator transition (MIT) at a critical temperature of ∼68 °C.12–14 The monoclinic crystal structure of VO2 displays infrared transparent below the critical temperature while in a rutile crystal structure it is infrared-reflective above the critical temperature accompanied by abrupt changes in the electrical, magnetic, and optical properties.1,16–18 Due to this special MIT property, monoclinic M-phase VO2 is a promising candidate for the thermochromic smart window.23,24 However, low luminous transmittance (Tlum), which is not higher than ∼40%,16,27 poor solar energy modulation ability (ΔTsol), which is usually less than 10%16,27 and high phase transition temperature (Tc) ∼68 °C, which should be lowered to room temperature,1,13,20 limits the application of VO2 in smart windows. Up to the present, various attempts have been made to overcome these limitations,13,31 including introducing pores,29,30,32 structural modification,2,35 designing 2D nanoarchitecture,7,33,34 core–shell,24 multilayer stack design,36 doping,1,20 composite15,22,26 and film thickness optimization.37 Optical calculation confirms that incorporation of VO2 in another dielectric material could increase Tlum and ΔTsol.27,38 The simulation conducted by Taylor et al.39 and the sample prepared by Qian et al.35 as structural modification can enhance Tlum and ΔTsol. Guo et al.28 fabricated flexible VO2-based thermochromic films by dispersing the VO2 powders in a polymer matrix. The Tlum and ΔTsol of these flexible films reached 54.26% and 12.34%, respectively. Cao et al.29 used the freeze-drying method to prepare VO2 film with nanoporous structure, and the film showed the best Tlum = 50% and ΔTsol = 14.7%. Therefore, structurally modified VO2 nanoparticles distributed in another dielectric matrix can offer high value of Tlum and ΔTsol.Inspired by this concept, 3D architecture with mesopores are introduced in the monoclinic M-phase VO2 films. Liu et al. fabricated ordered M-phase VO2 honeycomb structures with a complex hierarchy by a template-free surface patterning method.2 The ordered M-phase VO2 honeycomb structure film exhibited a high Tlum of 95.4%. However, the solar energy modulation ability was only 5.5%. Ke et al.34 reported 2D patterned M-phase VO2 nanonet films with controlled periodicity. The film exhibited a high ΔTsol of 13.2%. However, the value of Tlum was only 46.1%. In this regard, it is a great challenge to introduce surface modification with a desirable architecture in VO2 film to obtain excellent performance with balanced Tlum and ΔTsol. Most reported works of literature are focused either on surface modification29,30 or designing 2D nanoarchitectures.7,34 However, the effect of 3D mesoporous structures assembled by VO2 nanoflakes based thermochromic films has not been reported so far. Therefore, it is of great importance to investigate the effect of microstructure on 3D mesoporous structure assembled by monoclinic M-phase VO2 nanoflakes on the thermochromic properties of VO2 films.
Herein, we have prepared 3D mesoporous structures assembled by monoclinic M-phase VO2 nanoflakes using a facile hydrothermal method followed by calcination in the presence of Ensete ventricosum fiber (EF) as a template. The crystal structure, morphology, shape, composition and pore size distribution of the synthesised materials were investigated by powder XRD, SEM/EDS, TEM, XPS and BET. The film prepared from the synthesised materials were investigated for thermochromic smart window applications.
2. Experiments and characterization
2.1. Preparation of 3D mesoporous structures assembled by monoclinic M-phase VO2 nanoflakes
All reagents were of the analytical grade and were used without further purification. In a typical synthesis, 0.63 g (0.0034 mol) of vanadium pentoxide (V2O5) and 1.2859 g (0.0102 mol) of oxalic acid (H2C2O4·2H2O) were dissolved in 30 ml of deionized water. The suspension was stirred constantly in a water bath kettle at 80 °C until the color of the solution changed to blue. Then 30 ml of ethylene glycol was added to increase the viscosity of the solution. As the acidic solution degrades EF, ammonia was added to adjust the pH to ∼7. The solution and 0.5 g of EF were transferred to a 100 ml Teflon-lined stainless-steel autoclave. The autoclave was maintained at a temperature of 180 °C for 20 h and then cooled to room temperature naturally. The black product with EF was separated and washed with water and ethanol, and then dried in air at 80 °C for 24 h. To remove the template and to obtain the 3D porous structure, the product was calcined at 450 °C for 1 h at a heating rate of 5 °C min−1. During the calcination, VO2 nanoflakes were oxidized to yellow 3D mesoporous structure assembled by V2O5 nanoflakes. Finally, the obtained 0.4 g 3D mesoporous structure assembled by V2O5 nanoflakes and 0.2 g NH4HCO4 were placed in a vacuum tube furnace for annealing at 550 °C for 30 min. Ammonia gas produced from the decomposition of NH4HCO4 reduced the 3D mesoporous structure assembled by V2O5 nanoflakes to 3D mesoporous structure assembled by monoclinic M-phase VO2 nanoflakes. For comparison, monoclinic M-phase VO2 was also synthesized under similar conditions without EF S1 (ESI).†2.2. Preparation of thermochromic films
The obtained 0.5 g 3D mesoporous structure assembled by, monoclinic M-phase VO2 nanoflakes were dispersed in ethanol that contained an appropriate amount of PVP (0.25 g) for subsequent ball milling and sonication to ensure well mixing. After centrifugation, this suspension was then uniformly cast onto a fused silica glass substrate (25 mm × 25 mm × 1 mm) by spin-coating at the speed of 500 rpm for 15 s and then 1500 rpm for 30 s. Finally, the ethanol was removed by drying at 80 °C for 5 min to get the film of 3D mesoporous structure assembled by M-phase VO2 nanoflakes based composite.2.3. Characterizations
X-ray diffraction (XRD, D8DISCOVER, Cu Kα1 = 0.154056 nm as the source of radiation, output power 3 kW) was employed to determine the crystal phase of obtained samples. A field emission scanning electron microscopy (FE-SEM, JSM-7500F, JEOL, Japan) and a Hitachi S4800 electron microscope operating at 15 kV were employed to observe the morphology of the nanoflakes and films. Transition electron microscopy (TEM) images were recorded with a (TEM, FEG, Talos F200S, Thermo Fisher, USA) microscope operated at 200 kV. The BET analyzer (ASAP 2020) was used to measure the pore size distribution and the specific surface area with nitrogen as an adsorbate, and the pore size distribution was calculated by the Brunauer–Emmett–Teller (BET) method. The compositions of the powder nanoflakes were detected by X-ray photoelectron spectroscopy (XPS, ESCALAB 250Xi). The phase transition properties were detected by differential scanning calorimeter (DSC, DSC8500, American PE). The thermochromic performance of the films was measured from 300 to 2500 nm by UV-vis-NIR spectrophotometer (UV-3600) equipped with temperature controlling unit at 20 °C and 90 °C, respectively. The integral luminous transmittance (Tlum, 380–780 nm) and solar transmittance (Tsol, 300–2500 nm) were calculated based on the measured spectra using the following expression:40| Tlum/sol = ∫φlum/sol(λ)T(λ)dλ/∫φlum/sol(λ)dλ |
3. Results and discussion
3.1. Structure and composition of 3D mesoporous structure assembled by monoclinic M-phase VO2 nanoflakes
Scheme 1 shows the synthesis root and surface morphology of 3D mesoporous structure assembled by monoclinic M-phase VO2 nanoflakes. The well-mixed precursor solution was added into Teflon-lined stainless-steel autoclave containing EF for the hydrothermal process for adsorption. The negative surface charge from carboxyl (COO−) and other hydrophilic functional groups on the fiber surface facilitate the favorable adsorption of the vanadyl complex.41 EF can greatly increase solid–liquid interface so that the nucleation occurs easily on the surface42 and then grew into nanoflakes layer by layer interaction with keeping a similar morphology to that of raw EF. In the second step, 3D mesoporous structure assembled by V2O5 nanoflakes were produced after calcination of the adsorbed fiber at 450 °C in the presence of air to remove the EF template, the results are described in detail in Fig. S2 (ESI).† In this step, VO2 nanoflakes were converted into a 3D mesoporous structure assembled by V2O5 nanoflakes because of the oxidation reaction. The 3D structure and pore formation are directed by EF during the calcination process. Lastly, post-annealing in reducing ammonia atmosphere produced from the decomposition of NH4HCO4 yields a 3D mesoporous structure assembled by M-phase VO2 nanoflakes.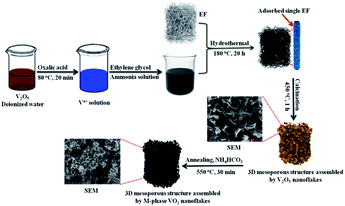 | ||
| Scheme 1 Schematic illustration of the whole process for synthesis of the 3D mesoporous structure assembled by monoclinic M-phase VO2 nanoflakes. | ||
To investigate the effect of the hydrothermal temperature on the structure and pore size, M-phase VO2 nanoflakes were synthesised at 160 °C, 180 °C and 200 °C. However, at 160 °C, the experiment failed. The phenomena suggest that temperature is low to facilitate the adsorption and subsequent growth of the nucleus in the surface of EF. The hydrothermal temperature of 200 °C was effective but relatively high energy cost. The obtained result for 200 °C is presented in Fig. S2 (ESI).† As a result, 180 °C is found to be optimum to carry out the experiment.
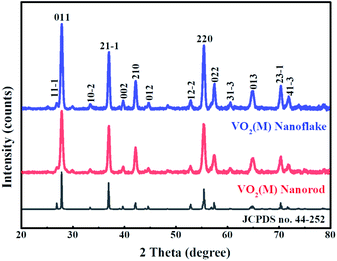
The crystal structure and phase composition of samples were measured by XRD (Fig. 1). The diffraction peaks of VO2 samples synthesised with and without a template was found to be well fitted to the standard XRD pattern of a monoclinic M-phase VO2 phase (space group:P21/c, (no. 14) JCPDS No. 44-252) and no peaks of any other vanadium oxide phases or impurities are detected. There is no obvious difference in diffraction patterns of the two samples, suggesting that Ensete ventricosum fiber (EF) template has no effect on the phase structure of samples. Moreover, the peak intensity of (011) plane of 3D mesoporous structure assembled by M-phase VO2 nanoflakes is relatively stronger and narrower than that of the monoclinic M-phase VO2 nanorods, indicating a higher crystallinity in the monoclinic M-phase VO2 nanoflakes.
The morphology of 3D mesoporous structure assembled by monoclinic M-phase VO2 were investigated through SEM and TEM. As shown in Fig. 2(a) and (b), a 3D mesoporous structure assembled by monoclinic M-phase VO2 exhibits a porous structure composed of uniform nanoflakes with a diameter of ∼90 nm, hundreds of nanometers length and ∼20 nm thickness. Interestingly, the VO2 product is 3D mesoporous structure assembled by monoclinic M-phase VO2 nanoflakes with many pores. The TEM image of the 3D mesoporous structure assembled by monoclinic M-phase VO2 nanoflakes Fig. 2(c), shows the stacks of nanoflakes with many small pores (2–10 nm in the diameter) and some other pores in the range of 10–50 nm in diameter between nanoflakes. This is in good agreement with the morphology observed in the SEM images in Fig. 2(a) and (b). The high-resolution TEM (HRTEM) image Fig. 2(d) taken from the edge of a single nanoflakes Fig. 2(c), shows clear lattice fringes with interplanar d-spacing of 0.32 nm, which is corresponding to the (011) lattice plane of monoclinic M-phase VO2. This is consistent with the XRD results, indicating high crystallinity for 3D mesoporous structure assembled by monoclinic M-phase VO2 nanoflakes.
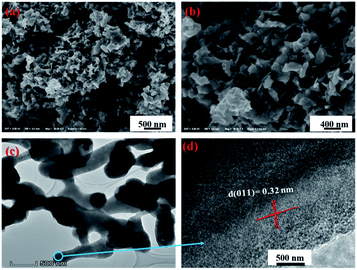 | ||
| Fig. 2 (a) and (b) SEM at different magnification, (c) TEM and (d) HRTEM images of 3D mesoporous structure assembled by monoclinic M-phase VO2 nanoflakes. | ||
High-angle annular dark-field (HAADF) scanning transmission electron microscopy (STEM) and energy-dispersive spectroscopy (EDS) elemental mapping were used to investigate the chemical analysis of 3D mesoporous structure assembled by monoclinic M-phase VO2 nanoflakes (Fig. 3). The HAADF image of obtained 3D mesoporous structure assembled by monoclinic M-phase VO2 nanoflakes in Fig. 3(a), shows a 3D uniform stack flakes providing high surface area and mesoporosity. The uniform distribution is also confirmed by EDS recorded from various regions of 3D mesoporous structure assembled by monoclinic M-phase VO2 nanoflakes in Fig. 3(b) and (c). The elemental mapping of constituting elements V and O in Fig. 3(b) and (c) demonstrate a well-defined compositional profile of the 3D mesoporous structure assembled by M-phase VO2 nanoflakes.
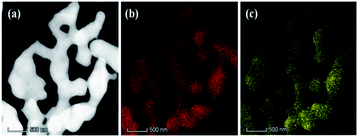 | ||
| Fig. 3 HAADF image (a) and elemental mapping of V (b) and O (c) of obtained 3D mesoporous structure assembled by monoclinic M-phase VO2 nanoflakes. | ||
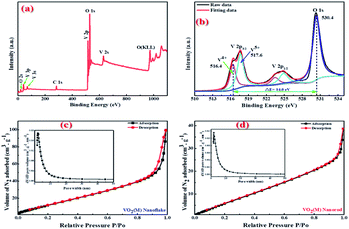
The oxidation state of vanadium in the obtained 3D mesoporous structure assembled by monoclinic M-phase VO2 nanoflakes was examined by X-ray photoelectron spectroscopy (XPS) and the results are shown in Fig. 4. The fully scanned survey spectra show the presence of only V and O, and no other elements exist in Fig. 4(a). The C1s peak (284.6 eV) in the survey is used as a reference. Fig. 4(b) shows the high-resolution XPS spectra of V2p and O1s peaks as well as their deconvolution which can be fitted by applying a Shirley function with software XPS peak 4.1. The V2p3/2 peak can be deconvoluted into two peaks, which correspond to V5+ and V4+, with the binding energy of 517.6 and 516.4 eV, respectively.43 The O1s centered at 530.4 eV can be assigned to the O2− in the V–O.44 The presence of V5+ ion could be attributed to the partial oxidation of the nanoflakes powder exposed in the air.43 Besides, the energy bandgap between V2p3/2 and O1s of V5+ and V4+ are 12.8 and 14.0 eV, respectively, which are in good agreement with reported values of 12.8 and 14.16 eV.44,45
BET characterization was carried out to further investigate the porous structure of the synthesized 3D mesoporous structure assembled by monoclinic M-phase VO2 nanoflakes. As it is shown in Fig. 4(c), the N2 absorption–desorption isotherm belongs to type IV isotherm with H2 hysteresis loop,46 which arises from the presence of relatively uniform pore network and ink-bottle shaped pores.47 With this isotherm type, capillary condensation at lower adsorbate pressure as well as sharp capillary condensation at higher pressure takes place, indicating that there are abundant mesopores in the 3D mesoporous structure assembled by monoclinic M-phase VO2 nanoflakes.48 From the pore size distribution curve in the inset of Fig. 4(c), the typical pore size is in the range of 2–10 nm. Furthermore, the total porosity of a material can be categorized into three main groups based on pore size. By IUPAC definition, micropores have pore diameters less than 2 nm, mesopores have pore sizes between 2 and 50 nm, and macropores have pore sizes larger than 50 nm.49 The BET surface area and average mean pore size were 42.7 m2 g−1 and 7.8 nm, respectively. Which confirms the mesoporosity of 3D mesoporous structure assembled by M-phase VO2 nanoflakes.
The pore size distribution curves and N2 adsorption–desorption curves of M-phase VO2 synthesized in the absence of template (monoclinic M-phase VO2 nanorod) are shown in Fig. 4(d). It can be seen that the adsorption isotherm displays type IV behavior with H2 hysteresis loop.46 From the pore size distribution curve in the inset of Fig. 4(d), the typical pore size is in the range of 2–10 nm. The BET surface area and average mean pore size of nanorods are 19.8 m2 g−1 and 5.8 nm, respectively. It is believed that mesopores are mainly distributed in M-phase VO2 nanorods, which is consistent with TEM results in Fig. 5(c).
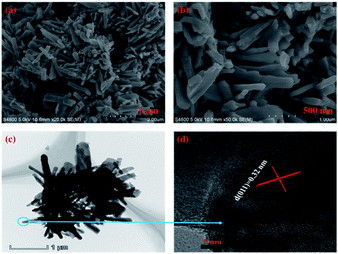 | ||
| Fig. 5 (a) Low- and (b) high-magnification SEM, (c) TEM and (d) HRTEM images of monoclinic M-phase VO2 nanorod. | ||
The morphology and microstructure of the monoclinic M-phase VO2 nanorods were also observed by SEM and TEM, as shown in Fig. 5. The SEM images Fig. 5(a) and (b) reveal that the monoclinic M-phase VO2 nanorods are randomly oriented with an average diameter of ∼120 nm. Besides, the nanorods are loosely interconnected with open spaces existing between them, suggesting the formation of small pores. The TEM image Fig. 5(c) unambiguously reveals that the nanorods are interconnected with each other to form their inner space, which is in good agreement with the SEM observations. Fig. 5(d) shows the HRTEM image of monoclinic M-phase VO2 nanorods taken from the edge of a single nanorod in Fig. 5(c), the d-spacing of lattice fringe is 0.32 nm, which match well with the (011) lattice plane of monoclinic M-phase VO2. This is consistent with the XRD results in Fig. 1.
3.2. The thermochromic characteristics of the films
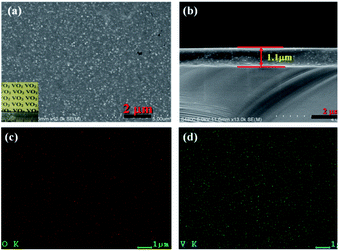
To investigate the thermochromic properties of thin films, the 3D mesoporous structure assembled by monoclinic M-phase VO2 nanoflakes were dispersed in ethanol that contained PVP and the suspension was uniformly cast onto a float glass substrate by spin-coating as shown in Scheme 2. It can be seen from Fig. 6(a), the films are transparent, homogeneous and light brownish-yellow in color. The thickness of the film is about 1.1 μm Fig. 6(b), which is smaller than that of reported composite films,1,26 and possesses a high visible light transmittance. To enhance the thermochromic property of the thin film, uniform dispersion of the particles in to the deposited film have crucial effect.1 Therefore, the uniform distribution of V and O in the 3D mesoporous structure assembled by M-phase VO2 nanoflakes films have been observed by EDS elemental mapping Fig. 6(c) and (d). The figures show the V and O elements are uniformly distributed in the film without agglomeration, indicating a homogeneous dispersion of 3D mesoporous structure assembled by monoclinic M-phase VO2 nanoflakes in the film.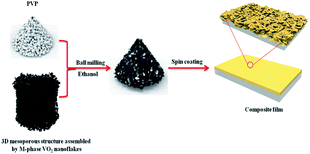 | ||
| Scheme 2 Schematic illustration of the process used for preparation of 3D mesoporous structure assembled by monoclinic M-phase VO2 nanoflakes based composite film. | ||
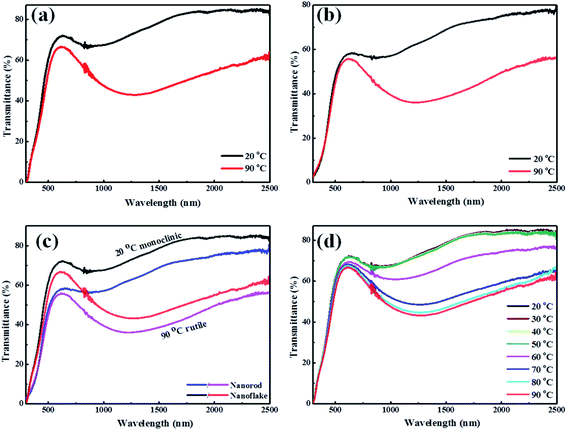
To further investigate the thermochromic properties of thin films, the UV-vis-NIR transmittance spectra were conducted at different temperatures (Fig. 7). As it is shown in Fig. 7(a), the 3D mesoporous structure assembled by monoclinic M-phase VO2 nanoflakes based composite film exhibited excellent optical properties as compared to that of monoclinic M-phase VO2 nanorod Fig. 7(b). The calculated optical properties (Tlum and ΔTsol) are summarized and compared with previous reports in Table 1.
| System | (Tlum)% | (ΔTsol)% | Reference |
|---|---|---|---|
| VxW1−xO2(M)@SiO2 NP based films | 50.6 | 14.7 | 1 |
| VO2/NLETS hybrid films | 73.4 | 18.2 | 15 |
| Zr/W-codoped VO2 NP based films | 58.4 | 12.3 | 20 |
| VO2(M) NP based films | 62.1 | 12.4 | 22 |
| Fine crystalline VO2 NP based films | 45.6 | 22.0 | 26 |
| Flexible VO2 NP based films | 54.26 | 12.34 | 28 |
| Nanoporous M-phase VO2 thin films | 50.6 | 14.7 | 29 |
| Mesoporous SiO2/VO2 films | 80.0 | 10.2 | 30 |
| Ordered M-phase VO2 honeycomb films | 95.4 | 5.5 | 2 |
| 2D VO2/TiO2 nanonet films | 64.46 | 11.82 | 33 |
| 2D patterned M-phase VO2 nanonet films | 46.1 | 13.2 | 34 |
| M-phase VO2 nanorods films | 53.2 | 10 | This work |
| 3D mesoporous structure assembled by monoclinic M-phase VO2 nanoflakes film | 67.3 | 12.5 | This work |
The 3D structure and mesoporosity show great effects on the optical properties. The Tlum and ΔTsol of 3D mesoporous structure assembled by monoclinic M-phase VO2 nanoflakes films are 67.3% and 12.5% while that of M-phase VO2 nanorods are 53.2% and 10%, respectively. This is because the 3D structure and porosity offer the better dispersion of flakes with PVP during film preparation (Scheme 2) and thereby enhance thermochromic properties. The high luminous transmittance is crucial for smart window2 and attributed to the 3D structure and mesoporosity of nanoflakes. The 3D mesoporous structure assembled by monoclinic M-phase VO2 nanoflakes also enables the film to contain enough VO2 for high solar modulation.32 From this, the 3D structure and mesoporosity of nanoflakes play a great role in regulating the visible light transmittance and solar modulation ability. The optical properties of M-phase VO2 nanorod film is also good as compared with previous reports. This is because the loosely interconnected nanorods form small pores without the presence of EF. Fig. 7(c) shows the visible transmittance of 3D mesoporous structure assembled by monoclinic M-phase VO2 nanoflakes is higher than M-phase VO2 nanorods. Fig. 7(d) shows transmittance spectra of 3D mesoporous structure assembled by monoclinic M-phase VO2 nanoflakes films at different temperatures in which a critical temperature (Tc) exists between 60 °C and 70 °C. The 3D mesoporous structure assembled by monoclinic M-phase VO2 nanoflakes based composite film exhibit much higher balanced Tlum and ΔTsol values than20,22,28,33 and slightly lower values than that of.15 The 3D mesoporous structure assembled by M-phase VO2 nanoflakes based composite film also exhibits higher Tlum and slightly lower ΔTsol values.1,26,29 The ordered monoclinic M-phase VO2 honeycomb films2 exhibited higher Tlum but ΔTsol was too low. In this regards, 3D mesoporous structure assembled by M-phase VO2 nanoflakes based composite film exhibit excellent balanced performance between Tlum and ΔTsol.
3.3. Metal-to-insulator transition properties of 3D mesoporous structure assembled by monoclinic M-phase VO2 nanoflakes
The metal-to-insulator transition properties of 3D mesoporous structure assembled by M-phase VO2 nanoflakes and monoclinic M-phase VO2 nanorod was determined by differential scanning calorimeter (DSC). As shown in Fig. 8, both DSC curves exhibit a clear endothermic peak and an exothermic peak corresponding to a reversible phase transition between M-phase and R-phase. The endothermic transition temperature (Tc,h) during heating cycles was observed at 66.6 °C and an exothermic transition temperature (Tc,c) during cooling cycles was observed at 59.7 °C for 3D mesoporous structure assembled by monoclinic M-phase VO2 nanoflakes. So, the phase transition temperature of 63.15 °C is calculated by Tc = (Tc,h + Tc,c)/2,37 which is lower than 63.9 °C for M-phase VO2 nanorods, ordered honeycomb,2 nanorings,21 nanobelts11 and 68 °C for the bulk. The hysteresis width (ΔT = Tc,h − Tc,c) of 3D mesoporous structure assembled by monoclinic M-phase VO2 nanoflakes is 6.9 °C, which is much lower than previously reported values2,11,19,21,25 and also lower than that of M-phase VO2 nanorod 8.6 °C, but slightly higher than that of nanobelts.11 This reduction of Tc by 3D mesoporous structure assembled by M-phase VO2 nanoflakes is due to the uniform dispersion of VO2. Table 2 summarizes phase transition temperature for heating and cooling cycles of M-phase VO2 with different morphologies. However to get a further reduction of Tc modification of morphology,50 size,51 defect,52 interfacial effect,11 Stress,52 and phase purity53 have been reported. Particularly doping of metals such as W,54–57 Mo,57,58 and Nb57,58 were reported for the reduction of Tc. Hence, synthesis materials with optimum Tlum, Tsol, and Tc values for practical thermochromic applications are required.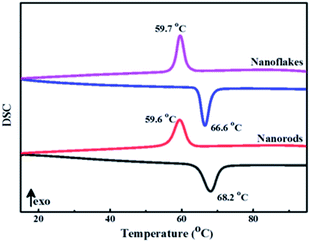 | ||
| Fig. 8 DSC curves of 3D mesoporous structure assembled by monoclinic M-phase VO2 nanoflakes and monoclinic M-phase VO2 nanorods. | ||
| M-phase VO2 morphology | Tc,h | Tc,c | Tc | ΔT | Reference |
|---|---|---|---|---|---|
| Ordered honeycomb | 81 | 59 | 70 | 22 | 2 |
| Star-shaped nanoparticles | 68.6 | 55.2 | 61.9 | 13.4 | 11 |
| Cucumber-like shape | 67.5 | 57.9 | 62.7 | 9.6 | 19 |
| Nanorings | 68.75 | 59.77 | 64.26 | 8.98 | 21 |
| Belt with a rectangular cross-section | 66 | 57 | 61.5 | 9 | 25 |
| Nanobelts | 68.9 | 62.44 | 65.67 | 6.46 | 11 |
| Nanorods | 68.2 | 59.6 | 63.9 | 8.6 | This work |
| 3D assembled by nanoflakes | 66.6 | 59.7 | 63.15 | 6.9 | This work |
4. Conclusion
In conclusion, 3D mesoporous structure assembled by monoclinic M-phase VO2 nanoflakes with pore size of about 2–10 nm were synthesized by a facile hydrothermal method at temperature of 180 °C using Ensete ventricosum fiber (EF) as a template. The EF facilitates the 3D structure and pore formation in the VO2 nanoflakes and thus enhances thermochromic properties. The composite film obtained from 3D mesoporous structure assembled by monoclinic M-phase VO2 nanoflakes with PVP exhibited excellent thermochromic properties: a high luminous transmittance (Tlum = 67.3%) and high solar modulation efficiency (ΔTsol = 12.5%), as well as a low phase transition temperature of (Tc = 63.15 °C) which is lower than bulk (68 °C). In comparison, the M-phase VO2 nanorod film exhibits inferior luminous transmittance and solar modulation efficiency as well as a relatively high phase transition temperature. The excellent thermochromic properties of 3D mesoporous structure assembled by M-phase VO2 nanoflakes film compared with M-phase VO2 nanorods as well as previous reports is to attributed to 3D structure and mesoporosity. Besides, the 3D mesoporous structure assembled by monoclinic M-phase VO2 nanoflakes possesses a comparatively lower Tc and a narrower thermal hysteresis width compared with other monoclinic M-phase VO2 materials. Therefore, this green route opens the path for synthesis of 3D structure in VO2 and its application in smart windows.Conflicts of interest
There are no conflicts to declare.Acknowledgements
This work was supported by the 111 project (B18038) and the National Natural Science Foundation of China (Grant No. 51772229 and 51461135004). We also thank the Analytical and Testing Center of WUT for the help with carrying out XRD, TEM, and FESEM analyses.References
- J. Zhu, Y. Zhou, B. Wang, J. Zheng, S. Ji, H. Yao, H. Luo and P. Jin, ACS Appl. Mater. Interfaces, 2015, 7, 27796–27803 CrossRef CAS PubMed.
- M. Liu, B. Su, Y. V. Kaneti, Z. Chen, Y. Tang, Y. Yuan, Y. Gao, L. Jiang, X. Jiang and A. Yu, ACS Nano, 2016, 11, 407–415 CrossRef PubMed.
- D. Cao, C. Xu, W. Lu, C. Qin and S. Cheng, Sol. RRL, 2018, 2, 1870163 CrossRef.
- D. Ge, E. Lee, L. Yang, Y. Cho, M. Li, D. S. Gianola and S. Yang, Adv. Mater., 2015, 27, 2489–2495 CrossRef CAS PubMed.
- C. Sol, J. Schläfer, I. P. Parkin and I. Papakonstantinou, Sci. Rep., 2018, 8, 13249 CrossRef PubMed.
- Q. Hao, W. Li, H. Xu, J. Wang, Y. Yin, H. Wang, L. Ma, F. Ma, X. Jiang and O. G. Schmidt, Adv. Mater., 2018, 30, 1705421 CrossRef PubMed.
- Y. Ke, I. Balin, N. Wang, Q. Lu, A. I. Y. Tok, T. J. White, S. Magdassi, I. Abdulhalim and Y. Long, ACS Appl. Mater. Interfaces, 2016, 8, 33112–33120 CrossRef CAS PubMed.
- E. Strelcov, A. V. Davydov, U. Lanke, C. Watts and A. Kolmakov, ACS Nano, 2011, 5, 3373–3384 CrossRef CAS PubMed.
- A. Hendaoui, N. Émond, S. Dorval, M. Chaker and E. Haddad, Sol. Energy Mater. Sol. Cells, 2013, 117, 494–498 CrossRef CAS.
- S. Wang, K. A. Owusu, L. Mai, Y. Ke, Y. Zhou, P. Hu, S. Magdassi and Y. Long, Appl. Energy, 2018, 211, 200–217 CrossRef CAS.
- L. Zhong, M. Li, H. Wang, Y. Luo, J. Pan and G. Li, CrystEngComm, 2015, 17, 5614–5619 RSC.
- H. Kim, Y. Kim, K. S. Kim, H. Y. Jeong, A.-R. Jang, S. H. Han, D. H. Yoon, K. S. Suh, H. S. Shin and T. Kim, ACS Nano, 2013, 7, 5769–5776 CrossRef CAS PubMed.
- S. Wang, M. Liu, L. Kong, Y. Long, X. Jiang and A. Yu, Prog. Mater. Sci., 2016, 81, 1–54 CrossRef CAS.
- Y. Ke, C. Zhou, Y. Zhou, S. Wang, S. H. Chan and Y. Long, Adv. Funct. Mater., 2018, 28, 1800113 CrossRef.
- J. Zhu, A. Huang, H. Ma, Y. Chen, S. Zhang, S. Ji, S. Bao and P. Jin, New J. Chem., 2017, 41, 830–835 RSC.
- Y. Gao, H. Luo, Z. Zhang, L. Kang, Z. Chen, J. Du, M. Kanehira and C. Cao, Nano Energy, 2012, 1, 221–246 CrossRef CAS.
- M. E. Warwick and R. Binions, J. Mater. Chem. A, 2014, 2, 3275–3292 RSC.
- C. Yin, R. Zhang, G. Qian, Q. Fu, C. Li, M. Wang, C. Zhu, L. Wang, S. Yuan and X. Zhao, Appl. Phys. Lett., 2017, 110, 172404 CrossRef.
- Z. Song, L. Zhang, F. Xia, N. A. Webster, J. Song, B. Liu, H. Luo and Y. Gao, Inorg. Chem. Front., 2016, 3, 1035–1042 RSC.
- N. Shen, S. Chen, Z. Chen, X. Liu, C. Cao, B. Dong, H. Luo, J. Liu and Y. Gao, J. Mater. Chem. A, 2014, 2, 15087–15093 RSC.
- M. Li, F. Kong, Y. Zhang and G. Li, CrystEngComm, 2011, 13, 2204–2207 RSC.
- H. Zhang, X. Xiao, X. Lu, G. Chai, Y. Sun, Y. Zhan and G. Xu, J. Alloys Compd., 2015, 636, 106–112 CrossRef CAS.
- M. Kamalisarvestani, R. Saidur, S. Mekhilef and F. Javadi, Renewable Sustainable Energy Rev., 2013, 26, 353–364 CrossRef CAS.
- Y. Chen, X. Zeng, J. Zhu, R. Li, H. Yao, X. Cao, S. Ji and P. Jin, ACS Appl. Mater. Interfaces, 2017, 9, 27784–27791 CrossRef CAS PubMed.
- Y. Zhang, Y. Huang, J. Zhang, W. Wu, F. Niu, Y. Zhong, X. Liu, X. Liu and C. Huang, Mater. Res. Bull., 2012, 47, 1978–1986 CrossRef CAS.
- Z. Chen, Y. Gao, L. Kang, C. Cao, S. Chen and H. Luo, J. Mater. Chem. A, 2014, 2, 2718–2727 RSC.
- L. Kang, Y. Gao, H. Luo, Z. Chen, J. Du and Z. Zhang, ACS Appl. Mater. Interfaces, 2011, 3, 135–138 CrossRef CAS PubMed.
- D. Guo, C. Ling, C. Wang, D. Wang, J. Li, Z. Zhao, Z. Wang, Y. Zhao, J. Zhang and H. Jin, ACS Appl. Mater. Interfaces, 2018, 10, 28627–28634 CrossRef CAS PubMed.
- X. Cao, N. Wang, J. Y. Law, S. C. J. Loo, S. Magdassi and Y. Long, Langmuir, 2014, 30, 1710–1715 CrossRef CAS PubMed.
- J. Zhang, J. Wang, C. Yang, H. Jia, X. Cui, S. Zhao and Y. Xu, Sol. Energy Mater. Sol. Cells, 2017, 162, 134–141 CrossRef CAS.
- F. Xu, X. Cao, H. Luo and P. Jin, J. Mater. Chem. C, 2018, 6, 1903–1919 RSC.
- S. Wu, S. Tian, B. Liu, H. Tao, X. Zhao, R. Palgrave, G. Sankar and I. Parkin, Sol. Energy Mater. Sol. Cells, 2018, 176, 427–434 CrossRef CAS.
- D. Guo, Z. Zhao, J. Li, J. Zhang, R. Zhang, Z. Wang, P. Chen, Y. Zhao, Z. Chen and H. Jin, Cryst. Growth Des., 2017, 17, 5838–5844 CrossRef CAS.
- Y. Ke, X. Wen, D. Zhao, R. Che, Q. Xiong and Y. Long, ACS Nano, 2017, 11, 7542–7551 CrossRef CAS PubMed.
- X. Qian, N. Wang, Y. Li, J. Zhang, Z. Xu and Y. Long, Langmuir, 2014, 30, 10766–10771 CrossRef CAS PubMed.
- T. Chang, X. Cao, L. R. Dedon, S. Long, A. Huang, Z. Shao, N. Li, H. Luo and P. Jin, Nano Energy, 2018, 44, 256–264 CrossRef CAS.
- J. Zhang, H. Tian, L. Hao, X. Jin, C. Yang, J. Wang, X. Cui, C. Wang, C. Zhang and C. Zhang, J. Mater. Chem. C, 2016, 4, 5281–5288 RSC.
- K. Laaksonen, S.-Y. Li, S. Puisto, N. Rostedt, T. Ala-Nissila, C.-G. Granqvist, R. Nieminen and G. A. Niklasson, Sol. Energy Mater. Sol. Cells, 2014, 130, 132–137 CrossRef CAS.
- A. Taylor, I. Parkin, N. Noor, C. Tummeltshammer, M. S. Brown and I. Papakonstantinou, Opt. Express, 2013, 21, A750–A764 CrossRef PubMed.
- Q. Lu, C. Liu, N. Wang, S. Magdassi, D. Mandler and Y. Long, J. Mater. Chem. C, 2016, 4, 8385–8391 RSC.
- R. Purbia, R. Borah and S. Paria, Inorg. Chem., 2017, 56, 10107–10116 CrossRef CAS PubMed.
- J. Huang, N. Matsunaga, K. Shimanoe, N. Yamazoe and T. Kunitake, Chem. Mater., 2005, 17, 3513–3518 CrossRef CAS.
- S. Liang, Q. Shi, H. Zhu, B. Peng and W. Huang, ACS Omega, 2016, 1, 1139–1148 CrossRef CAS PubMed.
- G. Silversmit, D. Depla, H. Poelman, G. B. Marin and R. De Gryse, J. Electron Spectrosc. Relat. Phenom., 2004, 135, 167–175 CrossRef CAS.
- M. Wan, B. Liu, S. Wang, L. Hu, Y. He, H. Tao and X. Zhao, J. Alloys Compd., 2017, 706, 289–296 CrossRef CAS.
- M. Chen, Y. Zhang, Y. Liu, Q. Wang, J. Zheng and C. Meng, ACS Appl. Energy Mater., 2018, 1, 5527–5538 CAS.
- J. Li, X. Liu, W. Zhan, Y. Guo, Y. Guo and G. Lu, Catal. Sci. Technol., 2016, 6, 897–907 RSC.
- Y. Zhang, X. Liu and J. Huang, ACS Appl. Mater. Interfaces, 2011, 3, 3272–3275 CrossRef CAS PubMed.
- J. V. D. Perez, E. T. Nadres, H. N. Nguyen, M. L. P. Dalida and D. F. Rodrigues, RSC Adv., 2017, 7, 18480–18490 RSC.
- S. R. Popuri, A. Artemenko, C. Labrugere, M. Miclau, A. Villesuzanne and M. Pollet, J. Solid State Chem., 2014, 213, 79–86 CrossRef.
- M. Wang, Z. Cui, Y. Xue and R. Zhang, Cryst. Growth Des., 2018, 18, 4220–4225 CrossRef CAS.
- M. Li, X. Wu, L. Li, Y. Wang, D. Li, J. Pan, S. Li, L. Sun and G. Li, J. Mater. Chem. A, 2014, 2, 4520–4523 RSC.
- E. U. Donev, R. Lopez, L. C. Feldman and R. F. Haglund Jr, Nano Lett., 2009, 9, 702–706 CrossRef CAS PubMed.
- Y. Liu, H. Tao, X. Chu, M. Wan, J. Bao and X. Zhao, J. Non. Cryst. Solids, 2014, 383, 116–120 CrossRef CAS.
- Z. Liang, L. Zhao, W. Meng, C. Zhong, S. Wei, B. Dong, Z. Xu, L. Wan and S. Wang, J. Alloys Compd., 2017, 694, 124–131 CrossRef CAS.
- V. Martínez-Landeros, N. Hernandez-Como, G. Gutierrez-Heredia, M. A. Quevedo-López and F. Aguirre-Tostado, Thin Solid Films, 2019, 682, 24–28 CrossRef.
- C. Batista, R. M. Ribeiro and V. Teixeira, Nanoscale Res. Lett., 2011, 6, 1–7 CrossRef PubMed.
- T. D. Manning, I. P. Parkin, C. Blackman and U. Qureshi, J. Mater. Chem., 2005, 15, 4560–4566 RSC.
Footnote |
| † Electronic supplementary information (ESI) available: Detail characterization reports of V2O5, and M-phase VO2 synthesised at 200 °C. See DOI: 10.1039/d1ra01558c |
| This journal is © The Royal Society of Chemistry 2021 |

