 Open Access Article
Self-assembled and pH-responsive polymeric nanomicelles impart effective delivery of paclitaxel to cancer cells†
Ashok Kumar Jangid‡
a,
Deep Pooja‡b,
Poonam Jaina,
Nitin Guptaa,
Shwathy Ramesan *c and
Hitesh Kulhari
 *a
*a
aSchool of Nano Sciences, Central University of Gujarat, Gandhinagar-382030, Gujarat, India. E-mail: hitesh.kuhari@cug.ac.in
bCentre for Advanced Materials and Industrial Chemistry, School of Science, RMIT University, 124 La Trobe Street, 3000, Melbourne, Australia
cSchool of Engineering, RMIT University, Melbourne, Victoria 3001, Australia. E-mail: rameshshwathy@gmail.com
First published on 13th April 2021
Abstract
Chemotherapy is an essential component of breast cancer therapy, but it is associated with serious side effects. Herein, a pluronic F68-based pH-responsive, and self-assembled nanomicelle system was designed to improve the delivery of paclitaxel (PTX) to breast cancer cells. Two pH-responsive pluronic F68-PTX conjugates i.e. succinoyl-linked conjugate (F68-SA-PTX) and cis-aconityl-linked conjugate (F68-CAA-PTX) were designed to respond the varying pH-environment in tumour tissue. Although both the linkers showed pH-sensitivity, the F68-CAA-PTX exhibited superior pH-sensitivity over the F68-SA-PTX and achieved a more selective release of PTX from the self-assembled nanomicelles. The prepared nanomicelles were characterized by dynamic light scattering, transmittance electron microscopy, differential scanning calorimetry and powder X-ray diffraction techniques. The anticancer activity of prepared nanomicelles and pure PTX were evaluated by 2D cytotoxicity assay against breast cancer cell line MDA-MB-231 and in the real tumour environments i.e. 3D tumor spheroids of MDA-MB-231 cells. The highest cytotoxicity effect of PTX was observed with F68-CAA-PTX nanomicelles followed by F68-SA-PTX and free PTX. Further, the F68-CAA-PTX nanomicelles also induced significant apoptosis with a combination of increase in ROS generation, decrease in the depolarisation of MMP and G2/M cell cycle arrest. These observed results provide a new insight for breast cancer treatment using pluronic nanomicelles.
1. Introduction
Pluronics are water-soluble and nonionic amphiphilic block-copolymers composed of hydrophilic polyethylene oxide (PEO) and hydrophobic polypropylene oxide (PPO) units. Depending on the number of PPO and PEO units, and molecular weight, a wide range of pluronics are available in the market.1 The presence of PEO and PPO units provide an interesting structural behaviour of spontaneous formation of the self-assembled nanostructures in the water above its critical micelles concentration (CMC). In pharmaceutical research, pluronics are widely used for their broad range of applications like as a nanoparticle synthesizing agent, surfactant for suspensions, emulsifier, solubility enhancer for poor water-soluble drugs etc. In the past few years, several advanced pharmaceutical formulations have been designed using pluronics. Self-assembled pluronic nanomicelles (SPNMs) are regarded as the most advanced and promising method for developing a dynamic drug delivery system for hydrophobic drugs.2,3 The conventional drug-loaded SPNMs also have the issues of high CMC value, burst drug release, instability in the body fluids and inefficient drug-loading capabilities.4,5 This uncontrolled drug release results in severe side effects, reduced amount of drug at site of action and increase in tumor resistance.6–8 Therefore, the sustained and site-specific drug release at the solid tumor from the pluronic micelles is a key point of such delivery system.The pH-sensitive prodrug delivery systems equipped with an acid triggered bond have been widely used for designing selective and smart carriers.9 The pH-sensitive drug delivery systems are based on polymer, inorganic and hybrid materials.10 These systems are mainly synthesized by covalent bond formation between drug and biomaterial.11–13 Such type of systems can prevent the premature drug release under the physiological conditions and release the drug in solid tumor microenvironment.14
In this study, we have designed pluronic-drug conjugate based nanomicelles for the delivery of an anticancer drug paclitaxel (PTX). Herein, we conjugated pluronic F68 to PTX through pH-sensitive linker (succinoyl and cis-aconityl) with two major objectives. First, to control the release (pH-dependent) of PTX from the nanomicelles. The development of a pH-triggered delivery system is particularly relevant to the anticancer nanomedicines because tumor-tissues have slightly acidic environment in comparison to normal/healthy tissues.15–17 The pH-sensitive release of drug provides the advantage of a higher release of drug in the tumor tissue while less release of the drug in the blood and healthy tissues, thus causes less toxicity or side effects.18,19 Secondly, to improve the delivery and efficacy of conjugated PTX against human cancer cells. PTX is a highly effective antineoplastic and anticancer molecule, obtained as ‘plant alkaloid’.20–22 Clinically, the PTX is used to treat various cancers by the stopping the cancer cell growth in mammary,23,24 cervical,25 ovarian,26 lungs,27 bladders,28,29 prostate,24 melanoma,29 gastric,30 glioma31 and esophageal cancer cells. The physical encapsulation of PTX into nanomicelles does not provide the control over drug release and a high drug loading capacity.32 Therefore, being a hydrophobic molecule, PTX was conjugated to pluronic F68 which is a hydrophilic, biocompatible, and biodegradable surfactant. Moreover, pluronic F68 is a p-glycoprotein inhibitor and therefore, decreases the efflux of the drug delivered into the cancer cells. Although PTX is highly effective against a wide-range of cancer cells, low water solubility and lack of specificity remain as two major challenges in its clinical applications.33
2. Materials and methods
2.1 Materials
Pluronic F68 (F68) was received as a gift sample from BASF (New Jersey, USA). Paclitaxel (PTX), 4-dimethylaminopyridine (DMAP), cis-aconitic anhydride (CAA), 1-ethyl-3-(3-dimethylaminopropyl) carbodiimide (EDC), hydroxybenzotriazole (HOBt), Fetal Bovine Serum (FBS), glutamine, penicillin, DNAse-free RNAse A and streptomycin were purchased from Sigma Aldrich (St. Louis, MO, USA). Succinic anhydride (SA), triethylamine, diethyl ether and dichloromethane were purchased from Rankem (Mumbai, India).2.2 Synthesis of pluronic F68 and paclitaxel (F68-PTX) conjugate
Succinoyl pluronic F68 (F68-SA) and cis-aconityl pluronic F68 (F68-CAA) were synthesized according to our previously reported method.34 For the synthesis of F68-PTX conjugate, succinoyl pluronic F68 (1.0 eq.) or cis-aconityl pluronic F68 (1.0 eq.), EDC (1.0 eq.) and HOBt (1.0 eq.) were dissolved in anhydrous dichloromethane (DCM). The reaction was maintained at room temperature (RT) for 12 h under N2 environment. After the activation of the carboxylic group, PTX (1.0 eq.) and DMAP were added dropwise to the above solution. The reaction was maintained at RT for 24 h under N2 environment. After completion of the reaction, the mixture was transferred to a separating funnel and added an equal amount of brine solution (0.9% NaCl) to remove unconjugated PTX and DMAP. The DCM layer was separated and dried using anhydrous Na2SO4. Further, the DCM was evaporated by the rotary evaporation, vacuum dried the product and used for further studies.342.3 Characterizations of F68-PTX conjugate
2.4 Critical micelle concentration of F68-PTX conjugate
The critical micelle concentration (CMC) of F68-PTX conjugates was determined using pyrene fluorescence method.35,36 The aqueous solutions of different concentrations of F68-PTX conjugates (50 to 600 μg mL−1) were equilibrated with a fixed pyrene concentration 6 × 10⁻⁷ M and maintained at RT for 3 h. The fluorescence intensities were measured at 383 and 373 nm after excitation at 339 nm. The wavelength intensities ratio I383/I373 was plotted against log concentrations of F68-PTX (μg mL−1) to determine the CMC.2.5 Preparation of paclitaxel prodrug nanomicelles
NMs were prepared by the solvent evaporation method.37 Briefly, F68-PTX conjugates (10 mg mL−1) were dissolved in acetone (organic phase). The organic phase was dropwise poured into 5 mL of Milli-Q water under continuously stirring. The mixture was maintained at RT and stirred at 1000 rpm for 3 h to evaporate organic phase. After that, the prepared formulations termed as a NM-1 (F68-SA-PTX conjugate nanomicelles) and NM-2 (F68-CAA-PTX conjugate nanomicelles).2.6 Drug content measurement
The amount of PTX in NM-1 and NM-2 was measured by HPLC method as reported previously.27 The percentage drug loading (% DL) in F68-PTX conjugates was calculated by the following formula:WPTX: weight of PTX in NM-1 or NM-2 and WF68-PTX: total weight of F68-PTX conjugate.
2.7 Characterization of nanomicelles
2.8 In vitro PTX release study
In vitro drug release study was performed in three different media as reported previously.34 Briefly, prepared NM-1 or NM-2 was transferred into a dialysis bag (MWCO 1000 Da) and then the sample containing dialysis bag was placed in 100 mL of release media (PBS pH-7.4, pH-6.5 and SAB pH-5.0). At predetermined time intervals, 2 mL of media was withdrawn and analyzed for drug content using HPLC analysis as reported previously.272.9 Stability study of nanomicelles
To investigate the pH-triggered stability of NM-1 and NM-2, samples were placed in different pH conditions: sodium acetate buffer (SAB, pH 5.0), phosphate buffer saline (PBS, pH 7.4), and water (pH 7.0). The change in particle size of the samples were measured by the DLS method.2.10 In vitro hemolysis assay
The in vitro hemolysis assay of the NM-1 and NM-2 was evaluated according to previously reported study with some modification.38,39 Briefly, fresh human blood was collected in vacutainer containing anticoagulating agent and centrifuge at 4000 rpm for 10 min to separate plasma and haematocrit (RBC). The RBCs were collected and washed thricely with normal saline. The washed RBCs were resuspended in normal saline to make 2% RBC suspension. The prepared NM-1 and NM-2 were incubated with 2% RBC suspensions with varying concentrations 5, 10, 20, 40 and 80 μg mL−1 for 1 h at 37 °C in dark. For the control experiment, MilliQ water and PBS were taken as a positive control (100% hemolysis) and negative control (0% hemolysis) respectively. After 1 h, samples were centrifuged at 4000 rpm for 10 min, supernatant was collected, and absorbance (A) was measured at 540 nm using a Microplate Reader (Synergy H1 Hybrid Reader, Biotek). The % hemolysis of NM-1 and NM-2 was calculated as follows:2.11 Cell culture
MDA-MB-231, epithelial human breast cancer cells were purchased from American Type Culture Collection (ATCC, Manassas, VA) and was maintained in Roswell Park Memorial Institute RPMI 1640 medium (Invitrogen, NY). The medium was supplemented with 10% Fetal Bovine Serum (FBS), glutamine (2 nmol L−1), penicillin (100 ng mL−1) and streptomycin (100 ng mL−1) at a constant temperature of 37 °C and 5% CO2. The cells were constantly maintained at 70% confluency and the medium was replaced on alternative days. Once confluent, the cells were passaged and seeded in new plates every 2–3 days. The cells were trypsinized using 0.05% trypsin–EDTA and cells proliferating between 3-10 passages were used for experiments. Mycoplasma test was also carried out at regular intervals to ensure no cross-contamination occurs during and prior to experiments. The cell morphology and the health were monitored at regular intervals under the microscope.2.12 2D cell viability assay
The cytotoxic effect of the pure PTX, NM-1 and NM-2 were analyzed using the MTT assay. The assay was performed both on treated and untreated MDA-MB-231 cells. About 4 × 10⁴ cells per mL were seeded in 96 well flat-bottom plates and left to adhere for 24 h before the addition of the PTX formulations. The cells were left with the formulations for 72 h followed by the addition of 5 mg mL−1 of MTT reagent per well. The MTT solution was further incubated for 4 h at 37 °C before solubilizing the formazan crystals formed in DMSO. Formazan crystals are formed exclusively in live cells which form a purple-colored solution directly proportional to the number of live cells. The absorbance of the obtained solution was measured at 570 nm using a Microplate Reader (Spectramax Paradigm). The IC50 values were calculated using the Probit software.2.13 3D spheroid assay
MDA-MB-231 cells were seeded in Corning® Costar®Ultra-Low attachment 96 well plate at a seeding density of 5 × 10⁴ cells per mL and left to form a spheroid for 72 h. Once the cells formed the spheroid structures in the well plates, the formulations (pure PTX, NM-1 and NM-2) were added at IC50 concentrations and were left undisturbed for another 72 h before assessing the cell viability. The cell viability was determined by the addition of calcein-AM and propidium iodide (PI) to stain the live and dead cells respectively. Images were obtained both in green (calcein-AM) and red (PI) channels to ensure a merged image containing the live and dead cells was recorded. Images were taken using the ZOE™ Fluorescent Cell Imager (Bio-Rad Laboratories Inc., Hercules, CA, USA). In addition to the qualitative measurements obtained above, quantitative measurements were also carried out by the CellTiter-Glo® assay to obtain the luminescent readings of live cells. The number of live cells in a well is directly proportional to the ATP activity displayed by the live cells and hence luminescent readings were obtained with the help of CellTiter-Glo® reagent. The cells were seeded in Corning 96-well black, spheroid microplates and left to form spheroids for 3 days. The formulations were added and further incubated for 72 h similar to the 2D live/dead assay. 100 μL of CellTiter-Glo® reagent was added to each well containing 100 μL of PTX formulations in complete medium. The plates were shaken for 2 min on a shaker to induce cell lysis and further allowed to incubate for 10 min at RT before recording the luminescence of the samples.2.14 Cell cycle analysis
MDA-MB-231 cells (8 × 10⁴ cells per well) were seeded in 12 well plates and left undisturbed for 12 h for cell adhesion to the well plates. The cells were washed with 150 mM PBS and the PTX formulations (Pure PTX, NM-1 and NM-2) at IC50 concentration were added to each well. The cells treated with DMSO served as the controls. The cells including the floating cells present in the supernatant were collected 48 h post-treatment and were washed with sterile PBS. The final pellet of cells obtained was resuspended in 1 mL of PBS with the subsequent addition of 9 mL of 70% ethanol while vortexing at high speed. The obtained cell suspension was stored at 4 °C for 30 min before the removal of ethanol by centrifugation. The pellet was further loosened by gentle tapping in the presence of 5 mL of fresh sterile PBS to the pellets. The tubes were left undisturbed for 15 min to allow sufficient rehydration. Once rehydrated, the samples were spin down at 1000 rpm for 5 min before incubating the samples for 15 minutes in 1 mL of propidium iodide staining buffer (PI (200 mg), 0.1% (v/v) Triton X-100 and 2 mg DNAse-free RNAse A (Sigma) in 10 mL of PBS). The obtained samples were analyzed using a BDC6 Accuri flow cytometer for PI fluorescence by observing the intensity in the FL-2 channel.2.15 Hoechst staining
Staining for cells for the nuclei with dyes such as DAPI and Hoechst 33342 reveal the DNA fragmentation caused by the formulations in apoptotic/necrotic cells. For the study of the effect of apoptosis and DNA fragmentation caused by the PTX formulations synthesized, cells were seeded in a 24 well tissue culture plates at a seeding density of 2 × 10⁴ cells per well. The cells were incubated with the formulations at IC50 values for 48 h. The cells were further washed with PBS and were fixed with 4% paraformaldehyde. Hoechst 33242 (2 μg mL−1) was added to the fixed cells for a period of 15 min at RT to selectively stain the nucleus of the cells. The stained cells were washed with 150 mM PBS to remove excess, unbound dye prior to imaging under fluorescence microscopy (filters, excitation 350 nm and emissions 460 nm) to detect apoptotic cells by observing the intensity of the blue-colored nuclei. Apoptotic and fragmented DNA looked more intense in contrast to the cells with a spherical shaped outline.2.16 Measurement of mitochondrial membrane potential (MMP)
MDA-MB-231 cells were seeded in a 24 well plate at a seed in density of 2 × 10⁴ cells per well and allowed to adhere for 12 h prior to the addition of the PTX formulations at IC50 concentrations. After 48 h treatment, cells were washed with 150 mM PBS and 1 μg mL−1 JC-1 dye of 0.5 mL JC-1 solution was added to each well containing treated cells. The wells were incubated in dark for 20 min at 37 °C. The structural influence of the PTX formulations on the mitochondrial membrane was inferred from its potential state by examining the relative fluorescence between its green monomeric (depolarised) form at through excitation at 514 nm to that of its red aggregated (hyperpolarised) form through excitation at 529 nm. All the images were acquired using a microscope (ZOE™ Fluorescent Cell Imager, Bio-Rad Laboratories Inc., Hercules, CA, USA).2.17 Measurement of reactive oxygen species (ROS) levels
Measurement of reactive oxygen species (ROS) is highly essential to understand the mechanism by which the synthesized formulations induce apoptosis in the cells. The measurement was carried out by the addition of DCFDA containing media to the treated cells. The cells were seeded in a 24 well plate at 2 × 10⁴ cells per well cell density, treated for 48 h before obtaining the ROS values for the treated cells. After the treatment, the media was replaced with culture media containing 10 μM carboxy-DCFDA for 30 min at RT. All the incubation was carried out in dark to protect the light-sensitive DCFDA compound. The cells were washed with PBS and fluorescence images were captured using a microscope (ZOE™ Fluorescent Cell Imager, Bio-Rad Laboratories Inc., Hercules, CA, USA) in the green channel.2.18 Apoptosis studies by annexin V-PI staining
The apoptotic stage of the cells undergoing apoptosis due to the addition of the PTX, NM-1 and NM-2 was analyzed using the annexin V/propidium iodide apoptosis detection kit. MDA-MB-231 cells were seeded at 8 × 10⁴ cells per well in a 12 well plate and left for 12 h for good cell attachment. The cells were treated with the synthesized compounds at IC50 concentrations for 48 h and were further washed with sterile PBS. The washed cells were detached using trypsin and resuspended in annexin binding buffer containing 5 μL annexin-V/fluorescein isothiocyanate (FITC) and 10 μL PI. Each sample was incubated in dark for 15 min at RT before being analyzed for red (FL-2) and green channels (FL-1) using a BD Accuri™ C6 flow cytometer (BD Biosciences, San Jose, CA, USA).2.19 Statistical analysis
All the experiments were performed in triplicate and all the data were represent in ±standard deviation (SD). The value of p < 0.05 was considered significantly different.3. Results and discussion
3.1 Synthesis and characterization of succinoyl and cis-aconityl pluronic-F68
The F68-SA-PTX and F68-CAA-PTX were synthesized by following procedure described in Fig. S1.† Firstly, pluronic-F68 was modified to succinoyl and cis-aconityl derivatives with succinic anhydride and cis-aconitic anhydride, respectively. Following this, the modified F68 was reacted with PTX in the presence of EDC and HOBt to synthesize F68-SA-PTX and F68-CAA-PTX conjugates. The formation of modified succinoyl F68 and cis-aconityl F68 were confirmed by the 1H-NMR and FTIR techniques.40 The 1H-NMR spectra of pure F68 peaks at δ 3.85–3.40 ppm (–CH2 in PEO), 2.94–2.92 ppm (–CH2 in PPO), 2.62–2.56 ppm (CH2CH(CH3)–O in PPO), and δ 1.58–1.01 ppm ((CH3)–O PPO).36 Succinoyl F68 showed peaks at δ 3.80–3.40 ppm (–CH2 in PEO), 3.07, 3.04, 3.03 ppm (–CH2 in PPO), 2.67–2.64 ppm (–CH2 of succinoyl group), 2.62–2.56 ppm (CH2CH (CH3)–O in PPO), 1.29–1.01 ppm ((CH3)–O PPO). The 1H-NMR peak at δ 2.67–2.64 ppm were confirmed the presence of succinoyl group in F68.40 Similarly, for cis-aconitinoyl F68, the peaks observed at δ 6.71 and 6.36 (alkene of cis-aconityl group) and 2.08 ppm (–CH2) were confirmed the successfully conversion of F68 to F68-CAA (Fig. S2†).41The pure PTX showed the 1H-NMR observed at δ 8.14, 8.13 ppm (–NH–), 7.75–7.01 ppm (–Ph ring), 6.27–6.21 ppm (–OAc), 5.80–5.78 ppm (–CH of methane), 5.68 ppm (–OH), 4.96–4.94 ppm (–OAc), 4.80–4.19 ppm (–CH of hexane ring), 3.80–3.79 ppm (–OH), 3.61–2.50 ppm (–CH of alkane ring), 2.39 ppm (–OH), 2.35–2.30 ppm (–OAc), 2.24 ppm (–CH3), 1.87 ppm (–OH), 1.68–1.14 ppm (––CH3)42,43 (Fig. S2†). The 1H NMR spectra of F68-SA-PTX conjugate (500 MHz, CDCl3) was analyzed as follows: δ 8.23–8.11 ppm (–NH– PTX), 7.80–7.42 ppm (–Ph ring of PTX), 6.71–6.29 ppm (–OAc of PTX), 5.96 ppm (–CH of methane of PTX), 5.67 ppm (–OH of PTX), 4.97 ppm (–OAc of PTX), 4.31–4.22 ppm (–CH of hexane ring of PTX), 3.79 ppm (–OH of PTX), 3.79–3.14 ppm (–CH of alkane ring of PTX and –CH2 of PPO of F68), 2.82 ppm (–CH2 of PEO of F68), 2.66–2.50 ppm (–CH2–CH–(CH3)–O– of PPO of F68), 2.37–2.30 ppm (–OAc of PTX), 2.24 ppm (–CH3 of PTX), and 1.28–1.01 ppm (CH3–O– of PPO of F68). Similarly, 1H NMR spectra of F68-CAA-PTX conjugate was analyzed as follows: δ 8.21–8.12 ppm (–NH– PTX), 7.93–7.28 ppm (–Ph ring of PTX), 6.87–6.21 ppm (–OAc of PTX), 5.97 ppm (–CH of methane of PTX), 5.66 ppm (–OH of PTX), 4.94–4.82 ppm (–OAc of PTX), 4.42–4.18 ppm (–CH of hexane ring of PTX), 3.79 ppm (–OH of PTX), 3.73–3.10 ppm (–CH of alkane ring of PTX and –CH2 of PPO of F68), 2.76 ppm (–CH2 of PEO of F68), 2.64–2.44 ppm (–CH2–CH–(CH3)–O– of PPO of F68), 2.37–2.30 ppm (–OAc of PTX), 2.28–2.21 ppm (–CH3 of PTX), and 1.28–0.88 ppm (CH3–O– of PPO of F68) (Fig. 1). The appearance of PTX peaks in F68-SA-PTX and F68-CAA-PTX conjugates demonstrated successfully synthesis of F68-PTX conjugates.42,43
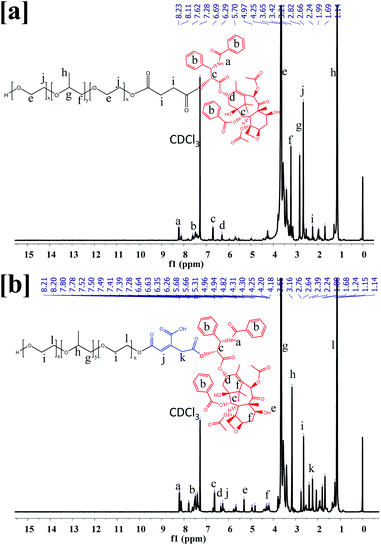 | ||
| Fig. 1 1H-NMR spectra of (a) pluronic F68 and PTX conjugate via succinoyl group (F68-SA-PTX), and (b) pluronic F68 and PTX conjugate via cis-aconityl group (F68-CAA-PTX). | ||
The synthesis of F68-SA-PTX and F68-CAA-PTX conjugates was further confirmed by the FTIR technique. Fig. S3† shows the FTIR spectra of F68-PTX conjugates via succinoyl and cis-aconityl groups. The pure F68 shows the FTIR peaks at 3503 cm−1 (O–H stretching), 2885 cm−1 (C–H stretching), 1970 and 1467 cm−1 (C–H bending), 1356 cm−1 (O–H bending), 1282 and 1112 cm−1 (C–O stretching), 951, 841 and 523 cm−1 (C–H bending). The succinoyl F68 shows the characteristic peaks at 2886 cm−1 (C–H stretching), 1737 cm−1 (C![[double bond, length as m-dash]](https://www.rsc.org/images/entities/char_e001.gif) O stretching) 1957 and 1467 cm−1 (C–H bending), 1355 cm−1 (O–H bending), 1284 and 1108 cm−1 (C–O stretching), 951, 842, and 527 cm−1 (C–H bending). The observed peak at 1737 cm−1 corresponding to C
O stretching) 1957 and 1467 cm−1 (C–H bending), 1355 cm−1 (O–H bending), 1284 and 1108 cm−1 (C–O stretching), 951, 842, and 527 cm−1 (C–H bending). The observed peak at 1737 cm−1 corresponding to C![[double bond, length as m-dash]](https://www.rsc.org/images/entities/char_e001.gif) O stretching of carboxylic group confirmed the successful formation of succinoyl F68.
O stretching of carboxylic group confirmed the successful formation of succinoyl F68.
Similarly, cis-aconityl F68 shows the peaks at 3579 cm−1 (O–H stretching), 2879 cm−1 (C–H stretching), 1972 cm−1 (C–H bending), 1721 cm−1 (C![[double bond, length as m-dash]](https://www.rsc.org/images/entities/char_e001.gif) O stretching) 1650 cm−1 (C
O stretching) 1650 cm−1 (C![[double bond, length as m-dash]](https://www.rsc.org/images/entities/char_e001.gif) C stretching), 1570 and 1469 cm−1 (C–H bending), 1349, 1278, 1248 and 1107 cm−1 (C–O stretching), 966, 835, 666 and 524 cm−1 (C–H bending). The observed peaks at 1721 and 1650 cm−1 C
C stretching), 1570 and 1469 cm−1 (C–H bending), 1349, 1278, 1248 and 1107 cm−1 (C–O stretching), 966, 835, 666 and 524 cm−1 (C–H bending). The observed peaks at 1721 and 1650 cm−1 C![[double bond, length as m-dash]](https://www.rsc.org/images/entities/char_e001.gif) O stretching and C
O stretching and C![[double bond, length as m-dash]](https://www.rsc.org/images/entities/char_e001.gif) C stretching respectively confirmed the successful formation of cis-aconityl F68.41 FTIR peaks of PTX were observed at 3674, 3509, 3406 and 3305 cm−1 (N–H and O–H stretching), 3063 and 2943 cm−1 (CH2 asymmetric and symmetric stretching), 1735 and 1709 cm−1 (C
C stretching respectively confirmed the successful formation of cis-aconityl F68.41 FTIR peaks of PTX were observed at 3674, 3509, 3406 and 3305 cm−1 (N–H and O–H stretching), 3063 and 2943 cm−1 (CH2 asymmetric and symmetric stretching), 1735 and 1709 cm−1 (C![[double bond, length as m-dash]](https://www.rsc.org/images/entities/char_e001.gif) O stretching), 1646 cm−1 (CONH stretching), 1579, 1542, 1514, 1482 and 1451 cm−1 (C
O stretching), 1646 cm−1 (CONH stretching), 1579, 1542, 1514, 1482 and 1451 cm−1 (C![[double bond, length as m-dash]](https://www.rsc.org/images/entities/char_e001.gif) C stretching), 1370 and 1381 cm−1 (CH3 bending), 1245 cm−1 (C–N stretching), 1175, 1072 and 1021 cm−1 (C–O stretching), and 984–898 cm−1 (C–O bending).44 In the FTIR spectrum of F68-SA-PTX and F68-CAA-PTX, the characteristics peaks of both PTX and F68 are present which confirm the conjugation of F68 and PTX. Thus, the FTIR peaks at 1715 cm−1 (C
C stretching), 1370 and 1381 cm−1 (CH3 bending), 1245 cm−1 (C–N stretching), 1175, 1072 and 1021 cm−1 (C–O stretching), and 984–898 cm−1 (C–O bending).44 In the FTIR spectrum of F68-SA-PTX and F68-CAA-PTX, the characteristics peaks of both PTX and F68 are present which confirm the conjugation of F68 and PTX. Thus, the FTIR peaks at 1715 cm−1 (C![[double bond, length as m-dash]](https://www.rsc.org/images/entities/char_e001.gif) O of succinoyl) in F68-SA-PTX, and at 1740 and 1723 cm−1 (C
O of succinoyl) in F68-SA-PTX, and at 1740 and 1723 cm−1 (C![[double bond, length as m-dash]](https://www.rsc.org/images/entities/char_e001.gif) O of cis-aconityl) in F68-CAA-PTX confirm the successful conjugation of F68 and PTX via succinoyl and cis-aconityl linkers, respectively.45
O of cis-aconityl) in F68-CAA-PTX confirm the successful conjugation of F68 and PTX via succinoyl and cis-aconityl linkers, respectively.45
3.2 Critical micelle concentration of F68-PTX conjugates
Critical micelle concentration (CMC) is investigated to determine the concentration for self-assembling and its dilution stability behavior of polymer/surfactant-based molecules.46–48 The CMC values of the F68-SA-PTX and F68-CAA-PTX conjugates were determined using a pyrene-based fluorescent method. The CMC value for F68-SA-PTX and F68-CAA-PTX conjugates was found to be 0.2 mg mL−1 (Fig. 2) which is about 20 times lower than the pure F68 CMC (212 μg mL−1). The observed low CMC values of conjugates suggested that both F68-SA-PTX and F68-CAA-PTX conjugates could be self-assembled into micelles at very low concentrations and hence may remain more stable during blood circulations in comparison to the micelles formed with pluronic F68 alone.49 Further, the stability of micelles in blood also help in restricting the burst release of drug before reaching to the site and thus in avoiding the side effects of the drug. Interestingly, both F68-SA-PTX and F68-CAA-PTX conjugates have same CMC values which indicates that the linkers present in the conjugates do not significantly affect the CMC of the conjugate.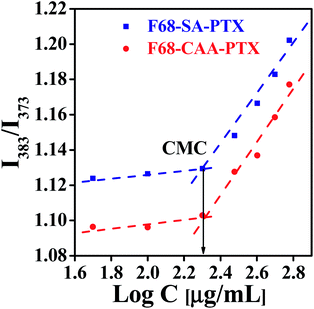 | ||
| Fig. 2 Critical micelle concentration (CMC) of pluronic F68 and PTX conjugate via succinoyl group (F68-SA-PTX) and pluronic F68 and PTX conjugate via cis-aconitinoyl group (F68-CAA-PTX). | ||
3.3 Characterizations of nanomicelles
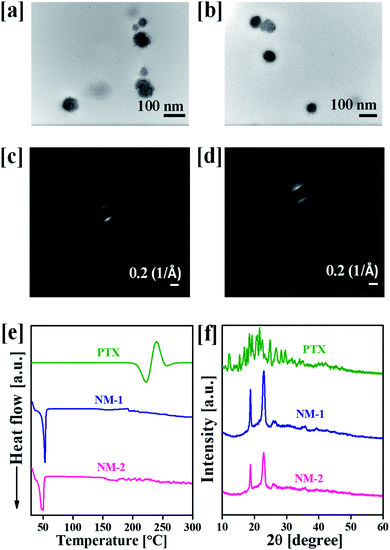
The particle size, PDI and zeta potential of NM-1 and NM-2 were measured by DLS method (Table 1). The size NM-1 and NM-2 were found to be 122.9 and 110.6 nm, respectively (Fig. S4†). The PDI values for NM-1 and NM-2 were 0.297 and 0.224, respectively. These results suggest the formation of monodisperse nanomicelles of both F68-SA-PTX and F68-CAA-PTX conjugates in water. The zeta potential of NM-1 and NM-2 were −2.3 and −5.2 mV, respectively. The PTX conjugated nanomicelles NM-1 and NM-2 showed the drug content of 7.94 ± 0.51 and 8.21 ± 0.47%, respectively. The core sizes of the nanomicelles were measured by TEM analysis and found to be ∼71 nm and ∼58 nm for NM-1 and NM-2, respectively (Fig. 3a and b). The size from TEM analysis observed smaller than the DLS measurements which could be due to difference in the dried state and hydrated state of the nanomicelles.47,50| System | NM-1 | NM-2 |
|---|---|---|
| PS (nm) | 122.9 ± 9.7 | 110.6 ± 3.4 |
| PDI | 0.297 ± 0.072 | 0.224 ± 0.054 |
| ZP (mV) | –2.31 ± 0.18 | –5.20 ± 0.27 |
| DL (%) | 7.94 ± 0.51 | 8.21 ± 0.47 |
Fig. 3c and d, illustrates the SAED patterns of the NM-1 and NM-2. The lack of diffraction spots in the images suggests the amorphous nature of the both the nanomicelles system. The physical state of pure PTX and nanomicelles was also determined by the DSC and powder XRD analysis. The DSC scan of pure PTX showed the characteristic peak at 221 °C corresponding to the melting point of PTX.51 However, this peak was not appeared in the scans of both the nanomicelles, instead they showed peaks at 53 and 50 °C for pluronic F68 (Fig. 3e).36 Thus, the observed results suggested the conjugated the PTX was present in amorphous form in the core of the nanomicelles. A similar behaviour was observed in powder XRD analysis. As shown in Fig. 3f, pure crystalline PTX showed sharp peaks at 2θ angle 6.2°, 8.7°, 9.9°, 11.0°, 12.1°, 15.3°, 16.8°, 17.6°, 18.5°, 19.1°, 20.8°, 21.6°, 22.4°, 24.7°, 26.6°, 28.3° and 29.6°.51 The PTX conjugated NM-1 and NM-2 showed the peaks at 18.6 and 22.8°, and 18.8 and 22.9° respectively. These observed peaks are due to the presence of pluronic F68 in the micelles.36 In the NM-1 and NM-2 XRD patterns, the characteristic pattern of crystalline PTX peaks were not observed which further confirmed the conversion of crystalline PTX into amorphous PTX during the conjugation and nanomicelles formation processes.
3.4 Effect of the media and pH on the release of PTX from nanomicelles
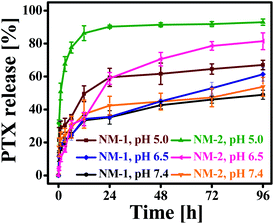
The in vitro release profiles of PTX from NM-1 and NM-2 are presented in Fig. 4. The release of PTX was studied in three different media having three different pH i.e. phosphate buffer saline with pH 7.4 (mimicking physiological/blood pH), phosphate buffer pH 6.5 (mimicking tumor microenvironment pH) and sodium acetate buffer pH 5.0 (mimicking endolysosomal pH). As observed from Fig. 4, both the nanomiclles showed pH-triggered faster release at acidic pH in comparison to neutral pH. After 96 h, about 67% and 93% of PTX was released from NM-1 and NM-2, respectively, at acidic pH 5.0 while at pH 7.4, the PTX was released about 48% and 53% from NM-1 and NM-2 for the same period of the time. The release of PTX was about 61.3 and 81.4% from NM-1 and NM-2, respectively at pH 6.5. Thus, even at slightly acidic pH of tumor microenvironment, the release was more than the physiological pH. The faster PTX relaese in acidic medium could be due to hydroplysis of ester bond in acidic medium.52 These observed release data clearly indicated the pH-sensitivity of the both the nanomicelles. Comparing the NM-1 versus NM-2, the PTX release was faster with NM-2 than NM-1, demostrating a faster hydrolysis of cis-aconityl bond than the succinoyl bond. It was also observed that both nanomicelles showed a sustained release of PTX over the period of 96 h. Thus a sustained and pH-triggered release of drug would help in the delivering of drug more to the tumor tissue while a very less amount of drug would be released in the blood.3.5 Effect of pH and media on the stability of nanomicelles
To evaluate the effect of pH and media on the colloidal stability of NM-1 and NM-2, the change in particle size of the NMs were determined after incubation at different physiological conditions i.e. SAB pH 5.0, PBS pH 7.4 and water pH 7.0 (Fig. 5).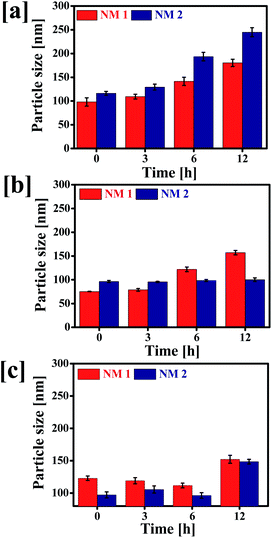 | ||
| Fig. 5 Stability of F68-SA-PTX conjugate nanomicelles (NM-1) and F68-CAA-PTX conjugate nanomicelles (NM-2) determined at 37 °C. Particle sizes of NM1 and NM2 in (a) SAB, (b) PBS and (c) water. | ||
The particle size of NM-1 was increased significantly in three media. But the particle size of NM-2 was not increased except in SAB. It suggests that NM-2 nanomicelles were more stable in comparison to NM-1. The increase in size of NM-2 in SAB could be attributed to rapid hydrolysis of cis-aconityl linkage and thus breakdown of micellar structure.53 Thus, cis-aconityl linked nanomicelles i.e. NM-2 are expected to have excellent colloidal stability during circulation in blood but degrade fast in the tumor cells environment and endolysolomal pH.54
3.6 In vitro hemolysis assay
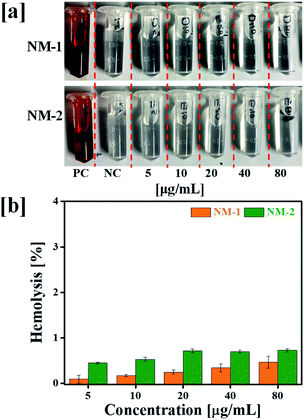
Hemolysis assay was used to evaluate the effect of prepared PTX conjugates nanomicelles on RBCs. The negative control (NC) and positive control (PC) produced negligible hemolysis and 100% hemolysis respectively. Hemolytic profile of NM-1 and NM-2 for different PTX concentration observed less then >1% of hemolysis (Fig. 6). Overall, the observed results suggested the that, prepared NM-1 and NM-2 are highly biocompatible in nature.3.7 In vitro cytotoxicity
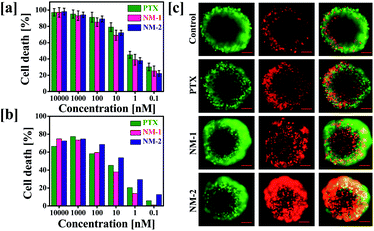
To determine the effect of conjugation and preparation of nanomicelles on the anticancer activity of PTX, in vitro cytotoxicity assay was performed against MDA-MB-231 human breast cancer cells. The cells were incubated with pure PTX or NM-1 or NM-2, equivalent to 0.1 to 10![[thin space (1/6-em)]](https://www.rsc.org/images/entities/char_2009.gif) 000 nM concentration of PTX for 72 h. Fig. 7a shows the concentration dependent effects of the formulations on the cancer cells. Assessment of half-maximal inhibitory concentration (IC50) is crucial in identifying the comparative effectiveness of the formulations synthesized to function as effective anti-cancer system.55–57 In this study, it was observed that the IC50 for all the three PTX formulations was in the range of 0.8–1 nM, indicating the similar efficacy of the PTX nanomicelles to the free PTX. The observed cytotoxicities of the designed nanomicelles were comparatively higher than that reported with the marketed nanoformulations of PTX i. e. Abraxane (67.9 μg mL−1) and nab-PTX (0.91 μg mL−1) against MDA-MB-231 human breast cancer cells.58,59
000 nM concentration of PTX for 72 h. Fig. 7a shows the concentration dependent effects of the formulations on the cancer cells. Assessment of half-maximal inhibitory concentration (IC50) is crucial in identifying the comparative effectiveness of the formulations synthesized to function as effective anti-cancer system.55–57 In this study, it was observed that the IC50 for all the three PTX formulations was in the range of 0.8–1 nM, indicating the similar efficacy of the PTX nanomicelles to the free PTX. The observed cytotoxicities of the designed nanomicelles were comparatively higher than that reported with the marketed nanoformulations of PTX i. e. Abraxane (67.9 μg mL−1) and nab-PTX (0.91 μg mL−1) against MDA-MB-231 human breast cancer cells.58,59
3.8 Effect on 3D multicellular spheroids
The 2D data obtained was further verified in the 3D spheroids system. This was carried out due to the close resemblance of the three-dimensional spheroid system with that of the tumor microenvironment, thus mimicking the cytotoxicity and activity of the anti-cancer reagents in the real tumour environments.60,61 The IC50 of the PTX formulations were assessed by their addition on the cells for 72 h and the cells were further stained using the live/dead staining kit which selectively stained the live and dead cells in green and red colours, respectively. In contrast to the data obtained in the 2D assay, the live dead staining showed prominent cell death in the cells treated with NM-2 while NM-1 and pure PTX treated cells displayed significantly less cell death (Fig. 7b and c).3.9 Cell cycle analysis
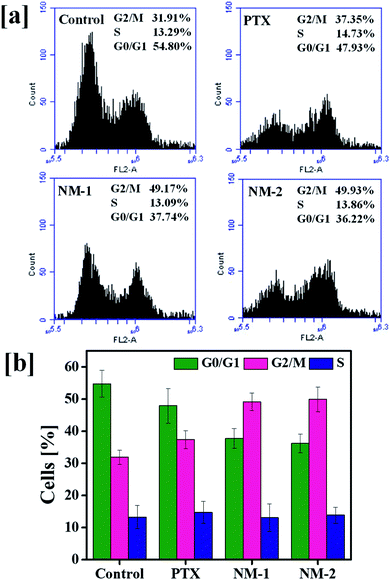
Analysis of the cell cycle phase is a reliable indicator of cancer progression and the ability of the cancer cells to transition through different phases in order to proliferate. The arrest of the cells in a particular phase elicits the mechanism behind the anti-cancer activity of the synthesized molecules in cancer cells.62,63 The findings of the action of PTX based formulations are shown in Fig. 8. A markedly clear increase in the percentage of cells undergoing G2/M arrest is seen with the addition of pure PTX, NM-1 and NM-2 as compared to that of controls. The control cells showed about 31.91% of cells in the G2/M phase whilst NM-2 displayed the highest percentage of cells about 49.93%. There is also a simultaneous decrease in the G0/G1 phase of cells incubated with PTX formulations. In cells incubated with NM-2, the percentage of cells in G0/G1 phase decreased from 54.80% to 36.22% with respect to control cells, showing a clear relationship between the G2/M phase arrest and decreasing cell viabilities, thereby proving NM-2 to be an effective anti-cancer formulation of PTX.3.10 Nuclear morphological changes
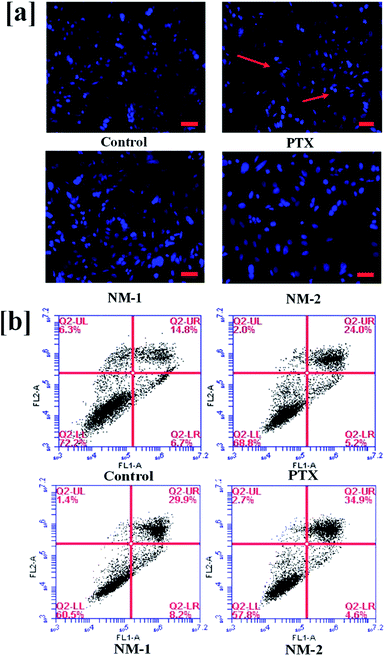
To observe the DNA fragmentation and other morphological changes associated with the nucleus of the MDA-MB-231 human breast cancer cells in the presence of the prepared PTX formulations, nucleus staining dye Hoechst 33342 was added to the cells.64 Definitive apoptotic characteristics such as cell shrinkage, bright condensed nuclear shape changes, and other morphological changes were observed under a microscope 48 h post-treatment with pure PTX, NM-1 and NM-2. As seen clearly in Fig. 9a the cells treated with pure PTX, NM-1 and NM-2 show a considerable number of bright nucleus indicating an increase in the number of apoptotic cells as compared to that of the controls.3.11 Flow cytometric analysis of induction of apoptosis by PTX nanomicelles
Induction of apoptosis is a mechanism of PTX to cause cell deaths to the cancer cells. Annexin FITC/PI staining of cells has routinely been used in the identification and differentiation of early apoptotic cells from late/necrotic cells. This will help in the verification of the nuclear staining data, thus confirming the percentage of cells undergoing apoptosis. The cells positively stained for Annexin V-FITC are majorly early apoptotic cells whilst the cells stained for both PI and Annexin V-FITC are considered either as necrotic or late apoptotic cells. The only PI stained cells refer to the dead cells.65,66 The flow cytometry results as seen in Fig. 9b show the highest percentage of total apoptotic cells (39.5%) for NM-2 as compared to NM-1 (38.1%) and PTX (29.2%). The apoptotic cells were the lowest for the untreated control samples (21.5%). It should also be noted that the early apoptotic cells in the lower right second quadrant is highest for NM-1 while the late apoptotic cells in upper right quadrant is highest in the NM-2 proving both NM-1 and NM-2 having approximately equal efficiencies in killing the cancer cells with a difference in the early and late apoptotic cells.3.12 ROS induction analysis
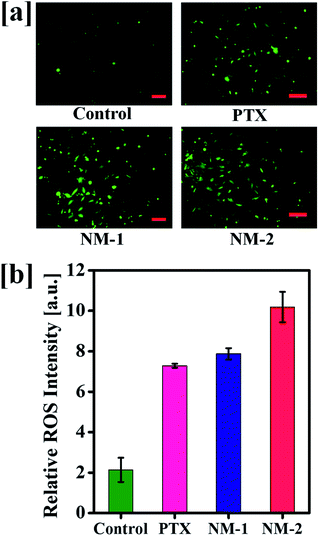
Elevated levels of reactive oxygen species (ROS) are seen in most of the cancer cells and the existing chemotherapies including PTX elevate the levels of ROS. An increase in the ROS levels in the mitochondria results in increased oxidative stress damaging the mitochondrial membrane potential.This damages further leads to the induction of apoptosis thereby killing a significant proportion of cells. The produced ROS were analyzed with the help of carboxy-2,7-dichlorofluorescein diacetate (carboxy-DCFDA) dye, a specific compound which upon cleavage by intracellular esterases oxidizes to highly fluorescent carboxy-2,7 dichlorofluorescein (carboxy-DCF) from a non-fluorescent compound.67 As seen in Fig. 10a, NM-2 shows a significantly higher level of ROS as compared to PTX and NM-1 displaying intense green fluorescence. The ROS levels in cells treated with compounds PTX and NM-1 are comparable while the ROS levels are the lowest in the control cells. The quantitative analysis of the produced ROS intensity is also depicted graphically in Fig. 10b showing a five-fold increase in the ROS levels in cells treated with NM-2 as compared to that of the untreated cells, thus proving the efficiency of the synthesized formulations to effectively kill cancer cells.
3.13 Measurement of mitochondrial membrane potential (MMP)
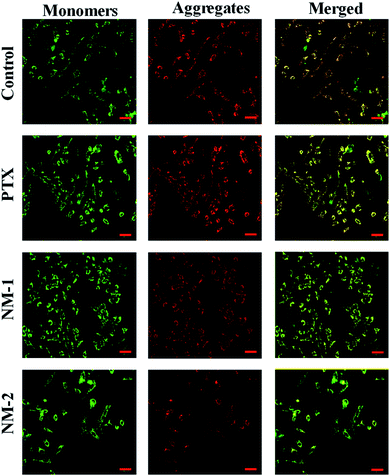
Mitochondrial membrane damage can be assessed by staining the cells with JC-1 compound that selectively stains the mitochondria and differentiates between polarised and depolarised regions in the mitochondria.66 For the cells to remain healthy, information regarding the polarised to the depolarised state marked by the ration between them, which in turn is indicated by the ratio between the red to green is essential in assessing the degree of apoptosis when it occurs in cells. This replacement of red fluorescence (polarised state) by green JC-1 monomers (depolarised state) is a result of mitochondrial membrane damage and collapse. This damage initiated by the addition of the synthesized compounds is evident in Fig. 11 by the presence of bright green fluoresce for NM-2 with the intensities of the green fluorescence reducing in the order of compound NM-2 > NM-1 > PTX. It is also evident that the untreated control samples show an optimum balance between the polarised to the depolarised mitochondrial membrane with significant regions displaying orange fluorescence thus reconfirming the absence of apoptosis in untreated samples while showing significant apoptosis in cells treated with NM-2.4. Conclusions
In this study, pH-sensitive and self-assembled nanomicelles of paclitaxel were designed using a biocompatible polymeric surfactant pluronic F68. PTX was conjugated to the pluronic F68 using two pH-sensitive linkers i.e. succinic anhydride and cis-acotinic anhydride. The drug-surfactant conjugate-based micelles of PTX displayed a monodispersed, nanoscale ranged stable formulations. The in vitro PTX release pattern showed that the designed micelles could maintained the stability during circulation and PTX could be released in acidic environment of cancer cells. Comparing the two nanomicelles systems, cis-aconityl based nanomicelles showed better control over the release of drug, more stability, and higher cytotoxicity to the 3D spheroids of human breast cancer cells. As demonstrated by the cell cycle analysis, there was no significant change in the mechanism of cell death (G2/M cell cycle arrest) after conjugation of PTX with the pluronic F68. However, the PTX present as nanomicelles showed increase in induction of nuclear fragmentation, apoptosis, and ROS generation to the human breast cancer cells than free PTX. Finally, the designed pH-sensitive biocompatible delivery system could be a new strategy for improving the efficacy of anticancer nanomedicines.Author contributions
Ashok Kumar Jangid: conceptualization, methodology, writing – original draft, software. Deep Pooja: writing – review & editing, visualization. Poonam Jain: data curation, software. Nitin Gupta: formal analysis. Shwathy Ramesan: methodology, writing – original draft. Hitesh Kulhari: conceptualization, writing – review & editing, supervision.Conflicts of interest
The authors declare no conflict of interest.Acknowledgements
Authors thank the Central University of Gujarat, Gandhinagar for providing necessary facilities and support. HK acknowledges the Department of Science and Technology (DST), New Delhi for an INSPIRE Faculty Award. AKJ, PJ and NG acknowledge the University Grant Commission (UGC), New Delhi for PhD fellowships. The authors also thank the MicroNano Research Facility (MNRF), RMIT University, Melbourne for access to the PC2 lab for the biological assays.References
- A. M. Bodratti and P. Alexandridis, J. Funct. Biomater., 2018, 9, 11 CrossRef PubMed.
- P. Kumari, S. V. K. Rompicharla, H. Bhatt, B. Ghosh and S. Biswas, Nanomedicine, 2019, 14, 819–834 CrossRef CAS PubMed.
- X. Li, M. Wang, C. Liu, X. Jing and Y. Huang, J. Appl. Polym. Sci., 2013, 130, 4598–4607 CAS.
- Y. Wang, D. Wang, Q. Fu, D. Liu, K. Racette, Z. He and F. Liu, Mol. Pharmaceutics, 2014, 11(10), 3766–3771 CrossRef CAS.
- D.-W. Hong, T.-H. Liu and I.-M. Chu, J. Appl. Polym. Sci., 2011, 122, 898–907 CrossRef CAS.
- Y. Liu, S. Fu, L. Lin, Y. Cao, X. Xie, H. Yu, M. Chen and H. Li, Int. J. Nanomed., 2017, 12, 2635–2644 CrossRef CAS PubMed.
- Q. Gao, Q. Liang, F. Yu, J. Xu, Q. Zhao and B. Sun, Colloids Surf., B, 2011, 88, 741–748 CrossRef CAS PubMed.
- Z. Sezgin, N. Yüksel and T. Baykara, Eur. J. Pharm. Biopharm., 2006, 64, 261–268 CrossRef CAS PubMed.
- K. Xiao, Q. Liu, N. Suby, W. Xiao, R. Agrawal, M. Vu, H. Zhang, Y. Luo, Y. Li and K. S. Lam, Adv. Healthcare Mater., 2021, 10, 2001196 CrossRef CAS.
- R. Miraftab and H. Xiao, J. Bioresour. Bioprod., 2019, 4, 200–201 CAS.
- S. Xiong, Z. Wang, J. Liu, X. Deng, R. Xiong, X. Cao, Z. Xie, X. Lei, Y. Chen and G. Tang, Colloids Surf., B, 2019, 173, 346–355 CrossRef CAS PubMed.
- Z. Cao, W. Li, R. Liu, X. Li, H. Li, L. Liu, Y. Chen, C. Lv and Y. Liu, Biomed. Pharmacother., 2019, 118, 109340 CrossRef CAS.
- H. Wang, Y. Wang, Y. Chen, Q. Jin and J. Ji, Polym. Chem., 2014, 5, 854–861 RSC.
- X. Zhang, T. Zhang, X. Ma, Y. Wang, Y. Lu, D. Jia, X. Huang, J. Chen, Z. Xu and F. Wen, Asian J. Pharm. Sci., 2020, 15, 605–616 CrossRef PubMed.
- S. Abbasi, G. Yousefi and A.-M. Tamaddon, Colloids Surf., A, 2018, 537, 217–226 CrossRef CAS.
- L. Zhang, J. Xu, Q. Wen and C. Ni, J. Appl. Polym. Sci., 2019, 136, 47921 CrossRef.
- K. Zhang, J. Liu, X. Ma, L. Lei, Y. Li, H. Yang and Z. Lei, J. Appl. Polym. Sci., 2018, 135, 46714 CrossRef.
- J. Yang, L. Yun, G. Zhao, F. Zhang, Y. Chen and C. Wang, Colloids Surf., A, 2018, 539, 101–108 CrossRef CAS.
- S. Abbasi, G. Yousefi, O. Firuzi and S. Mohammadi-Samani, J. Appl. Polym. Sci., 2015, 133, 43233 Search PubMed.
- F. Li, H. Zhang, M. He, J. Liao, N. Chen, Y. Li, S. Zhou, M. Palmisano, A. Yu, M. P. Pai, H. Yuan and D. Sun, Mol. Pharm., 2018, 15, 4505–4516 CrossRef CAS PubMed.
- Z. Xu, S. Wang, Y. Li, M. Wang, P. Shi and X. Huang, ACS Appl. Mater. Interfaces, 2014, 6(19), 17268–17276 CrossRef CAS PubMed.
- R. Ganugula, M. Deng, M. Arora, H. L. Pan and M. N. V. R. Kumar, ACS Chem. Neurosci., 2019, 10, 1801–1812 CrossRef CAS PubMed.
- C. Colombo, L. Morosi, E. Bello, S. A. Licandro, M. Lupi, P. Ubezio, M. Morbidelli, M. Zucchetti, M. D. Incalci, D. Moscatelli and R. Frapolli, Mol. Pharmaceutics, 2016, 13(1), 40–46 CrossRef CAS PubMed.
- A. O. Boztas, O. Karakuzu, G. Galante, Z. Ugur, F. Kocabas, C. Z. Altuntas and A. O. Yazaydin, Mol. Pharm., 2013, 10, 2676–2683 CrossRef CAS PubMed.
- Z. Xie, Y. Wei, J. Xu, J. Lei and J. Yu, J. Agric. Food Chem., 2019, 67, 5159–5168 CrossRef CAS PubMed.
- X. Cui, Y. Sun, M. Shen, K. Song, X. Yin, W. Di and Y. Duan, ACS Appl. Mater. Interfaces, 2018, 10, 7821–7831 CrossRef CAS PubMed.
- D. Pooja, H. Kulhari, M. Kuncha, S. S. Rachamalla, D. J. Adams, V. Bansal and R. Sistla, Mol. Pharm., 2016, 13, 3903–3912 CrossRef CAS.
- Y. Liu, R. Wang, J. Hou, B. Sun, B. Zhu, Z. Qiao, Y. Su and X. Zhu, ACS Appl. Bio Mater., 2018, 1, 1992–2001 CrossRef CAS.
- K. Kanai, E. Kikuchi, S. Mikami, E. Suzuki, Y. Uchida, K. Kodaira, A. Miyajima, T. Ohigashi, J. Nakashima and M. Oya, Cancer Sci., 2010, 101, 216–223 CrossRef CAS PubMed.
- X. Li, X. Lu, H. Xu, Z. Zhu, H. Yin, X. Qian, R. Li, X. Jiang and B. Liu, Mol. Pharm., 2012, 9(2), 222–229 CrossRef CAS PubMed.
- H. Han, Y. Zhang, S. Jin, P. Chen, S. Liu, Z. Xie, X. Jing and Z. Wang, New J. Chem., 2020, 44, 5692–5701 RSC.
- Y. Jiang, X. Wang, X. Liu, W. Lv, H. Zhang, M. Zhang, X. Li, H. Xin and Q. Xu, ACS Appl. Mater. Interfaces, 2017, 9, 211–217 CrossRef CAS PubMed.
- S. K. Jain, P. Utreja, A. K. Tiwary, M. Mahajan, N. Kumar and P. Roy, Curr. Drug Saf., 2014, 9, 145–155 CrossRef CAS PubMed.
- A. K. Jangid, D. Pooja, P. Jain, S. V. K. Rompicharla, S. Ramesan and H. Kulhari, Mater. Adv., 2020, 1, 738–748 RSC.
- A. K. Jangid, K. Patel, P. Jain, S. Patel, N. Gupta, D. Pooja and H. Kulhari, Carbohydr. Polym., 2020, 247, 116730 CrossRef CAS PubMed.
- A. K. Jangid, H. Agraval, N. Gupta, U. C. S. Yadav, R. Sistla, D. Pooja and H. Kulhari, Colloids Surf., B, 2019, 175, 202–211 CrossRef CAS PubMed.
- H. Kulhari, D. Pooja, S. Shrivastava, N. V.G.M. and R. Sistla, Colloids Surf., B, 2014, 117, 166–173 CrossRef CAS PubMed.
- D. Pooja, H. Kulhari, M. K. Singh, S. Mukherjee, S. S. Rachamalla and R. Sistla, Colloids Surf., B, 2014, 121, 461–468 CrossRef CAS PubMed.
- P. Jain, S. Bhagat, L. Tunki, A. K. Jangid, S. Singh, D. Pooja and H. Kulhari, ACS Appl. Mater. Interfaces, 2020, 12(9), 10170–10182 CrossRef PubMed.
- Y. Cai, Z. Sun, X. Fang, X. Fang, F. Xiao, Y. Wang and M. Chen, Drug Delivery, 2016, 23, 2587–2595 CrossRef CAS PubMed.
- X.-B. Fang, J.-M. Zhang, X. Xie, D. Liu, C.-W. He, J.-B. Wan and M.-W. Chen, Int. J. Pharm., 2016, 502, 28–37 CrossRef CAS.
- T. Yin, Q. Wu, L. Wang, L. Yin, J. Zhou and M. Huo, Mol. Pharmaceutics, 2015, 12(8), 3020–3031 CrossRef CAS PubMed.
- X. Han, J. Chen, M. Jiang, N. Zhang, K. Na, C. Luo, R. Zhang, M. Sun, G. Lin, R. Zhang, Y. Ma, D. Liu and Y. Wang, ACS Appl. Mater. Interfaces, 2016, 8, 33506–33513 CrossRef CAS PubMed.
- H. Hou, D. Zhang, J. Lin, Y. Zhang, C. Li, Z. Wang, J. Ren, M. Yao, K. H. Wong and Y. Wang, J. Agric. Food Chem., 2018, 66, 11812–11822 CrossRef CAS PubMed.
- T. Luo, J. Magnusson, V. Préat, R. Frédérick, C. Alexander, C. Bosquillon and R. Vanbever, Pharm. Res., 2016, 33, 1671–1681 CrossRef CAS PubMed.
- N. Kumar and A. Mandal, J. Mol. Liq., 2018, 266, 147–159 CrossRef CAS.
- X. Zhang, N. Liang, X. Gong, Y. Kawashima, F. Cui and S. Sun, Colloids Surf., B, 2019, 177, 11–18 CrossRef CAS PubMed.
- R. Yang, S. Zhang, D. Kong, X. Gao, Y. Zhao and Z. Wang, Pharm. Res., 2012, 29, 3512–3525 CrossRef CAS PubMed.
- Y. Song, Q. Tian, Z. Huang, D. Fan, Z. She, X. Liu, X. Cheng, B. Yu and Y. Deng, Int. J. Nanomed., 2014, 9, 2307–2317 Search PubMed.
- A. Ibrahim, E. Twizeyimana, N. Lu, W. Ke, J. Felix Mukerabigwi, F. Mohammed, A. Al-Wali Mohammed, M. Japir and Z. Ge, ACS Appl. Bio Mater., 2019, 2, 5099–5109 CrossRef CAS.
- D. Pooja, H. Kulhari, M. Kuncha, S. S. Rachamalla, D. J. Adams, V. Bansal and R. Sistla, Mol. Pharm., 2016, 13, 3903–3912 CrossRef CAS PubMed.
- Y. S. Lee, H. J. Kim, D. H. Yang and H. J. Chun, J. Ind. Eng. Chem., 2019, 71, 369–377 CrossRef CAS.
- B. Ma, W. Zhuang, G. Liu and Y. Wang, Regener. Biomater., 2018, 5, 15–24 CrossRef CAS PubMed.
- H. Kulhari, D. P. Kulhari, M. K. Singh and R. Sistla, Colloids Surf., A, 2014, 443, 459–466 CrossRef CAS.
- T. Sarkar, R. J. Butcher, S. Banerjee, S. Mukherjee and A. Hussain, Inorg. Chim. Acta, 2016, 439, 8–17 CrossRef CAS.
- G. W. Caldwell, Z. Yan, W. Long and J. A. Masucci, Curr. Top. Med. Chem., 2012, 12, 1282–1290 CrossRef CAS PubMed.
- S. Ramesan, A. R. Rezk, K. W. Cheng, P. P. Y. Chan and L. Y. Yeo, Lab Chip, 2016, 16, 2820–2828 RSC.
- H. B. Ruttala, T. Ramasamy, B. S. Shin, H.-G. Choi, C. S. Yong and J. O. Kim, Int. J. Pharm., 2017, 519, 11–21 CrossRef CAS PubMed.
- E. Bernabeu, G. Helguera, M. J. Legaspi, L. Gonzalez, C. Hocht, C. Taira and D. A. Chiappetta, Colloids Surf., B, 2014, 113, 43–50 CrossRef CAS PubMed.
- H. Kulhari, D. Pooja, R. Kota, T. S. Reddy, R. F. Tabor, R. Shukla, D. J. Adams, R. Sistla and V. Bansal, Mol. Pharm., 2016, 13, 1491–1500 CrossRef CAS PubMed.
- V. G. Reddy, T. S. Reddy, C. Jadala, M. S. Reddy, F. Sultana, R. Akunuri, S. K. Bhargava, D. Wlodkowic, P. Srihari and A. Kamal, Eur. J. Med. Chem., 2019, 182, 111609 CrossRef PubMed.
- P. B. Mullan, J. E. Quinn, P. M. Gilmore, S. McWilliams, H. Andrews, C. Gervin, N. McCabe, S. McKenna, P. White, Y.-H. Song, S. Maheswaran, E. Liu, D. A. Haber, P. G. Johnston and D. P. Harkin, Oncogene, 2001, 20, 6123–6131 CrossRef CAS PubMed.
- Z. A. Stewart, M. D. Westfall and J. A. Pietenpol, Trends Pharmacol. Sci., 2003, 24, 139–145 CrossRef CAS.
- T. J. S. Macedo, V. R. P. Barros, A. P. O. Monte, B. B. Gouveia, M. E. S. Bezerra, A. Y. P. Cavalcante, R. S. Barberino, V. G. Menezes and M. H. T. Matos, Zygote, 2017, 25, 434–442 CrossRef CAS PubMed.
- Q. Zhang, J. Liu, S. Chen, J. Liu, L. Liu, G. Liu, F. Wang, W. Jiang, C. Zhang, S. Wang and X. Yuan, Apoptosis, 2016, 21, 432–442 CrossRef CAS.
- S. Ramesan, A. R. Rezk, C. Dekiwadia, C. Cortez-Jugo and L. Y. Yeo, Nanoscale, 2018, 10, 13165–13178 RSC.
- D. Figueroa, M. Asaduzzaman and F. Young, J. Pharmacol. Toxicol. Methods, 2018, 94, 26–33 CrossRef CAS PubMed.
Footnotes |
| † Electronic supplementary information (ESI) available. See DOI: 10.1039/d1ra01574e |
| ‡ Authors contributed equally. |
| This journal is © The Royal Society of Chemistry 2021 |


