 Open Access Article
A nanostructured SnO2/Ni/CNT composite as an anode for Li ion batteries†
Anuradha A. Ambalkara,
Ujjwala V. Kawadea,
Yogesh A. Sethia,
Sandip C. Kanadeb,
Milind V. Kulkarnia,
Parag V. Adhyapak *a and
Bharat B. Kale
 *a
*a
aCentre for Materials for Electronics Technology (C-MET), Ministry of Electronics and Information Technology (MeitY), Panchavati, Pune 411008, India. E-mail: bbkale@cmet.gov.in; adhyapak@cmet.gov.in
bIndian Institute of Science Education and Research, Dr Homi Bhabha Rd, Pune, 411008, India
First published on 1st June 2021
Abstract
A SnO2/Ni/CNT nanocomposite was synthesized using a simple one-step hydrothermal method followed by calcination. A structural study via XRD shows that the tetragonal rutile structure of SnO2 is maintained. Further, X-ray photoelectron spectroscopy (XPS) and Raman studies confirm the existence of SnO2 along with CNTs and Ni nanoparticles. The electrochemical performance was investigated via cyclic voltammetry (CV), electrochemical impedance spectroscopy (EIS), and galvanostatic charge–discharge measurements. The nanocomposite has been used as an anode material for lithium-ion batteries. The SnO2/Ni/CNT nanocomposite exhibited an initial discharge capacity of 5312 mA h g−1 and a corresponding charge capacity of 2267 mA h g−1 during the first cycle at 50 mA g−1. Pristine SnO2 showed a discharge/charge capacity of 1445/636 mA h g−1 during the first cycle at 50 mA g−1. This clearly shows the effects of the optimum concentrations of CNTs and Ni. Further, the nanocomposite (SnNiCn) shows a discharge capacity as high as 919 mA h g−1 after 210 cycles at a current density of 400 mA g−1 in a Li-ion battery set-up. Thus, the obtained capacity from the nanocomposite is much higher compared to pristine SnO2. The higher capacity in the nanoheterostructure is due to the well-dispersed nanosized Ni-decorated stabilized SnO2 along with the CNTs, avoiding pulverization as a result of the volumetric change of the nanoparticles being minimized. The material accommodates huge volume expansion and avoids the agglomeration of nanoparticles during the lithiation and delithiation processes. The Ni nanoparticles can successfully inhibit Sn coarsening during cycling, resulting in the enhancement of stability during reversible conversion reactions. They ultimately enhance the capacity, giving stability to the nanocomposite and improving performance. Additionally, the material exhibits a lower Warburg coefficient and higher Li ion diffusion coefficient, which in turn accelerate the interfacial charge transfer process; this is also responsible for the enhanced stable electrochemical performance. A detailed mechanism is expressed and elaborated on to provide a better understanding of the enhanced electrochemical performance.
Introduction
The growing interest in electric vehicles has shifted research towards the development of lithium-ion batteries (LIB).1 Preliminary areas of battery research include materials engineering for the preparation of cathodes, anodes, and electrolytes. Usually, graphite or lithium titanate (LTO) is used as an anode, lithium cobalt oxide (LCO) or lithium ferrous phosphate (LFP) is used as a cathode, and LiPF6 is used as an electrolyte in commercial LIBs.2 Nevertheless, to increase the efficiency and cyclability, and to reduce the charging time of batteries, these battery components (i.e., the anode, cathode, and electrolyte) are currently being tailored with respect to their material compositions via the exploration of substitute materials.3The present era is dominated by semiconducting metal oxides, which have vast applications, e.g., in photocatalysts, gas sensors, optoelectronics, energy storage devices, etc.4,5 Metal oxides such as SnO2, Fe2O3, Co3O4, and MnO2 are the most commonly used anode materials for LIBs.6,7 Among these, SnO2 nanomaterials show a comparatively higher theoretical specific capacity (1494 mA h g−1).8 This theoretical capacity of SnO2 is four times higher than that of current commercially used anode materials, e.g., graphite (372 mA h g−1) and other potential metal oxide anodes.9,10 The higher theoretical specific capacity of SnO2 is due to an electrochemical reaction occurring in the cell in two steps: (i) a conversion reaction and (ii) an alloying reaction, as represented in eqn (1) and (2), respectively:6,11
| Sn2 + 4Li+ + 4e− → Sn + 2Li2O | (1) |
| Sn + xLi+ + xe− → LixSn (0 ≤ x ≤ 4.4) | (2) |
These two reactions contribute to the overall specific capacity of SnO2, with individual specific capacities of 711 and 783 mA h g−1, respectively. Although SnO2 seems to be a promising anode material for use in LIBs, during charging/discharging it shows some drawbacks such as (i) poor electrical conductivity, (ii) volume expansion (∼350%), (iii) pulverization, (iv) the agglomeration of tin nanocrystals, and (v) low coulombic efficiency in the first cycle.12,13 To overcome these drawbacks, researchers have tried to modify SnO2 via synthesizing SnO2 with a variety of morphologies, such as nanoparticles; hollow nanostructures; tube-like, rod-like, and wire-like morphologies; etc.14,15 Efforts have also been made to prepare nanocomposites of SnO2 with carbonaceous materials, transition metals, or other metal oxides as buffering matrices.11,16 It is reported that the addition of a carbonaceous buffering matrix (e.g., carbon nanotubes (CNTs), graphene, carbon nanofibers (CNFs), etc.) can enhance the electronic conductivity of SnO2 and the mechanical strength, also cushioning massive volume changes.10,14,17,18 Similar observations were recorded in our earlier publication, which reported that upon the addition of carbon, stability in terms of the capacity is observed, where carbon accommodated the strain of volume change and increased the conductivity of pristine SnO2.19 However, the mere addition of carbonaceous materials to SnO2 does not overcome all the issues. As the addition of carbon only helps in addressing the volume expansion, the problem of the initial coulombic efficiency loss still persists. Therefore, to improve the reversibility of conversion reactions, there is a need for further modifications. The doping of SnO2 with transition metals (TMs) is also found to be helpful due to their high conductivities.20 The 3d transition metals (Cu, Ni, Co, and Mn) can enable highly reversible conversion reactions when added to SnO2 nanomaterials.16,21,22 The added TM can be useful for inducing oxygen vacancies in SnO2 in the lithiated electrode, resulting in an increased coulombic efficiency of more than 83%. Previous results have demonstrated the advantage of incorporating transition metals into SnO2 to overcome reversibility problems.11
As per the literature, there are many reports on composites of SnO2 with carbon and/or transition metals/oxides for battery applications. For example, Liang et al. demonstrated a hydrothermally synthesized Ni-doped SnO2 nanosphere based anode material with an initial reversible capacity of 1267 mA h g−1 at a charge–discharge rate of 0.2C and a stable reversible capacity of 674.8 mA h g−1 after 35 cycles.11 Kim et al. reported a Ni-added SnO2–carbon nanofiber composite with capacity retention of 447.6 mA h g−1 after 100 cycles.10 Zhou et al. reported SnO2/CNT with a high reversible capacity of 596 mA h g−1 after 200 cycles for enhanced lithium storage applications.8 Zhang et al. reported the synthesis of a three-dimensional graphene/carbon nanotube/SnO2 hybrid architecture with an improved reversible capacity of 842 mA h g−1 after 100 cycles at 0.2 A g−1 for lithium storage.17 Tang et al. reported the synthesis of hierarchical CNF/SnO2/Ni nanostructures as an anode material, showing a capacity of 542.8 mA h g−1 at a current density of 200 mA g−1.23 Sun et al. have reported Sn–SnO2 hybrid nanoclusters embedded in carbon nanotubes with enhanced electrochemical performance, i.e., 1059 mA h g−1 at 1 A g−1 and 960 mA h g−1 at 5 A g−1 over 1000 cycles.24 Cui et al. reported Sb-doped SnO2/graphene–CNT based high-performance Li-ion and Na-ion battery anodes delivering rate capabilities of 659 mA h g−1 at 10 A g−1 with capacity retention of 73% after 1000 cycles at 1 A g−1 in the case of LIBs, and 74% of the capacity was retained after 500 cycles in the case of SIBs.25 Ma et al. studied a composite of carbon-nanotube-connected SnO2/reduced graphene clusters as a highly reversible anode material for lithium-/sodium-ion batteries; at a current density of 0.1 A g−1, SnO2/rGO/CNT shows initial discharge and charge capacities of 1678.6 and 1091.2 mA h g−1, respectively.26 Wang et al. designed a hybrid nanostructure of SnO2/Co3O4/rGO to act as an anode material for lithium ion batteries, exhibiting a capacity of 641 mA h g−1 at a high current density of 1000 mA g−1 after 900 cycles.27
In this report, we have effectively fabricated a chemically engineered SnO2/Ni/CNT anode using a simple hydrothermal method, and its performance was compared with pristine SnO2. The preparation method for the SnO2/Ni/CNT composite based anode material was also optimized in terms of the percentages of CNT and Ni in the composition with respect to the specific capacity. As per our knowledge and based on a literature survey, our nanocomposite anode electrode exhibits an impressive initial reversible capacity of 2329 mA h g−1 with a specific capacity of 1180 mA h g−1 even after 210 cycles at 400 mA g−1.
Experimental methods
Material preparation
All reagents were analytical-grade reagents and were used without further purification. In a typical synthesis method, 4 mmol of stannic chloride (SnCl4·5H2O, 99%, Fisher Scientific) was dissolved 20 mL of distilled water, and 28 mmol of sodium hydroxide (NaOH, 99% S.D. Fine) dissolved in 20 mL of distilled water was added, and the mixture was stirred for 20 min. The resulting white solution was then transferred to an 80 mL-capacity Teflon autoclave and kept at 180 °C for 12 h. This pristine SnO2 sample is named SnO. For the SnO2/Ni nanocomposite, the addition of nickel nitrate (Ni(NO3)3) is carried out. 4 wt% Ni was obtained via dissolving a suitable amount of nickel nitrate in a minimum amount of distilled water, and addition was done in situ to the SnO reaction solution. This sample is named SnNi. For SnO2/CNT, the addition of 1 wt% commercial CNTs (the activation of the CNTs was carried out before use) was done in situ to the SnO reaction solution. This sample is named SnCn. For the preparation of SnO2/Ni/CNT, 4 wt% Ni and 1 wt% activated CNTs were added in situ to the SnO reaction solution. This sample is named SnNiCn. Also, for comparison, we synthesized and analyzed samples of SnNi, SnCn, and SnNiCn with different wt% levels in their compositions, which are named SnNi-2% (2 wt% Ni), SnNi-6% (6 wt% Ni), SnCn-0.5% (0.5 wt% CNTs), SnCn-1% (1 wt% CNTs), SnNiCn-2% (2 wt% Ni and 1 wt% CNTs), and SnNiCn-6% (6 wt% Ni and 1 wt% CNTs). The as-prepared precipitate was separated via centrifugation, washed with distilled water several times, and finally washed with ethanol. The product was dried at 80 °C overnight. The dried products of SnNi, SnCn, and SnNiCn were annealed at 550 °C for 3 h under a nitrogen atmosphere at a rate of 5 °C min−1. Due to annealing, the Ni oxides get reduced to Ni, which is formed during hydrothermal treatment, and the carbonization of the CNTs occurs.8 These SnO, SnNi, SnCn, and SnNiCn samples are used for further analysis and comparisons hereafter.Structural and morphological characterization
The crystal structures of all the synthesized anode nanostructures were examined via powder X-ray diffraction techniques (XRD, Bruker Advanced D8) using a Cu Kα radiation source. Morphological and micro-structural analysis of all as-synthesized nanostructures was carried out via field-emission scanning electron microscopy (FESEM, Hitachi, S-4800) and field-emission transmission electron microscopy (FETEM, JEOL JEM-2200FS). The surface chemical compositions were studied via X-ray photoelectron spectroscopy (XPS, Thermo Fisher Scientific Co., Theta Probe). Room-temperature micro-Raman scattering analysis was performed using a HR 800-Raman spectrometer (Horiba Jobin Yvon), with excitation at 532 nm. Particle sizes were calculated using Particle Sizing Systems apparatus (Santa Barbara, Calif., USA).Electrochemical measurements
To perform electrochemical measurements, 2032-type coin cells were used. The active material, conducting carbon, and polyvinylidene fluoride (PVDF) binder were mixed at a weight ratio of 80![[thin space (1/6-em)]](https://www.rsc.org/images/entities/char_2009.gif) :
:![[thin space (1/6-em)]](https://www.rsc.org/images/entities/char_2009.gif) 10
10![[thin space (1/6-em)]](https://www.rsc.org/images/entities/char_2009.gif) :
:![[thin space (1/6-em)]](https://www.rsc.org/images/entities/char_2009.gif) 10 with N-methyl-2-pyrrolidone (NMP) as a solvent. The prepared slurry was cast onto a copper current collector with the help of a doctor blade and was dried in a vacuum oven for 12 h at 120 °C before being used as a working electrode. After drying under ambient conditions, round discs 16 mm in diameter were punched out and further dried under vacuum at 120 °C. The 2032-type coin half-cells were assembled in an argon-filled glove box, using metallic lithium foil (75 μm in thickness) as the counter and reference electrode, quartz filter paper as the separator, 1 M LiPF6 in ethylene carbonate (EC)
10 with N-methyl-2-pyrrolidone (NMP) as a solvent. The prepared slurry was cast onto a copper current collector with the help of a doctor blade and was dried in a vacuum oven for 12 h at 120 °C before being used as a working electrode. After drying under ambient conditions, round discs 16 mm in diameter were punched out and further dried under vacuum at 120 °C. The 2032-type coin half-cells were assembled in an argon-filled glove box, using metallic lithium foil (75 μm in thickness) as the counter and reference electrode, quartz filter paper as the separator, 1 M LiPF6 in ethylene carbonate (EC)![[thin space (1/6-em)]](https://www.rsc.org/images/entities/char_2009.gif) :
:![[thin space (1/6-em)]](https://www.rsc.org/images/entities/char_2009.gif) dimethyl carbonate (DMC) (1
dimethyl carbonate (DMC) (1![[thin space (1/6-em)]](https://www.rsc.org/images/entities/char_2009.gif) :
:![[thin space (1/6-em)]](https://www.rsc.org/images/entities/char_2009.gif) 1 in volume) (BASF) as the electrolyte, and the round discs as the working electrodes. Electrochemical measurements (galvanostatic charge–discharge tests) were carried out using a battery analyzer (MTI) (vs. Li/Li+) at room temperature. The cyclic voltammetry behaviour of the half cells was tested using a potentiostat/galvanostatic instrument (Metrohm Autolab) between 0.005 V and 3 V with a scan rate of 0.2 mV s−1. Electrochemical impedance spectroscopy measurements were performed at an amplitude of 5 mV with a frequency range of 0.1 Hz to 1 MHz.
1 in volume) (BASF) as the electrolyte, and the round discs as the working electrodes. Electrochemical measurements (galvanostatic charge–discharge tests) were carried out using a battery analyzer (MTI) (vs. Li/Li+) at room temperature. The cyclic voltammetry behaviour of the half cells was tested using a potentiostat/galvanostatic instrument (Metrohm Autolab) between 0.005 V and 3 V with a scan rate of 0.2 mV s−1. Electrochemical impedance spectroscopy measurements were performed at an amplitude of 5 mV with a frequency range of 0.1 Hz to 1 MHz.
Results and discussion
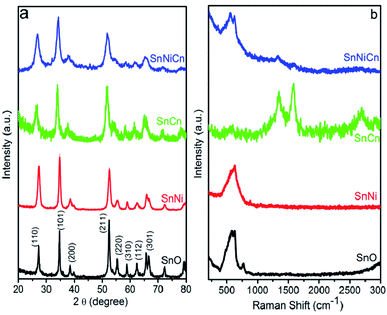
Fig. 1a displays the X-ray diffraction (XRD) patterns of pristine SnO2, SnO2/Ni, SnO2/CNT, SnO2/Ni/CNT nanocomposite samples. All samples show strong and sharp peaks at 2θ values of 26.7, 34.1, 37.96, 51.7, 54.6, 58.9, 62.23, and 65.5°, which correspond to the (110), (101), (200), (211), (220), (310), (112), and (301) lattice planes of SnO2 (JCPDS no. 072-1147) with a tetragonal rutile structure, and metallic Ni peaks (JCPDS no. 004-0850) are not obvious. No diffraction peaks from crystalline by-products, such as NiO, were detected. No other peaks are observed, indicating that Sn(OH)4 formed first, and the further dehydration of Sn(OH)4 generated SnO2 nanoparticles.After calcination at 550 °C for 3 h and upon the introduction of Ni and CNTs, the characteristic peaks become wider and shift toward lower 2θ values in the case of SnO2/Ni/CNT. This could be attributed to a decrease in the grain size and the insertion of smaller radius atoms, like Ni2+. Moreover, the peak shifts indicate that the as-prepared product is not a physical mixture but that the Ni species are incorporated into the lattice of SnO2. However, the only observed diffraction peaks belong to SnO2, as shown in Fig. 1a. This further confirms the formation of a single phase resulting from the successful doping of Ni into SnO2. The slight shifts toward lower 2θ values are believed to be related to a decrease in the length of the SnO2 crystal lattice, which is attributed to the lower ionic radius of Ni2+ (0.69 Å) compared with Sn4+ (0.83 Å). This further confirms that the Ni ions are incorporated into SnO2 (ref. 16) (XRD patterns of SnNi-2%, SnNi-6%, SnCn-0.5%, SnCn-1.5%, SnNiCn-2%, and SnNiCn-6% are given in the ESI (Fig. S1†)). To confirm the presence of Ni and CNTs in the nanocomposite samples, we carried out further analysis.
All samples were also characterized based on Raman spectra, obtained at an excitation laser wavelength of 532 nm, as illustrated in Fig. 1b. For the undoped SnO2 sample (pristine SnO2), typical modes positioned at A1g = 626 cm−1 and B2g = 774 cm−1 were detected, which indicate the expansion and contraction of the Sn–O bond.21 In the case of Ni-doped SnO2, the A1g peak shifted to 635 cm−1 and the B2g peak shifted to 884 cm−1 with a decrease in the peak intensity due to Ni2+ doping. The above phenomena provide powerful evidence of the incorporation of nickel into the SnO2 cassiterite lattice. Moreover, no Ni–O characteristic peak (at about 570 cm−1) was detected in the spectra of the Ni-doped samples.22 SnCn and SnNiCn showed characteristic D and G bands at around 1332 and 1581 cm−1, and 1322 and 1591 cm−1, respectively, which represent the carbon backbone. The peaks at around 575 cm−1 are attributed to the Raman modes of the tin oxide nanoparticles in SnCn, while the peaks at 555, 635, and 864 cm−1 in the case of SnNiCn, with shifts in the A1g and B2g mode peaks, are due to the doping of Ni2+ into the SnNiCn sample.28 The peak at 2686 cm−1 in SnCn was ascribed to the C–H bonds and long-range graphitic order, arising due to a second-order scattering process (a G′ or 2D band).29
Fig. 2 shows the morphologies of the as-synthesized samples. Fig. 2a–h highlights FESEM images of all synthesized samples, i.e., pristine SnO2, SnO2/Ni, SnO2/CNT, and SnO2/Ni/CNT, respectively. The morphology of pristine SnO2 (Fig. 2a and b) takes the form of bricks with a width of 60 nm, which are formed due to the stacking of nanoplates.
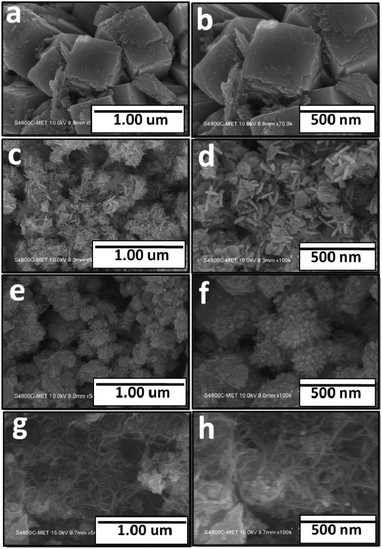 | ||
| Fig. 2 FESEM images of all the samples: (a and b) SnO; (c and d) SnNi; (e and f) SnCn; and (g and h) SnNiCn. | ||
Fig. 2c and d shows the SnO2/Ni nanocomposite, which shows nanorods (20–25 nm in width and 50 nm in length) of SnO2 decorated with Ni nanoparticles. However, the size of the Ni nanoparticles is too small to determine because of the limitations of FESEM. There was no change in the morphology and size upon increasing the Ni concentration (for SnNi-2 and 4%, see the ESI (Fig. S2†)). This indicates that there is control of the growth of SnO2 due to Ni and, hence, slightly different morphology is observed (from plates to nanorods). SnO2/CNT (Fig. 2e and f) shows clusters of nanoplates (50–80 nm) of SnO2. These nanoplate edges are seen vertically, and they look like rods. Further, SnO2/Ni/CNT (Fig. 2g and h) shows nanoplates of SnO2 embedded with CNTs and with Ni nanoparticles decorated on the same (for SnNi-2%, SnNi-6%, SnCn-0.5%, SnCn-1.5%, SnNiCn-2%, and SnNiCn-6%, see the ESI (Fig. S4†)). There is not much difference in the morphologies of samples with different percentages of Ni and CNTs.
Fig. 3 shows FETEM images of all the synthesized samples. Fig. 3a and b shows FETEM images of pristine SnO2, showing the elongated nanoplates of SnO2 (length: 150 nm). The inset of Fig. 3a shows the SAED pattern, which clearly reveals the crystalline tetragonal structure of SnO2. Fig. 3c shows the EDAX spectrum of SnO2, revealing the presence of Sn and O. Fig. 3d and e shows FETEM images of the SnO2/Ni nanocomposite, showing SnO2 nanorods having a length of 50 nm and a diameter of 10 nm, with Ni particles that are 5–7 nm in size. The inset of Fig. 3d shows the SAED pattern, which clearly reveals the crystalline tetragonal structure of SnO2 with Ni, which matches with the standard JCPDS data. Fig. 3f shows the EDAX spectrum of SnO2/Ni, revealing the presence of Sn, O, and Ni. Fig. 3g and h shows FETEM images of the SnO2/CNT nanocomposite, which shows a combination of nanotubes with a diameter of 10 nm and a length of 80–100 nm, and 100 nm plate-like SnO2. The inset of Fig. 3g shows the SAED pattern of SnO2/CNT. Fig. 3i shows the EDAX spectrum of SnO2/CNT, revealing the presence of Sn, O, and C. Fig. 3j and k shows FETEM images of the SnO2/CNT/Ni nanocomposite, with CNT tubes and SnO2 nanoplates (50 nm), and with tiny Ni particles (5 nm) deposited on the material. The corresponding SAED pattern is given in the inset of Fig. 3j, showing tetragonal SnO2. In addition, the EDAX spectrum (Fig. 3i) shows the presence of Sn, O, Ni, and C in the same sample. Moreover, the selected-area electron diffraction (SAED) patterns of the Ni-doped samples, i.e., SnNi and SnNiCn (Fig. 3d and k), show characteristic diffraction rings, which were assigned to the (101) and (200) crystal planes of tetragonal SnO2. This data is in good agreement with the XRD results.
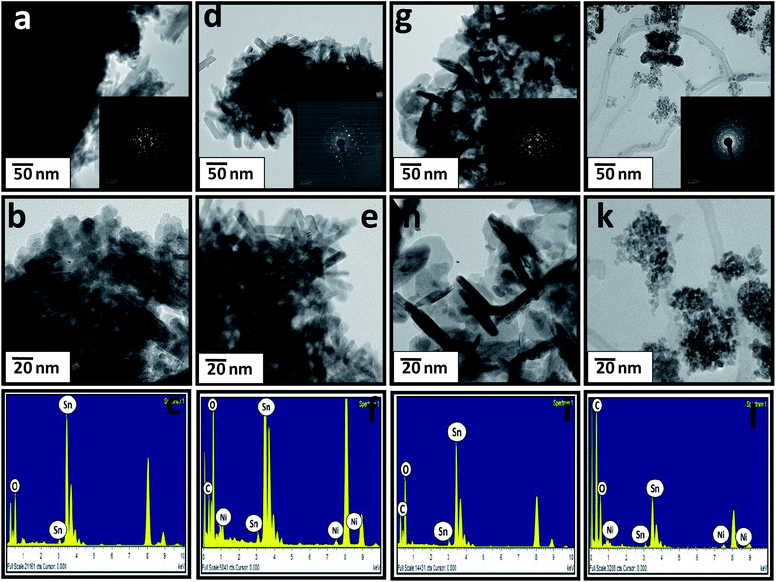 | ||
| Fig. 3 FETEM images of all the samples: (a and b) SnO; (d and e) SnNi; (g and h) SnCn; and (j and k) SnNiCn. EDAX spectra of all the samples: (c) SnO; (f) SnNi; (i) SnCn; and (l) SnNiCn. | ||
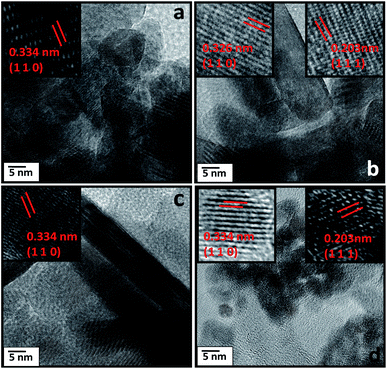
Fig. 4a–d shows the interplanar crystal spacing of tetragonal rutile SnO2 crystals (0.334 nm for the (101) plane) and Ni. The measured Interplanar distance shows the existence of tetragonal rutile SnO2 along with Ni (0.203 nm for the (111) plane).
The elemental mapping of SnNi, SnCn, and SnNiC (Fig. 5) shows the coexistence and uniform distribution of Sn, O, C, and Ni in the respective samples.
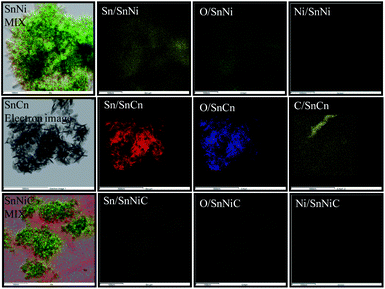 | ||
| Fig. 5 Elemental mapping of all samples: Sn, O, and Ni for the SnNi nanocomposite; Sn, O, and C for the SnCn nanocomposite; and Sn, O, Ni, and C for the SnNiC nanocomposite. | ||
X-ray photoelectron spectroscopy (XPS) analysis of the prepared SnO2, SnO2/Ni, SnO2/CNT, and SnO2/Ni/CNT samples was carried out to study the oxidation chemical states of the elements. The fitted peaks in the XPS spectra were separated using XPS Peak 4.1 software.
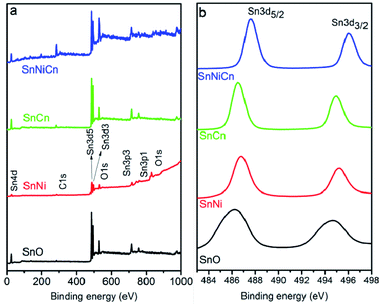
Fig. 6a shows the survey spectra of SnO2, SnO2/Ni, SnO2/CNT, and SnO2/Ni/CNT. The carbon 1s spectrum at 284.8 eV was used as a reference for calibration. The elemental compositions and oxidation states of the nanomaterials were investigated via XPS. Fig. 6b and 7 display spectra of SnO2, SnO2/Ni, SnO2/CNT, and SnO2/Ni/CNT, confirming the presence of Sn, O, C, and Ni elements. The C 1s peak intensities for SnCn and SnNiCn were strengthened because of the introduction of CNTs. Fig. 6b shows the Sn 3d orbitals of SnO2, SnO2/Ni, SnO2/CNT, and the SnO2/Ni/CNT nanomaterial. Fig. 6b confirms the existence of Sn 3d5/2 and Sn 3d3/2 peaks for all four materials with binding energies of 486.2 and 494.6 eV; 486.8 and 495.2 eV; 486.5 and 494.9 eV; and 487.6 and 496 eV for SnO2, SnO2/Ni, SnO2/CNT, and SnO2/Ni/CNT nanomaterials, respectively. For SnNi and SnNiC, however, these peaks are shifted to higher binding energies because of the Ni ions in SnO2.
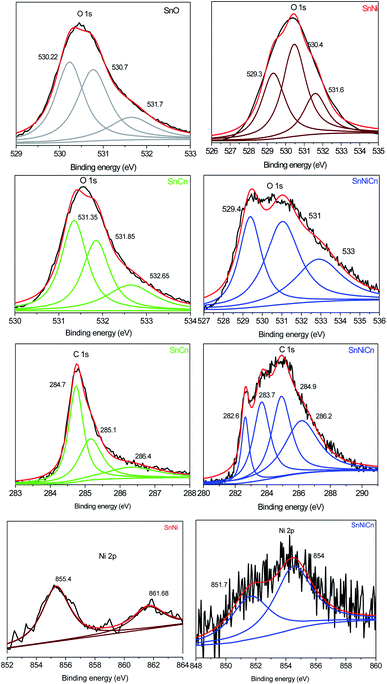 | ||
| Fig. 7 XPS analysis: the O 1s regions for SnO, SnNi, SnCn, and SnNiCn; the C 1s regions for SnCn and SnNiCn; and the Ni 2p regions for SnNi and SnNiCn. | ||
Fig. 7 shows the O 1s, C 1s and Ni 2p regions for SnO2, SnO2/Ni, SnO2/CNT, and SnO2/Ni/CNT samples. The high-resolution O 1s spectra of all four nanomaterials can be deconvoluted into three peaks with binding energies of 530.2, 530.7, and 531.7 eV for SnO; 529.3, 530.4, and 531.6 eV for SnNi; 531.3, 531.8, and 532.6 eV for SnCn; and 529.4, 531, and 533 eV for SnNiCn.21 The C 1s spectra of the prepared SnCn and SnNiCn samples could be deconvoluted into different peaks, i.e., 284.7, 285.1, and 286.4 eV; and 282.6, 283.7, 284.9, and 286.2 eV, respectively. The strong C 1s peaks at 284.7 and 283.7 eV correspond to C–C bonds in the carbon nanotubes. The peaks located at 285.1 and 286.4 eV, and at 284.9 and 286.2 eV are related to carbon in epoxide C–O groups and carboxyl C![[double bond, length as m-dash]](https://www.rsc.org/images/entities/char_e001.gif) O carbon, respectively.9 The Ni 2p core-level spectra of SnNi and SnNiCn show doublet components, which are demonstrated in Fig. 7. The peak located at 855.4 eV for SnNi and those at 854 and 851.7 eV for SnNiCn are close to the binding energies of Ni 2p3/2 and Ni 2p1/2, which indicates the presence of zero valent Ni.30 The other peak of SnNi at a binding energy of 861.7 eV is ascribed to a satellite peak.
O carbon, respectively.9 The Ni 2p core-level spectra of SnNi and SnNiCn show doublet components, which are demonstrated in Fig. 7. The peak located at 855.4 eV for SnNi and those at 854 and 851.7 eV for SnNiCn are close to the binding energies of Ni 2p3/2 and Ni 2p1/2, which indicates the presence of zero valent Ni.30 The other peak of SnNi at a binding energy of 861.7 eV is ascribed to a satellite peak.
The possible mechanism of formation of the SnO2/Ni/CNT nanocomposite is discussed below. Pristine SnO2 is formed as per the following reaction (eqn (3)), where NaCl is formed as a by-product.
| SnCl4 + 4NaOH → SnO2 + 4NaCl + nH2O | (3) |
| SnCl4 + 4NaOH + Ni(NO3)3 + CNT → Ni@SnO2@CNT + 4NaCl + 3HNO3 + nH2O | (4) |
In the formation of SnO2/Ni/CNT using tin chloride, initially SnO2 is formed via the decomposition of tin hydroxide, which is favourable. Later, Ni hydroxide is formed along with SnO2. During calcination at 550 °C under an inert atmosphere, Ni hydroxide is decomposed into Ni nanoparticles. Since the carbon nanotubes are inert, they do not react with any precursors, and SnO2 and Ni are deposited onto the CNTs (eqn (4)).22,23
Electrochemical studies
Furthermore, to understand the electrochemical process, cycle voltammogram (CV) curves of all four electrodes (SnO, SnNi, SnCn, and SnNiCn) for the first three cycles were analyzed in the voltage range of 0.005–3 V vs. Li/Li+ at a scan rate of 0.2 mV s−1. The CV behaviour is in accordance with that reported previously, implying a similar lithiation/delithiation process.13 Fig. 8 shows that the CV curves of SnNi (Fig. 8b), SnCn (Fig. 8c), and SnNiCn (Fig. 8d) are in good agreement with the characteristics of pristine SnO2 (Fig. 8a). This indicates that the modification of SnO2 with CNTs and Ni did not change the electrochemical reaction process. The strong irreversible reduction peaks at around 0.68, 0.84, 0.82, and 0.81 V for SnO2, SnO2/Ni, SnO2/CNT, and SnO2/Ni/CNT, respectively, during the first cycle, were due to their reversible reduction of SnO2 to Sn, as given in the following equation:| Sn1−x + 4Li+ + 4e− → Sn1−xNix + 2Li2O | (5) |
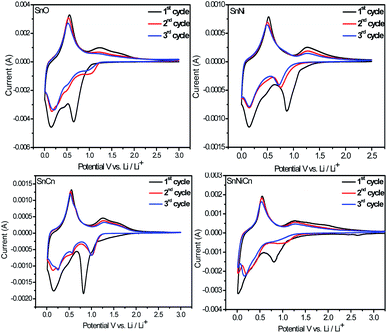 | ||
| Fig. 8 The first three consecutive CV curves of SnO, SnNi, SnCn, and SnNiCn at a scan rate of 0.2 mV s−1. | ||
In subsequent cycles, this peak no longer appeared, and irreversible capacity loss during the initial cycles was mostly due to the formation of Li2O or solid electrolyte interface (SEI) layers. In the first cycle, cathodic peaks were detected at about 0.145, 0.15, 0.15, and 0.16 V for SnO2, SnO2/Ni, SnO2/CNT, and SnO2/Ni/CNT, respectively, and an anodic peak at 0.55 V was detected, which corresponded to reversible alloying and dealloying, as described in eqn (5).
| Sn1−xNix + yLi+ + ye− → LiySn1−xNix (0 ≤ y ≤ 4.4) | (6) |
Oxidation peaks observed at around 1.22, 1.27, 1.25, and 1.27 V and reduction peaks to form the LiySn1−xNix alloy at around 1.03, 0.85, 1.0, and 1.07 V for SnO2, SnO2/Ni, SnO2/CNT, and SnO2/Ni/CNT, respectively, were assigned to the partial reversibility shown in eqn (6). This implied that the overall Li storage capacity of the SnO2 anodes increased. From the second cycle onwards, the CV curves almost overlap, suggesting the excellent reversibility of the electrochemical reactions. The addition of CNTs and doping with Ni prevented SnO2 from cracking, leading to an improvement in the redox behaviour.8,17,22
Electrochemical impedance spectroscopy (EIS) analysis was conducted to study the conductivity of ion transportation at the interface between the electrode and electrolyte. Fig. 9 shows AC impedance spectra of all SnO2-based electrodes, which were measured under identical conditions. Fig. 9a shows the Nyquist plots of all samples. These plots display semicircles in the high-frequency regions, with inclined lines in the low frequency regions. The EIS spectra show that the charge transfer resistance (Rct) of SnNiCn is only 7.46671 Ω, lower than the values for pristine SnO2 (125.8174 Ω), SnO2/Ni (102.255 Ω) and SnO2/CNT (74.10349 Ω), indicating the better electronic conductivity of SnNiCn.
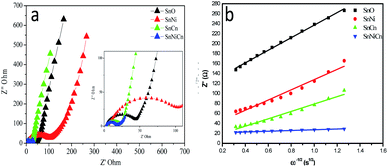 | ||
| Fig. 9 (a) Electrochemical impedance spectra and (b) the relationship between Zre and ω−1/2 from charge discharge data for all samples. | ||
The corresponding lithium diffusion coefficients are calculated on the basis of eqn (S4).†19,31,32 It can be clearly seen that the diffusion coefficients of the SnNiCn electrode vary within the range of 10−13 to 10−11 cm2 s−1, higher than the average value for pure SnO2. SnO2 with CNTs and Ni facilitates the penetration of the electrolyte and shortens the diffusion paths of lithium ions, thereby achieving good diffusion kinetics.
Fig. 10 shows the charge–discharge curves of all the optimized nanomaterials, i.e., pristine SnO2 (SnO), SnO2/Ni (SnNi), SNO2/CNT (SnCn), and SnO2/Ni/CNT (SnNiCn), at a current density of 50 mA g−1 in a voltage window of 0.005–3 V (vs. Li/Li+). The theoretical specific capacity of the composite was calculated to be 491.5 mA h g−1 based on the reversible capacities of the CNTs (372 mA h g−1) and SnO2 (1494 mA h g−1). SnO, SnNi, SnCn, and SnNiCn exhibited first charge capacities of 636, 836, 1486, and 2267 mA h g−1, respectively. The corresponding discharge capacities are observed to be 1445, 1564, 3098, and 5312 mA h g−1, respectively, for the first cycle, with initial coulombic efficiencies of 44, 53, 48, and 42%, respectively. Two poorly defined plateaus (at 0.7 and 1.25 V) can be identified in the charge–discharge profiles, which are in good agreement with the CV results. The degradation in the initial capacity indicates Li-ion irreversibility, which is ascribed to the formation of a solid electrolyte interface (SEI) layer and is also due to possible side reactions between lithium ions and residual functional groups of the carbon nanotubes. The SEI layer, which is generated on the carbon nanotubes and SnO2 in the form of Li2O, is an electronic insulator and hinders electron transfer. SnO2/Ni/CNT shows first discharge and charge capacities of 5312 mA h g−1 and 2267 mA h g−1 in the first cycle at 50 mA g−1. The coulombic efficiency (CE) of the first cycle is 43%, and the large loss of capacity results from the formation of the SEI film.12 The reported initial capacity is more than calculated theoretically because the theoretical capacity corresponds exclusively to the conversion reaction (711 mA h g−1) or the alloying reaction (783 mA h g−1). It is indicated that the initial discharge capacity, which is much higher than the theoretical value, when LiO2-based reactions are entirely irreversible, is almost entirely retained in the second cycle. This large capacity might be due to the increasing reversibility of Li+ insertion and extraction, particularly the reversibility of Li+ extraction from Li2O, and to the formation of the SEI film.7 Cyclic voltammetry showed that SEI formation occurred only in the first cycle, as indicated by the reduction peak near 0.9 V (vs. Li/Li+) during the first cycle. The further decrease in capacity is attributed to the pulverization of SnO2 caused by the drastic volumetric change of SnO2 during the insertion and extraction of Li ions. Well-dispersed nanosized-Ni-decorated stabilized SnO2 in combination with CNTs avoids pulverization due to the minimized volumetric changes of the nanoparticles. It shows the accommodation of huge volume expansion and avoids the agglomeration of nanoparticles.10
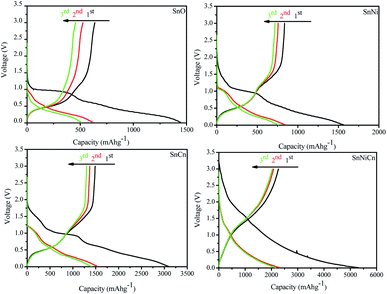 | ||
| Fig. 10 Electrochemical properties analysis. The initial discharge–charge profiles of electrodes of all samples: SnO, SnNi, SnCn, and SnNiCn at a current density of 50 mA g−1. | ||
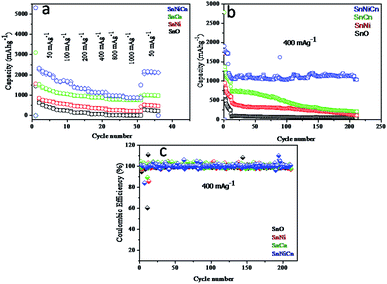
Fig. 11 shows the rate capability, cyclability, and coulombic efficiency data for the composites, with discharge capacity values calculated at different current densities, i.e., 50 to 1000 mA g−1, for SnO, SnNi, SnCn, and SnNiCn samples. Fig. 11a shows the rate capabilities of all samples. The average reversible discharge capacities at 50, 100, 200, 400, 800, and 1000 mA g−1 for SnNiCn are 5312, 1869, 1558, 1183, 980, and 919 mA h g−1, respectively. When the current density returned to 50 mA g−1, a capacity of 2166 mA h g−1 was retained. This demonstrates the good rate performance and, also, the superiority of the SnO2/Ni/CNT electrode with 4% Ni and 1% CNTs (SnNiCn) over pristine SnO2 (SnO). The reversible discharge capacities at 50, 100, 200, 400, 800, and 1000 mA g−1 for pristine SnO2 were observed to be 1445, 330, 177, 93, 17, and 5, respectively. At the same time, values of 1564, 650, 497, 396, 296, and 231 mA h g−1, respectively, were observed for SnNi (4% Ni), with values of 3098, 1188, 1015, 919, 823, and 774 mA h g−1, respectively, being obtained for SnCn (1% CNTs). When the specific current returned to 50 mA g−1, capacities of SnO, SnNi, and SnCn were 280, 524, and 1018 mA h g−1, respectively. At 1000 mA g−1, the pristine SnO2 electrode delivers a very poor capacity, while the capacity of the SnO2/Ni/CNT (SnNiCn) electrode shows a stable capacity, i.e., 919 mA h g−1, at such a high current density. The enhanced capacity observed is quite obvious in the case of the SnO2/Ni/CNT composite. The CNTs and Ni nanoparticles not only accommodate volume expansion due to pulverization but the metallic nanoparticles also act as an electrical conductor to facilitate electron transfer. This ultimately enhances the capacity of the nanocomposite. Fig. 11b shows cyclability data for all samples. To highlight the superiority of SnO2/Ni/CNT with 4% Ni and 1% CNTs (SnNiCn) as an anode material for lithium ion batteries, we have performed cycling stability testing of all electrodes for up to 210 cycles at a current density of 400 mA g−1. This clearly shows that the SnNiCn nanocomposite gives much better cycling performance compared with pristine SnO2 (SnO) and the other SnNi and SnCn electrodes. Initially, the first two cycles were carried out at 50 mA g−1 for activation, followed by eight cycles at 100 mA g−1 and 200 cycles at 400 mA g−1 to check the stability. SnO2/CNT with 1% CNTs (SnCn) and SnO2/Ni/CNT with 1% CNTs and 4% Ni (SnNiCn) both showed coulombic efficiencies (Fig. 10c) higher than 99.2% at 400 mA g−1 with good capacity, but after 50 cycles the SnCn composite shows fading, with a capacity of 680 mA h g−1, while SnNiCn shows a stable capacity of 1180 mA h g−1, even after 210 cycles. The SnNi composite shows fading, with a capacity of 250 mA h g−1, while pristine SnO2 shows a capacity of 50 mA h g−1 with fast fading. The stability of the capacity of SnNiCn might be due to the addition of an optimum concentration of Ni to the SnO2/CNT nanocomposite. The addition of Ni increases the conductivity and decreases the lattice volume expansion, which facilitates the alloying and dealloying process. The Ni nanoparticles can successfully inhibit Sn coarsening during cycling, resulting in the enhancement of the stability during reversible conversion reactions. Also, Ni nanoparticles serve as an effective catalyst for the decomposition of Li2O and the oxidation of metallic Sn from SnO2 according to the following reactions:19
| Ni + Li2O → NiO + 2Li+ + 2e− | (7) |
| NiO + 2Li+ + 2e− → Ni + Li2O | (8) |
This ultimately enhances the capacity, giving stability to the nanocomposite and improving performance. Also, an optimum amount of CNTs helps to support less degradation, because they act as a buffering agent against volume expansion and pulverization, and they can act as an electrical conductor to facilitate electron transfer involving nanosized SnO2. In contrast, in pristine SnO2 (i.e., without a Ni component or CNTs), huge volume expansion occurs during each cycle of lithiation and delithiation (Fig. S3†). For a more accurate analysis of the effects of the addition of CNTs and Ni, the rate performances of SnCn and SnNi samples mixed with 0.5% and 1.5% CNTs and 2 and 4% Ni were also studied and, based on the analysis of the test results, they showed better cycling performance than pristine SnO2 but lower capacities at high current densities than the sample with optimum levels of CNTs and Ni, i.e., 1% CNT and 4% Ni, which might be due to the agglomeration of SnO2.10
Conclusions
In summary, we have obtained pristine SnO2 and SnO2/Ni/CNT nanocomposites via a hydrothermal method. When SnO2/Ni/CNT was explored for use in LIBs, it delivered a high specific capacity of around 2267 mA h g−1 at 50 mA g−1. Even at a high current density of 400 mA g−1, the composite electrode exhibits a specific discharge capacity of 919 mA h g−1 after 210 cycles. The improved electrochemical performance was attributed to the use of optimum Ni and CNT concentrations. Due to the addition of an optimum concentration of Ni into the SnO2/CNT nanocomposite, the conductivity of the nanocomposite increases and the lattice volume expansion decreases, which facilitates the alloying and dealloying processes. Also, Ni nanoparticles can successfully inhibit Sn coarsening during cycling, resulting in the enhancement of stability during reversible conversion reactions. It is anticipated that such a detailed study of metal-oxide-based anodes for LIBs can provide a promising platform for battery applications.Conflicts of interest
There are no conflicts to declare.Acknowledgements
Ms Anuradha would like to thank the Ministry of Electronics and Information Technology (MeitY), Department of Science and Technology, for financial support towards the implementation of the project (No. SR/WOS-A/CS-119/2018) under the woman scientist fellowship scheme. Also, the authors would like to thank C-MET Pune for providing research facilities and the nanocrystalline materials group for kind support.Notes and references
- J. B. Goodenough, How we made the Li-ion rechargeable battery, Nat. Electron., 2018, 1(3), 204 CrossRef.
- J. B. Goodenough and K.-S. Park, The Li-ion rechargeable battery: a perspective, J. Am. Chem. Soc., 2013, 135(4), 1167–1176 CrossRef CAS PubMed.
- M. S. Whittingham, Materials challenges facing electrical energy storage, MRS Bull., 2008, 33(4), 411–419 CrossRef CAS.
- K. Gupta and N. Gupta, Advanced semiconducting materials and devices, Springer, 2016 Search PubMed.
- W.-H. Qu, F. Han, A.-H. Lu, C. Xing, M. Qiao and W.-C. Li, Combination of a SnO2–C hybrid anode and a tubular mesoporous carbon cathode in a high energy density non-aqueous lithium ion capacitor: preparation and characterisation, J. Mater. Chem. A, 2014, 2(18), 6549–6557 RSC.
- Y. Chen, J. Lu, S. Wen, L. Lu and J. Xue, Synthesis of SnO2/MoS2 composites with different component ratios and their applications as lithium ion battery anodes, J. Mater. Chem. A, 2014, 2(42), 17857–17866 RSC.
- S. M. Jung, D. W. Kim and H. Y. Jung, Unconventional capacity increase kinetics of a chemically engineered SnO2 aerogel anode for long-term stable lithium-ion batteries, J. Mater. Chem. A, 2020, 8(17), 8244–8254 RSC.
- X. Zhou, L. Yu and X. W. D. Lou, Nanowire-templated formation of SnO2/carbon nanotubes with enhanced lithium storage properties, Nanoscale, 2016, 8(15), 8384–8389 RSC.
- J. Zhang, Y. Zhu, C. Cao and F. K. Butt, Microwave-assisted and large-scale synthesis of SnO2/carbon-nanotube hybrids with high lithium storage capacity, RSC Adv., 2015, 5(72), 58568–58573 RSC.
- D. Kim, D. Lee, J. Kim and J. Moon, Electrospun Ni-added SnO2–carbon nanofiber composite anode for high-performance lithium-ion batteries, ACS Appl. Mater. Interfaces, 2012, 4(10), 5408–5415 CrossRef CAS PubMed.
- T. Liang, R. Hu, H. Zhang, H. Zhang, H. Wang, Y. Ouyang, J. Liu, L. Yang and M. Zhu, A scalable ternary SnO2–Co–C composite as a high initial coulombic efficiency, large capacity and long lifetime anode for lithium ion batteries, J. Mater. Chem. A, 2018, 6(16), 7206–7220 RSC.
- W. Chen, K. Song, L. Mi, X. Feng, J. Zhang, S. Cui and C. Liu, Synergistic effect induced ultrafine SnO2/graphene nanocomposite as an advanced lithium/sodium-ion batteries anode, J. Mater. Chem. A, 2017, 5(20), 10027–10038 RSC.
- Q. Zhao, L. Ma, Q. Zhang, C. Wang and X. Xu, SnO2-based nanomaterials: synthesis and application in lithium-ion batteries and supercapacitors, J. Nanomater., 2015, 2015, 850147 Search PubMed.
- Z. Lu, Z. Kong, L. Jing, T. Wang, X. Liu, A. Fu, P. Guo, Y.-G. Guo and H. Li, Porous SnO2/Graphene Composites as Anode Materials for Lithium-Ion Batteries: Morphology Control and Performance Improvement, Energy Fuels, 2020, 34(10), 13126–13136 CrossRef CAS.
- M. S. Park, Y. M. Kang, G. X. Wang, S. X. Dou and H. K. Liu, The effect of morphological modification on the electrochemical properties of SnO2 nanomaterials, Adv. Funct. Mater., 2008, 18(3), 455–461 CrossRef CAS.
- H. Chen, L. Ding, W. Sun, Q. Jiang, J. Hu and J. Li, Synthesis and characterization of Ni doped SnO2 microspheres with enhanced visible-light photocatalytic activity, RSC Adv., 2015, 5(69), 56401–56409 RSC.
- Z. Zhang, L. Wang, J. Xiao, F. Xiao and S. Wang, One-pot synthesis of three-dimensional graphene/carbon nanotube/SnO2 hybrid architectures with enhanced lithium storage properties, ACS Appl. Mater. Interfaces, 2015, 7(32), 17963–17968 CrossRef CAS PubMed.
- R. Shen, Y. Hong, J. J. Stankovich, Z. Wang, S. Dai and X. Jin, Synthesis of cambered nano-walls of SnO2/rGO composites using a recyclable melamine template for lithium-ion batteries, J. Mater. Chem. A, 2015, 3(34), 17635–17643 RSC.
- A. A. Ambalkar, R. P. Panmand, U. V. Kawade, Y. A. Sethi, S. D. Naik, M. V. Kulkarni, P. V. Adhyapak and B. B. Kale, Facile synthesis of SnO2@carbon nanocomposites for lithium-ion batteries, New J. Chem., 2020, 44(8), 3366–3374 RSC.
- C. Dong, W. Dong, Q. Zhang, X. Huang, L. Gu, I.-W. Chen and F. Huang, Sulfur-terminated tin oxides for durable, highly reversible storage of large-capacity lithium, J. Mater. Chem. A, 2020, 8(2), 626–631 RSC.
- M. Kandasamy, A. Seetharaman, D. Sivasubramanian, A. Nithya, K. Jothivenkatachalam, N. Maheswari, M. Gopalan, S. Dillibabu and A. Eftekhari, Ni-doped SnO2 nanoparticles for sensing and photocatalysis, ACS Appl. Nano Mater., 2018, 1(10), 5823–5836 CrossRef CAS.
- X. Ye, W. Zhang, Q. Liu, S. Wang, Y. Yang and H. Wei, One-step synthesis of Ni-doped SnO2 nanospheres with enhanced lithium ion storage performance, New J. Chem., 2015, 39(1), 130–135 RSC.
- H. Tang, X. Yu, S. Jin, F. Meng, Y. Yan and Z. Gao, Facile synthesis of hierarchical CNF/SnO2/Ni nanostructures via self-assembly process as anode materials for lithium ion batteries, R. Soc. Open Sci., 2018, 5(6), 171522 CrossRef PubMed.
- L. Sun, H. Si, Y. Zhang, Y. Shi, K. Wang, J. Liu and Y. Zhang, Sn–SnO2 hybrid nanoclusters embedded in carbon nanotubes with enhanced electrochemical performance for advanced lithium ion batteries, J. Power Sources, 2019, 415, 126–135 CrossRef CAS.
- J. Cui, S. Yao, J.-Q. Huang, L. Qin, W. G. Chong, Z. Sadighi, J. Huang, Z. Wang and J.-K. Kim, Sb-doped SnO2/graphene–CNT aerogels for high performance Li-ion and Na-ion battery anodes, Energy Storage Materials, 2017, 9, 85–95 CrossRef.
- C. Ma, J. Jiang, Y. Han, X. Gong, Y. Yang and G. Yang, The composite of carbon nanotube connecting SnO2/reduced graphene clusters as highly reversible anode material for lithium-/sodium-ion batteries and full cell, Composites, Part B, 2019, 169, 109–117 CrossRef CAS.
- Y. Wang, Z. X. Huang, Y. Shi, J. I. Wong, M. Ding and H. Y. Yang, Designed hybrid nanostructure with catalytic effect: beyond the theoretical capacity of SnO2 anode material for lithium ion batteries, Sci. Rep., 2015, 5(1), 1–8 CAS.
- M. Sahoo and S. Ramaprabhu, Solar synthesized tin oxide nanoparticles dispersed on graphene wrapped carbon nanotubes as a Li ion battery anode material with improved stability, RSC Adv., 2017, 7(23), 13789–13797 RSC.
- L. Vellingiri, K. Annamalai, R. Kandasamy and I. Kombiah, Characterization and hydrogen storage properties of SnO2 functionalized MWCNT nanocomposites, Int. J. Hydrogen Energy, 2018, 43(22), 10396–10409 CrossRef CAS.
- B. Zhao, X. Guo, W. Zhao, J. Deng, G. Shao, B. Fan, Z. Bai and R. Zhang, Yolk–shell Ni@SnO2 composites with a designable interspace to improve the electromagnetic wave absorption properties, ACS Appl. Mater. Interfaces, 2016, 8(42), 28917–28925 CrossRef CAS PubMed.
- U. V. Kawade, A. A. Ambalkar, R. P. Panmand, R. S. Kalubarme, S. R. Kadam, S. D. Naik, M. V. Kulkarni and B. B. Kale, Silicon nanoparticle-sandwiched ultrathin MoS2–graphene layers as an anode material for Li-ion batteries, Mater. Chem. Front., 2019, 3(4), 587–596 RSC.
- U. V. Kawade, M. S. Jayswal, A. A. Ambalkar, S. R. Kadam, R. P. Panmand, J. D. Ambekar, M. V. Kulkarni and B. B. Kale, Surface modified Li4Ti5O12 by paper templated approach for enhanced interfacial Li+ charge transfer in Li-ion batteries, RSC Adv., 2018, 8(67), 38391–38399 RSC.
Footnote |
| † Electronic supplementary information (ESI) available. See DOI: 10.1039/d1ra01678d |
| This journal is © The Royal Society of Chemistry 2021 |

